
Relying on history can be useful as a guide, and statistical studies of course have merit, but, as the market has shown time and time again, there are occasions where it will deliver a first-time event that shocks most investors.
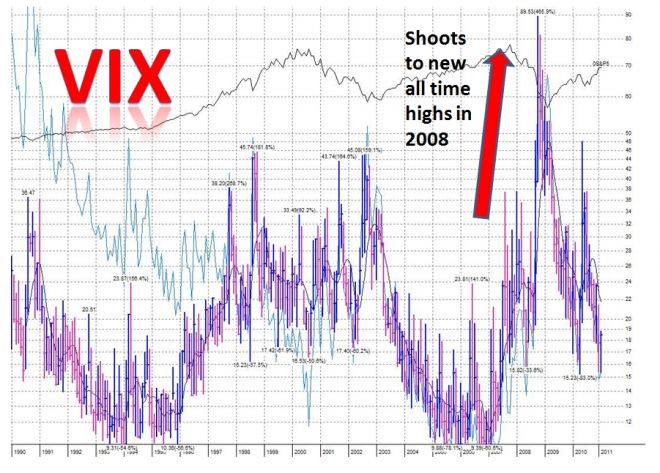
We don't have to go very far back to see evidence of this, especially in today's market environment. On September 29, 2008, the VIX spiked to an all time high of 48.4. Pundits and participants started buying the dip thinking that since the VIX has always dropped from such levels which always served as an excellent place to enter, this would be easy money. But instead, the general markets proceeded to immediately crash in the days that followed, with the VIX spiking to 89.53, doubling prior record highs set in 1998 and 2002. The VIX monthly chart 1990-2011 is shown below. Each bar = 1 month:
Since the crash of 2008, the market has entered into the age of quantitative easing, or QE. Consequently, QE has thrown off most all tried-and-true indicators that have worked for decades. Here is an interesting article on the matter:
http://online.barrons.com/article/SB50001424052970204853904576090902595560880.html?mod=BOL_hpp_dc
And with the advent of high frequency trading, many short term indicators have been rendered useless. Fortunately, the markets do continue to trend so the Market Direction Model continues to have strong years https://www.virtueofselfishinvesting.com/results as the gains made during trending periods well more than offset the small losses from false signals. Please note, if the signal change comes during the day, I take that current price. If the signal comes after the close but before the open, I take closing prices to keep it consistent since some will buy after the close or before the open. For example, the closing price on 1/11/11 was 49.45. Thus, on a day where the market gaps down, the model's performance is slightly penalized. On a day when the market gaps up such as 1/12/11, performance is slightly enhanced.
For those who have been affected by high frequency trading, it may have a limited life expectancy:
http://www.theglobeandmail.com/globe-investor/putting-the-hammer-to-high-frequency-traders/article1871294/
Keep in mind that all these recent one time occurrences that alter the tone of the market can be observed in prior decades. For example, Alan Greenspan gave his infamous "irrational exuberance" speech in December 1996 when market capitalization as a % of nominal GDP hit all time highs not ever seen before in the history of the country. The chart below goes back to the year 1924.
Of course, we all know that the market did not actually top out until March 2000, as the NASDAQ Composite proceeded to rise 381% from the date of the speech.
Indeed, the market can stay "irrational" longer than one can stay solvent. Thus it is always prudent to set sell stops, and watch the price/volume action of the leading stocks and major indices to guide your level of exposure to the market. We will continue to provide guidance and ideas in terms of market exposure, position sizing, and individual ETF and stock selection through our five services.