
The short side of the market, specifically with respect to recent Short-Sale Set-Ups we have identified and for which reports were sent out this past week, has presented a mixed bag. This is not surprising given the uncertainty and volatile, directionless market index action.
However, we believe that the current market situations remains somewhat unresolved and therefore those who are inclined to short stocks (hopefully after having read both "How to Make Money Selling Stocks Short" by Wm. O'Neil & Gil Morales and "Short-Selling with the O'Neil Disciples" by Gil Morales & Dr. Chris Kacher) should have some ideas ready in the event that the market indexes break near-term support and move to lower lows.
Keep in mind that short-sale set-ups will tend to work best IF the general market breaks to lower lows. This is why one must remain flexible and persistent, being willing to short and cover and short again several times before catching a significant downside break. We do notice that consumer-related SS targets like DIS, HD, and MCD appear to be weaker currently and hence would represent the slower animals in the herd upon which to prey on the short side.
Below are some notes regarding recent SS Set-Ups we've reported on:
AMZN - was able to close above the $700 Century Mark on Friday. This keeps it on the fence as a short-sale target, since it could very well just be pulling back into the top of its prior base in preparation for a move back to the upside. Since this would constitute a late-stage failed-base (LSFB) set-up if it broke to the downside, the odds are that such an LSFB as AMZN's would only work IF the general market breaks down. As well, major market breaks are often associated with big, leading stocks failing on recent base breakouts. Therefore AMZN should be watched for signs of failure, but IF the general market is able to find its feet and move back to the upside, we would be more inclined to be buyers of the stock instead of short-sellers or natural sellers. AMZN has a high beta so has shown a tendency to outperform the general market in times of strength, but also to fall further than the markets in times of weakness.
DIS - is rallying back up to the 50-day moving average. As it approaches the line it reaches its most optimal short-sale point using the 50-day moving average as a guide for a tight upside stop.
FB - this remains on the fence as it continues to hold its 20-day moving average. We view FB similarly to how we view AMZN. It is a big-stock leader that has recently broken out of what could be a later-stage base but so far has not shown any decisive action that would indicate a late-stage base-failure. However, our view is that IF the general market were to break to lower lows, the odds of FB busting through its 20-day moving average in decisive fashion increase significantly. In this manner the stock should be watched for a decisive breach of the 20-day line, which would be your first clue of a potential late-stage failed-base (LSFB) short-sale set-up.
GOOGL - continues to find resistance along its 20-day and 200-day moving averages and remains in a shortable position using either moving average as a guide for an upside stop. As well, any weak rally back up into the 20-day line could constitute an optimal short-sale entry point.
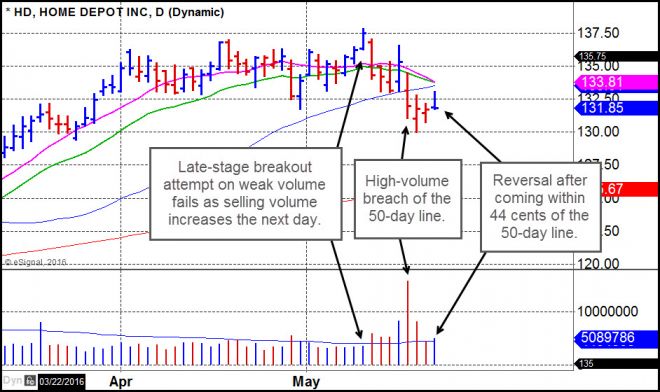
HD - stock rallied up near its 50-day moving average on Friday where it became shortable on an intraday basis before it reversed to close near the lows of its daily price range. We would continue to view this as shortable using the 50-day line at 133.51 as a guide for a very tight upside stop.
MBLY - closed Friday right at the 20-day moving average which technically puts it in an optimal short-sale position. However, selling volume over the past four days has dried up significantly, which may be a clue that he stock will attempt to push above its 20-day moving average.
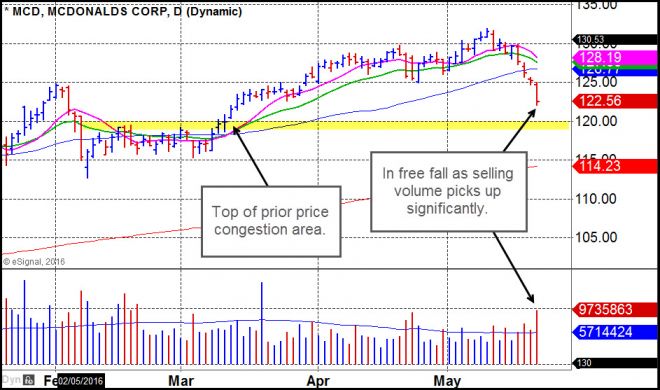
MCD - a beautiful short for anyone who hit this one on the short side on the basis of our weekend SS Set-Up report. Th stock has continued to blow apart, pushing further to the downside on Friday on very heavy selling volume. Our near-term downside price target is the 120 price area, which represents the top of a prior area of price congestion, while the 200-day moving average at 114.23 would constitute our intermediate downside price target.
NFLX - stock managed to close just above its 20-day moving average on Friday, but this brings it right up to the highs of its price range extending back to the beginning of May. Thus this could represent an area of overhead resistance that is also just slightly above the 20-day line. It is not uncommon for SS target stocks to rally just past a key moving average but still find resistance at a prior range high. Thus this could be considered shortable here using the high of Friday at 93.28 as a guide for a quick and tight upside stop. A continued rally could carry the stock as high as the 50-day line at 97.49 which could present an more optimal short-sale point should that occur.
TSLA - company priced a 9.5 million share secondary offering at 215 on Friday morning, and the stock has rallied on strong volume, closing just below its 20-day moving average on Friday. at 220.28. This would have quickly stopped out any short-sale attempt near the 215-216 price level per our earlier reports. There is potential for TSLA to continue rallying given the favorable outcome of the secondary offering and the continued high short-sale interest in the stock. We would need to see buying volume diminish at a potential area of overhead resistance before we would view this as an optimal short. Currently, we view the potential for further upside to be higher than for some sort of reversal to occur.