
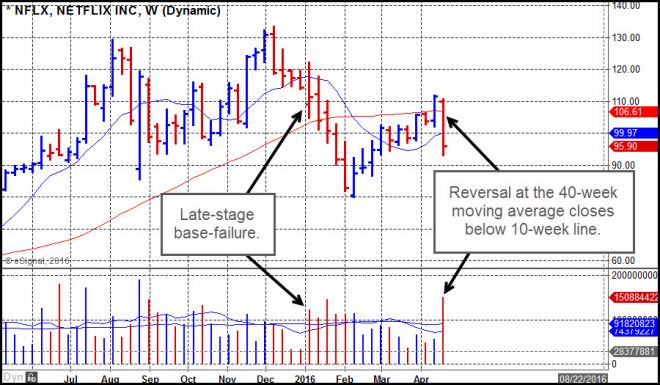
Netflix (NFLX) recently reversed at its 40-week moving average following earnings on a big gap-down failure that took it below both the 40-week and 10-week lines, as can be seen on the weekly chart below. This action is occurring after a rally up to the 40-week line within what is an overall Late-Stage Failed-Base (LSFB) topping formation. The break below the 10-week line brings it into play as a short-sale set-up using any rally into the 10-week line at 99.97 as your most optimal entry. Otherwise, the 10-week line serves as your guide for an upside stop.
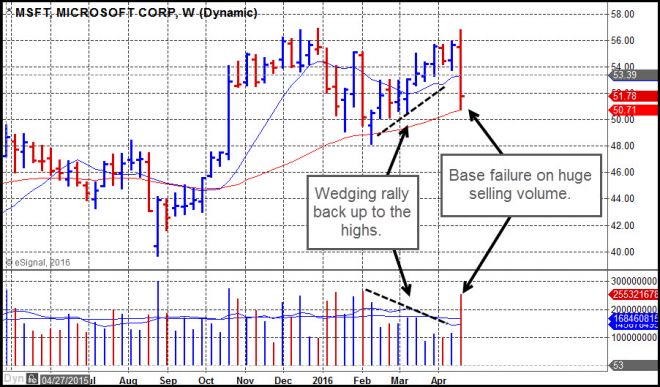
Microsoft (MSFT) recently failed after attempting to clear to new high price ground earlier this week. After announcing earnings on Thursday after the close, the stock gapped down to its 200-day moving average (40-week on the weekly chart below) on Friday and then bounced on an intraday basis. Nevertheless, this is the start of what appears to be a later-stage failed-base short-sale set-up. We would look to use rallies up into the 10-week line at 53.9 as the most optimal short-sale entry opportunities. On the daily chart, Friday presents as a gap down, thus any rally up into its 50-day line at 53.45 would be the comparable optimal short-sale entry point.
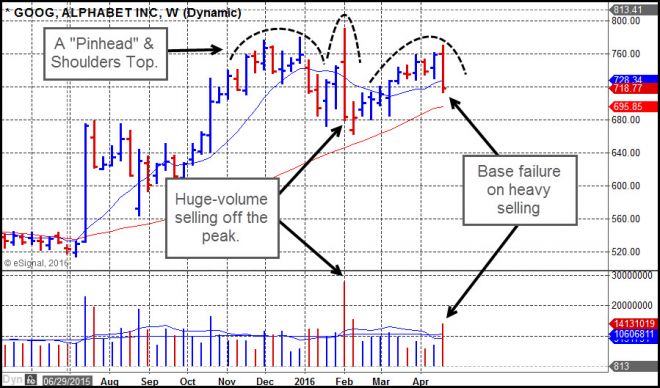
The stock formerly known as Google, Alphabet (GOOG), also failed after missing on earnings Thursday after the close. The stock gapped down to a point just above its 10-week moving average and then proceeded to move lower before closing below the line on heavy selling volume. In addition to looking like an odd-shaped late-stage failed-base short-sale set-up, it also has the look of the rare "Pinhead" & Shoulders variation of the classic Head & Shoulders top. The "pinhead" occurs on a brief move to higher highs that reverses on huge volume. Because the right side of any "head" in an H&S formation should generally show very heavy selling volume as the stock fails from a prior peak price, this can be viewed in a similar manner to an H&S. Notice that, like MSFT, GOOG had a low-volume wedging sort of rally off of the February lows and back up towards the highs of this "P&H" structure, forming a right shoulder. The break below the 10-week line brings this into play as a short-sale set-up using rallies back up into the 10-week line at 728.34 as your most optimal entries. Given that the stock is currently less than 2% away from the 10-week line, one could short the stock at current levels and then look to use the 10-week line as a guide for an upside stop. On the daily chart, Friday presents as a gap down, thus any rally up into its 50-day line at 726.48 would be the comparable optimal short-sale entry point.
The breakdowns in these big-stock NASDAQ leaders may be telling with respect to the state of he overall general market. This sort of granular evidence in indvidual leading stocks is also behind the rationale for moving our Market Direction Model to a neutral/cash signal earlier this past week. We would keep a close eye on big-stock NASDAQ names like Apple (AAPL), Facebook (FB), and Amazon.com (AMZN) this coming week as all three stocks are expected to announce earnings in the coming days. More breakdowns in big-stock leaders (note that AAPL has already reversed at it 200-day moving average on heavy selling earlier this past week) like these could add weight to at least a short- to intermediate-term bearish view of he general market.