
Current Focus List
There are currently no names on the Focus List.
The VoSI Focus List is a compilation and reference list of stocks for which Pocket Pivot or Buyable Gap-Up Reports have been issued and which have been deemed suitable for inclusion on the Focus List. Not all stocks for which a Pocket Pivot or Buyable Gap-Up report has been issued will necessarily be added to the list. It is not intended as a "buy list" or a list of immediately actionable recommendations. Stocks on the list may or may not be in proper buy positions, and investors should exercise discretion and proper judgement in determining when and where stocks on the Focus List can be purchased. The following notes are intended to assist in this process. Please note that members can enlarge the Focus List image by clicking on the body of the email and then holding the Control Key while pressing the "+" key until it is large enough to read.
General Observations:
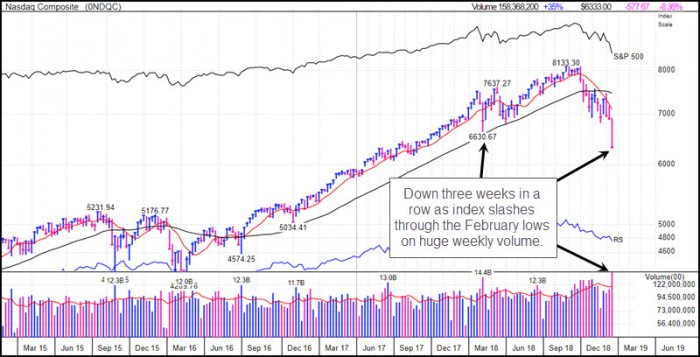
The NASDAQ Composite Index is now -22.8% off its 2018 all-time highs, reaching what many define as "bear market territory." It posted its third straight down week as the hope-for Santa Claus Rally has deteriorated into a full-blown "Christmas Chrash." The NASDAQ along with all of the other major market indexes, slashed below its February 2018 lows as broken, formerly leading stocks continue to forge lower lows. The weekly chart of the NASDAQ, below, with an abnormally weekly price bar to the downside on massive volume, paints a very bearish picture for this market. Beware!
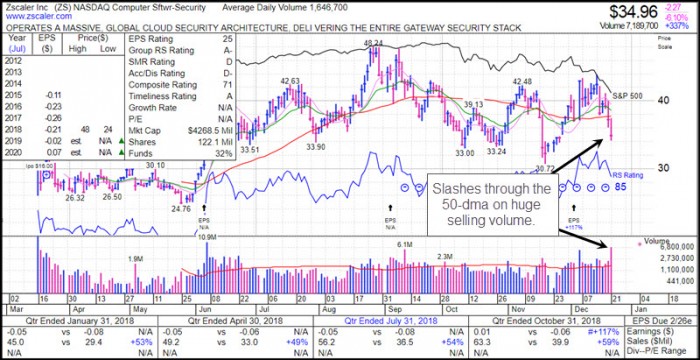
Zscaler (ZS) slashed through its 50-dma on Friday and is now down -20.54% below its $44 price peak of two Fridays ago. The $44 price also marked the peak of a right shoulder in a multi-month head and shoulders formation. With the stock now rolling over in its third right shoulder and breaking well below the 50-dma on Friday, it is short-term extended on the downside. However, rallies up into the 50-dma should be watched for as potential secondary short-sale entry opportunities.
The uniformity with which individual stocks have been breaking sharply to the downside, essentially splitting wide open, has short-selling a certain "generic" attribute in that you can pretty much throw a dart and hit a stock that's going to streak lower. This is symptomatic of a very sick market where money is steadily exiting and takes every opportunity to sell into rallies.
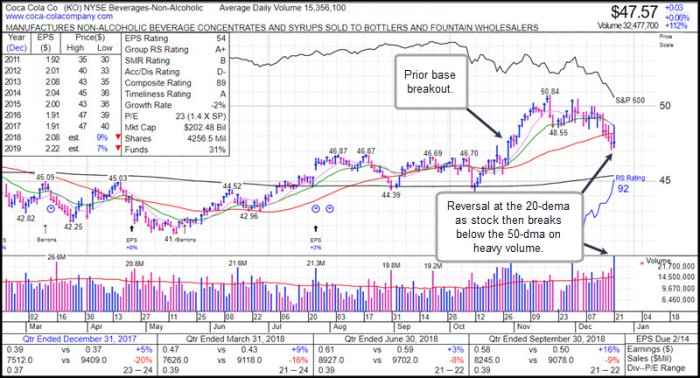
Even defensive names are starting to take some heat, as we the chart of Coca-Cola Company (KO) shows below. The stock briefly rallied on Friday and ran into resistance at its 20-dema before reversing sharply to close back below the 50-dma. This is the first sign of a potential late-stage base-failure, and makes the stock a short-sale target on rallies up to the 50-dma or even further to the 20-dema. When money is leaving the stock market, eventually it leaves everything, and nothing is immune to selling.
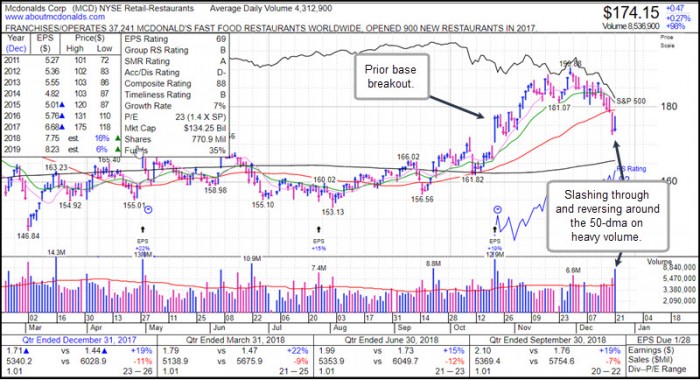
We also note that McDonald's (MCD), typically a defensive type of name, has also broken below its 50-dma and is now looking to test a prior base breakout. The breach of the 20-dema over a week ago was the first sign of a potential failure, and this past week's break below the 50-dma is starting to confirm this. All that is left is a final failure back below the prior base breakout point.
One of the phenomena of this market that Gil has discussed extensively in our live webinars is this idea of prior, massive PE-expansions reversing into massive PE-contractions. These then drive massive price declines. When money is essentially free, it can drive up asset prices, including stocks, to previously unknown valuation levels. After all, all that money that the Fed has systematically pumped into the system as it distorts interest rates and asset prices over the past ten years has to go somewhere! We have observed this phenomena in the expansions of PEs not only in high-flying, zero-earnings or tiny-earnings tech names, but also in old-line, established big-cap names.
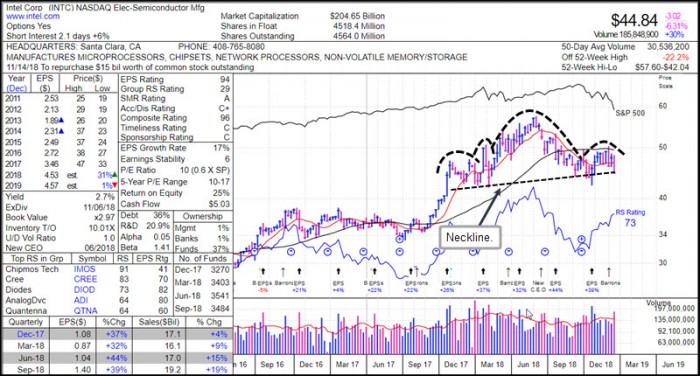
For example, in this QE-driven bull market, we have seen PEs for simple semiconductor stocks like Intel (INTC), for example, get inflated to well over 20 times earnings from historical ranges that were closer to 8-10 times earnings.This has also occurred in old-line industrials like railroads. which historically, at least in our 27-year memories as investors, were below 10, even 8 times earnings. If one understands the dynamics of PE-expansions and contractions in bull and bear market phases, then a strong argument can be made for some sharp PE-contractions, hence price declines, taking hold after a massively QE-distorted, free-money market period.
Thus, at 23 times earnings, both MCD and KO, which, in our 27-year memories, have typically sold for 10-15 times earning, could easily be vulnerable to sharp PE-contractions and sharply lower prices in a continuing bear market. This implies the potential for late-stage failed-base (LSFB) short-sale set-up developing in each, and our first clue has been their recent breaches of their 20-dema and 50-dma lines. INTC already began to suffer the effects of PE-contraction back in mid-summer when it topped out at $57.60. Since then it has built a very large head and shoulders formation and has yet to break below the neckline. And if we see the "E" in "PE" also contract, then INTC could very well be set for an eventual downside breakout through this neckline.
In our view, this PE-contraction theme following massive QE-induced, even QE-distorted, PE-expansions, could continue to drive a worsening bear market. And, the only thing that might, and we emphasize might, cause a resumption of these massive PE-expansions and perhaps stability to the market, would be a reversal by the Fed towards zero interest rates and again growing its balance sheet, which has been contracting steadily. But then the genie may already be out of the bottle, and any attempt to re-liquefy by flooding the system once again could eventually result in a run on the dollar or have other, disastrous linkages and effects. The situation is complex, and fraught with pitfalls, mainly because in many ways we are in entirely uncharted territory given the massive monetary stimulus since 2009. And that's just monetary stimulus. At the same time it has been associated with its stimulative hand-maidens, such as the fiscal sugar-high created by consistent, $1 trillion-plus U.S. budget deficits and ever-higher U.S. national debt, now pushing through $22 trillion. The final trading week of the year may be a tumultuous one, so fasten your seat-belts!
The Market Direction Model (MDM) briefly shifted to a buy signal on Friday but just as quickly shifted back to a cash signal on the same day. It was an unsuccessful attempt to catch a possible turn in the market given the highly oversold condition. But, as we know, in a brutal bear market oversold and become a lot more oversold. Singular, this has been the weakest market at this time of year in many decades. The CBOE options put/call ratio spiked to 1.37 earlier this week yet it did not produce a bounce. There have been no Xmas crashes on record, yet this one qualifies, underscoring the stark weakness of the current environment. Thursday's pummelling spiked the put/call to 1.82, at least a 5+ year high, yet the market still could not rally. The put/call remained elevated on Friday at 1.43 as new index lows were achieved.