Current Focus List

The VoSI Focus List is a compilation and reference list of stocks for which Pocket Pivot or Buyable Gap-Up Reports have been issued and which have been deemed suitable for inclusion on the Focus List. Not all stocks for which a Pocket Pivot or Buyable Gap-Up report has been issued will necessarily be added to the list. It is not intended as a "buy list" or a list of immediately actionable recommendations. Stocks on the list may or may not be in proper buy positions, and investors should exercise discretion and proper judgement in determining when and where stocks on the Focus List can be purchased. The following notes are intended to assist in this process. Please note that members can enlarge the Focus List image by clicking on the body of the email and then holding the Control Key while pressing the "+" key until it is large enough to read.
General Observations:
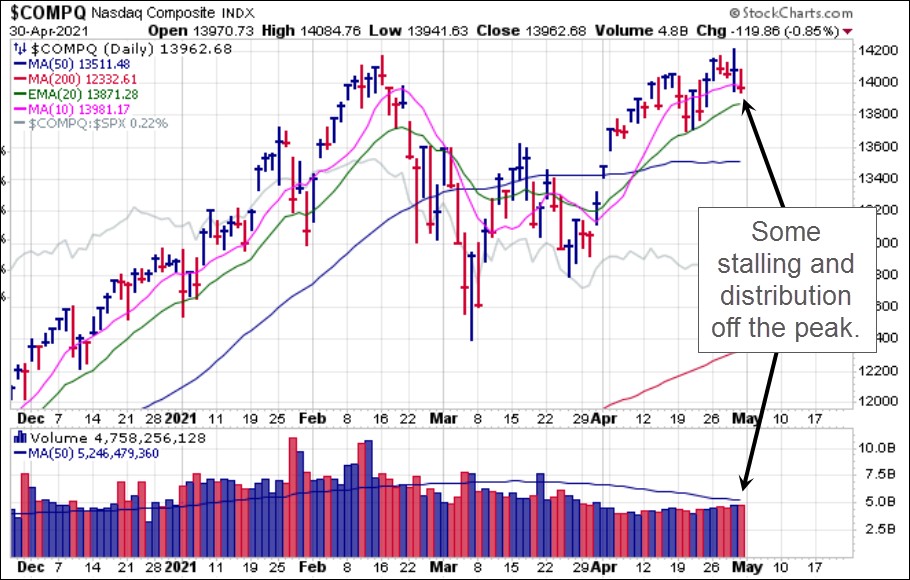
Major market indexes remain at or near all-time highs, but have run into some slight stalling and distribution off the peak particularly the NASDAQ Composite Index. The paradox of a market where the indexes remain near their highs where group after group of leading stocks start to rollover persists. This is why we continue to find NOTHING that meets the criteria for inclusion on our Focus List.
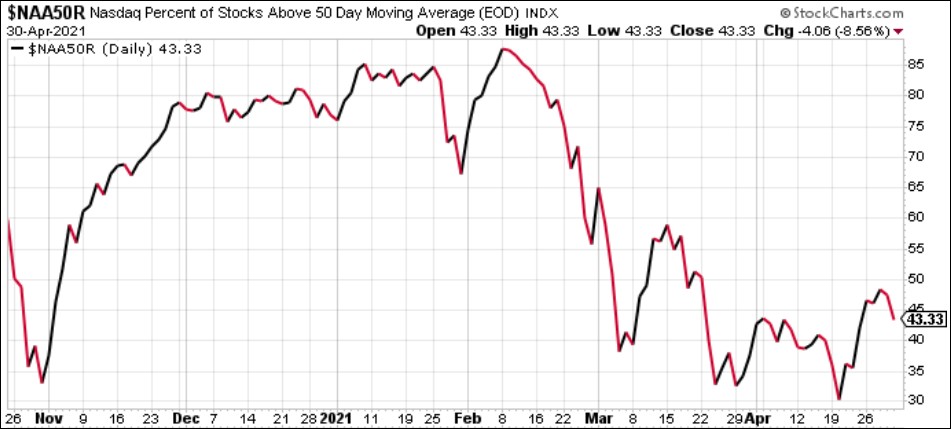
The paradox of market indexes making new highs while fewer and fewer stocks are trading above their 50-day moving average and 150-day moving average remains firmly in place when viewed on the NASDAQ Exchange.
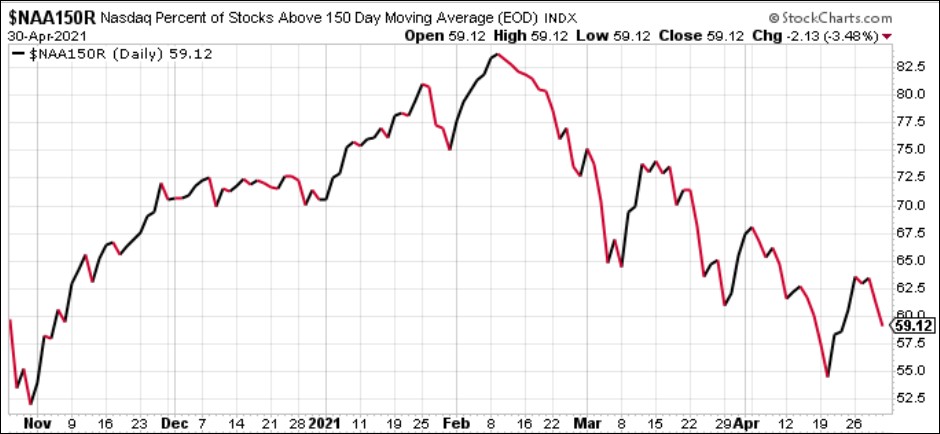
The percentage of stocks trading above their 150-day moving average on the NASDAQ has been in a steady downtrend for a solid two months.
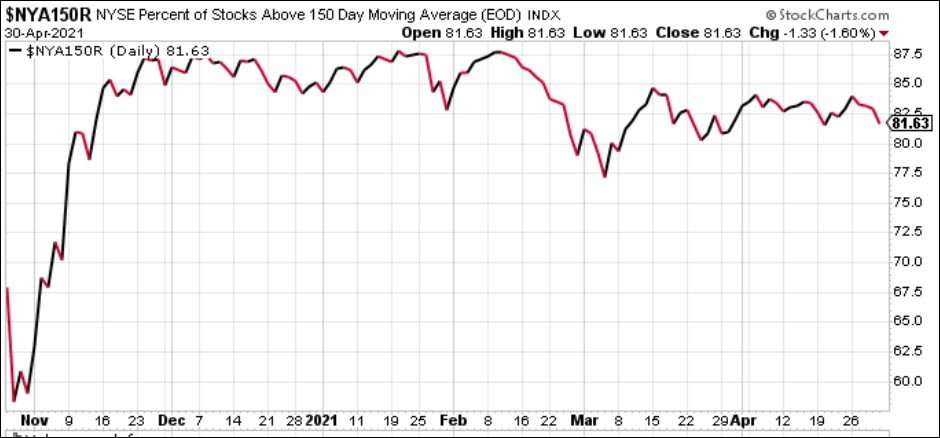
Meanwhile, the percentage of stocks trading above their 150-day moving average on the NYSE remains flat and within a range that has formed below the range that formed between last November and February. At 81.63% it remains at elevated levels. When we both ran money for William J. O’Neil the firm used to track the percentage of stocks above their 150-day moving average as a measure of market extension on the upside, with levels above 65% considered to be bearish. Whether that will hold true today remains unknown given the bizarre crosswinds and massive QE and fiscal stimulus that continues to come into the system.
The Market Direction Model (MDM) remains on a BUY signal.
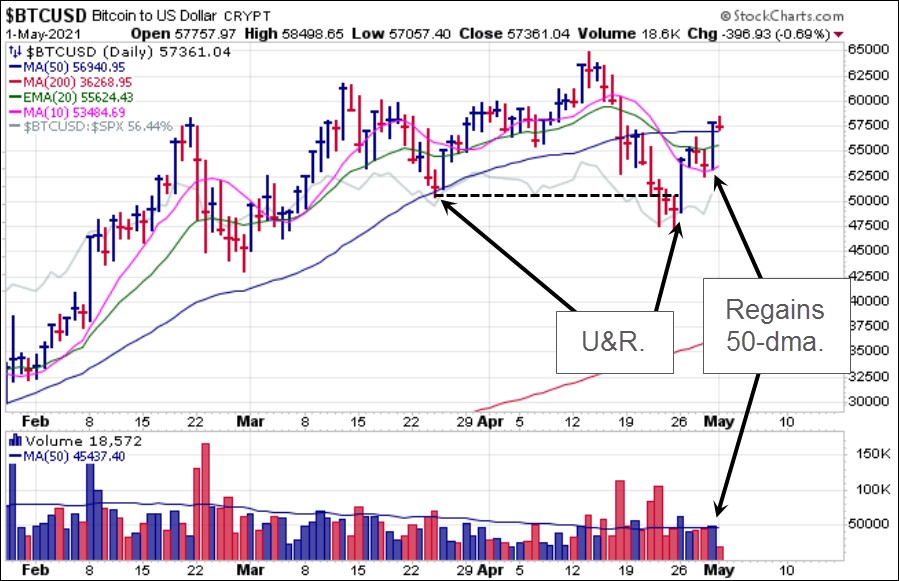
Bitcoin is currently flirting with is 50-day moving average but remains in a potential late-stage failed-base (LSFB) type of formation. It was able to successfully executed a U&R at the late March low last week and has made progress since then. The 50-day line represents an area of potential resistance where we could see Bitcoin retest the March low again or make an attempt at breaking out again, therefore the situation remains very fluid.
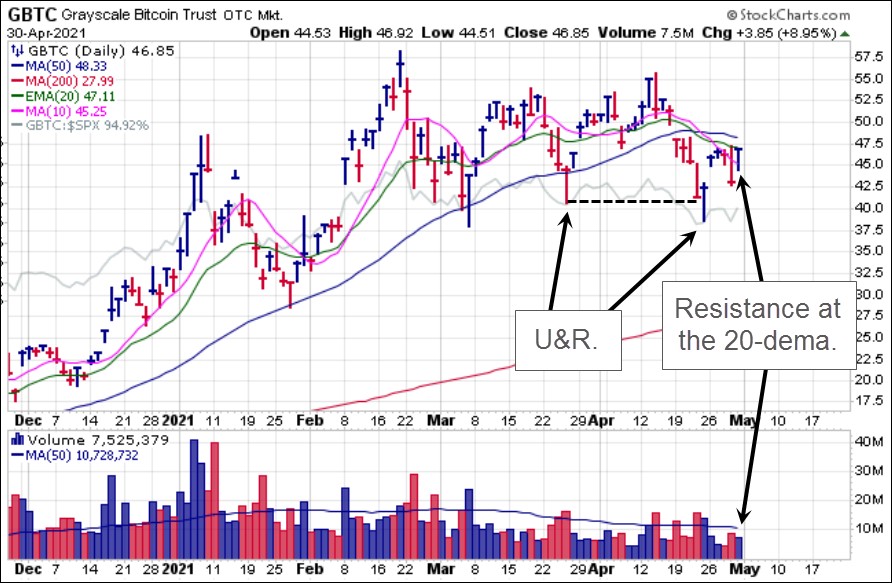
Meanwhile, the Grayscale Bitcoin Trust (GBTC) diverges as it remains well below its own 50-day moving average, but has been able to make progress after posting a U&R through its own March low last week. This is the first time it has violated its 50-day line since we first issued a buy signal on it last October.
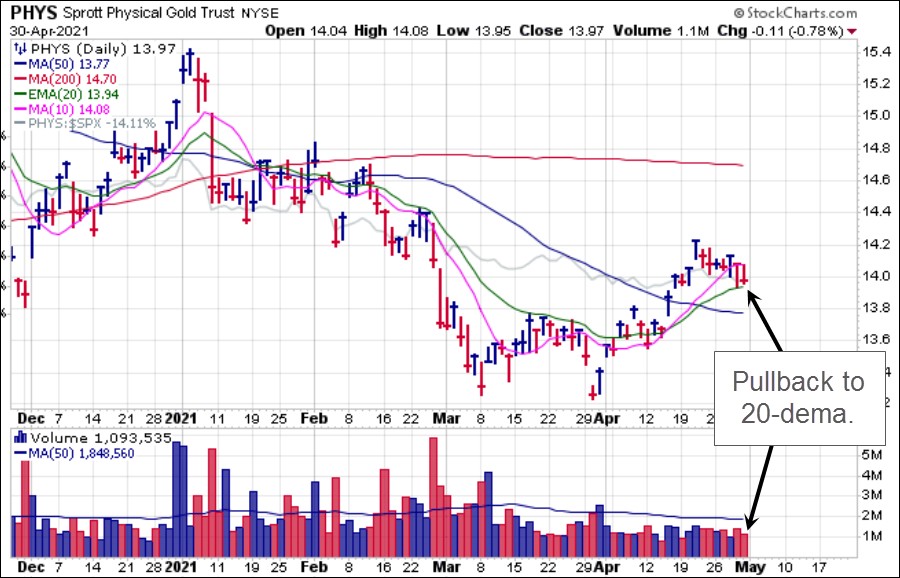
Precious metals have been rallying for the past month in an inverse correlation to the U.S. Dollar which has declined over the same time period. On Friday, the dollar rallied sharply, putting some pressure on the metals, but they remain above near-term support for now following U&R long entry signals at the prior lows four weeks ago. The Sprott Physical Gold Trust (PHYS) has pulled into its 20-dema over the past two days and has held support there with volume drying up. That may be viewed as an add point using the line as a selling guide for portions of one’s position purchased at that level. Otherwise, the 50-day moving average serves as a potentially more solid area of support of the pullback persists.
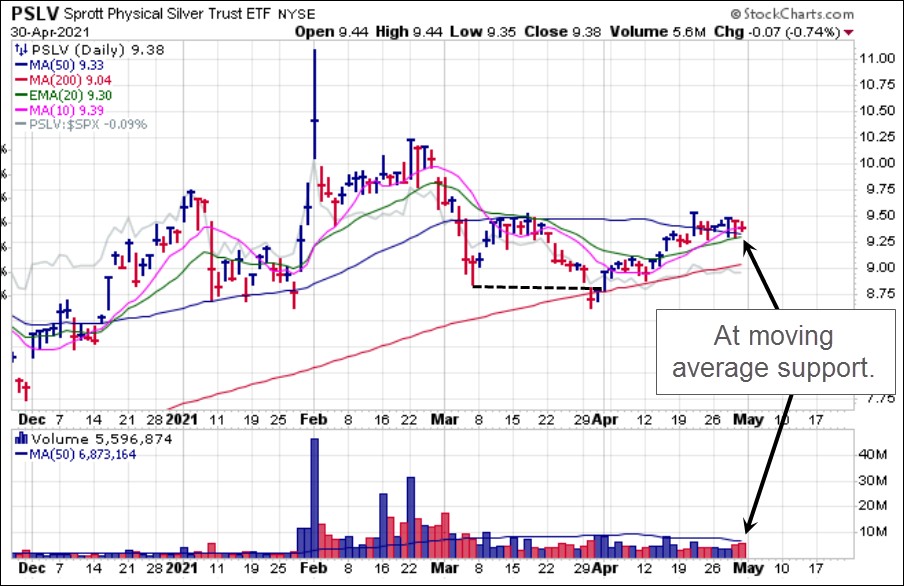
The Sprott Physical Silver Trust (PSLV) is tracking sideways along its 50-day moving average after posting a pocket pivot at the line either trading days ago on the chart. Note that on Thursday and Friday it actually tested the slightly lower 20-dema where it held support. While it is in a lower-risk add point we would use the 20-dema as a maximum selling guide.
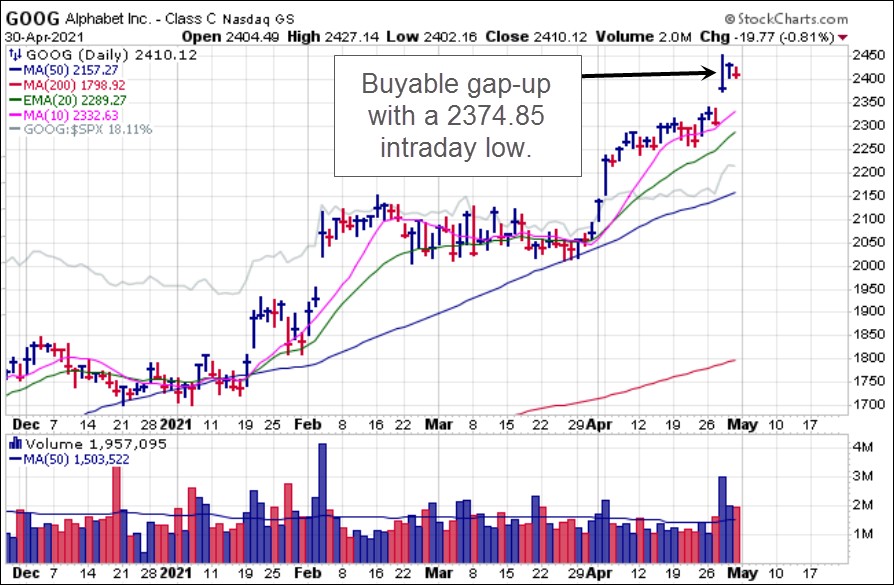
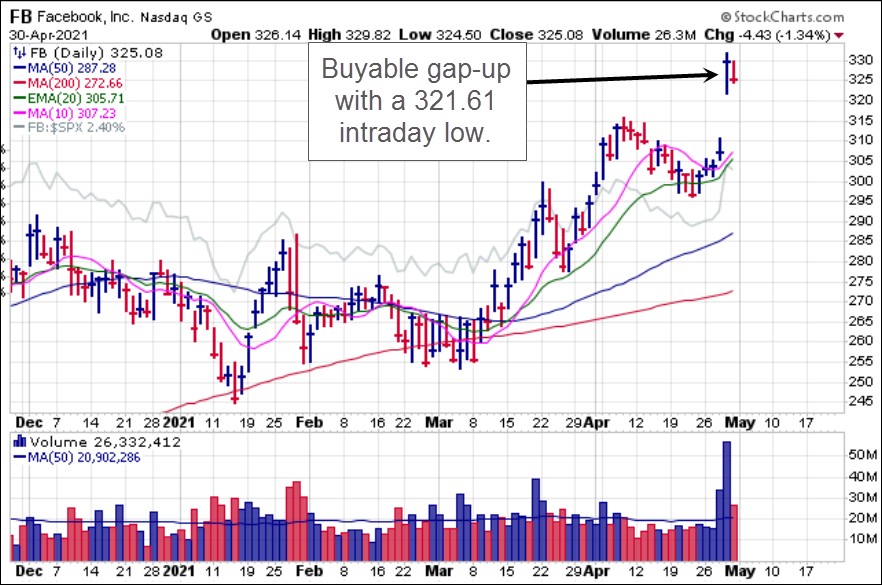
Big-stock NASDAQ names reported earnings this past week, with decidedly mixed results, While names like Apple (AAPL), Microsoft (MSFT), Netflix (NFLX) and Tesla (TSLA) have sold off on earnings, Facebook (FB) and Alphabet (GOOG) both gapped up. FB posted a buyable gap-up (BGU) move on Thursday after earnings where the 321.61 intraday low would serve as a selling guide, but the stock closed barely 1% above that low on Friday as the move so far lacks any real upside thrust.
Alphabet (GOOG) posted a less impressive BGU after earnings as it closed near the intraday lows on Wednesday's gap-up move. Technically, however, this remains actionable as a BGU using the 2374.85 BGU intraday low as a selling guide. These moves in FB and GOOG may be telling if the BGUs start to fail.