
Major market indexes continue to edge higher as the 200-day moving average looms ever closer. Sentiment and the media narrative continue to build on the bullish side, with recent headlines proclaiming that the NASDAQ Composite has now exited a bear market and begun a new bull market based on a 20% rally off the June lows. In addition, the S&P 500 is being lauded for exceeding a 50% retracement off the June lows, something that, according to one analyst, it has never done in a bear market rally since 1950.
In our view this is a meaningless statistic since during the Summer 2000 bear market rally following the DotCom bubble market top in March 2000, the NASDAQ well exceeded a 50% retracement before collapsing to lower lows in the fall. To cite such statistics in an S&P-centric manner while ignoring the NASDAQ Composite's history of bear market retracements strikes us as a severe and ignorant case of guilt by omission.
As we've noted, bear market rallies are legion for getting the masses bulled up, and we have previously discussed that we would not be surprised by a bear market rally that carries the indexes into or just beyond their 200-day/40-week moving averages as was the case in the bear market rallies of Summer of 2000 and Spring/Summer of 2008. The question yet to be answered is whether this rally will end in late August/early September in the sharp and brutal manner that those 2000 and 2008 bear market rallies did.
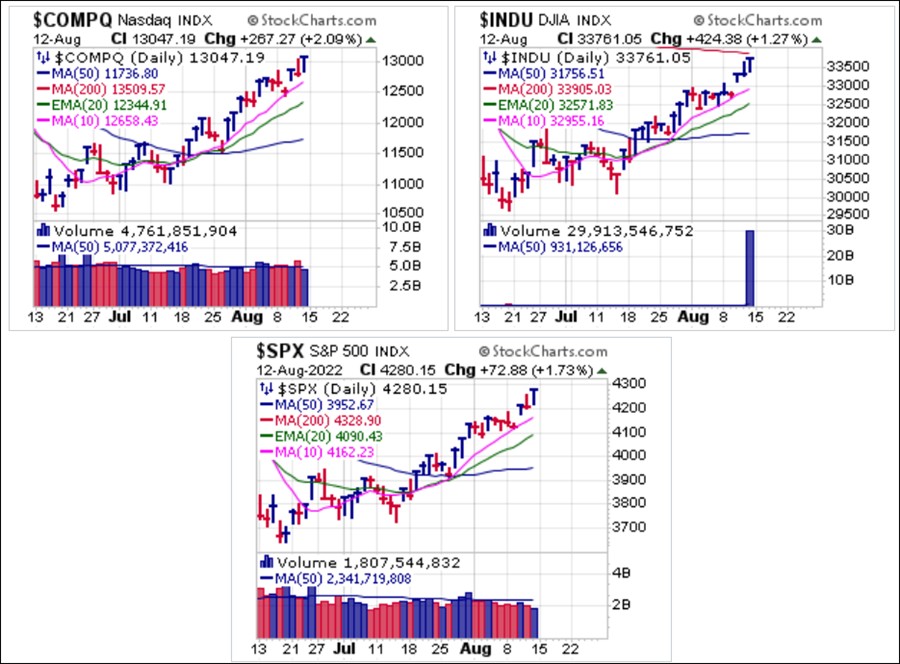
In the chart of the NASDAQ Composite ($COMPQ), Dow Jones Industrial ($INDU), and S&P 500 ($SPX) Indexes below the 200-day moving average is just barely showing up on the Dow chart. Thus, the indexes may have more room to rise as we head into the end of summer. The NASDAQ's 200-day line is at 13509.57 vs. a close this past week of 13047.19 while the S&P's 200-day lies at 4328.89 vs. a Friday close of 4280.15.
The idea of a Fed pivot, whereby the Fed will achieve an ignominious crash-landing of such severity that they will soon be forced to reverse course and begin aggressively back-tracking on rates and balance-sheet tapering. This is occurring while record inflation is in force, even much higher than the comparisons that are made between 8-9% inflation today and 8-9% inflation in 1980 when then Fed Chairman Paul Volcker raised interest rates beyond 20%.
It is critical to understand that if inflation today were measured the same way it was measured in 1980, then we have seen peak inflation in 2022 of 17.3% even as the Fed Funds Rate climbs to 2.25-2.50%. This underscores the bizarre and unique underlying conditions currently faced by the market, and which can create unintended consequences that, in their worst case, become Black Swans.
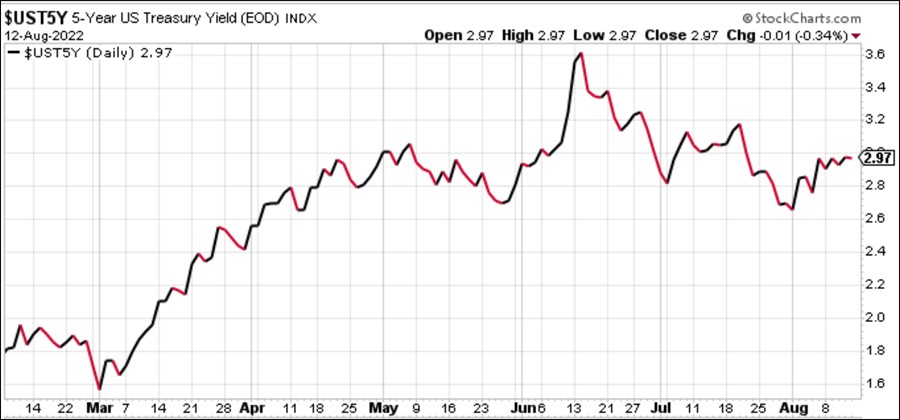
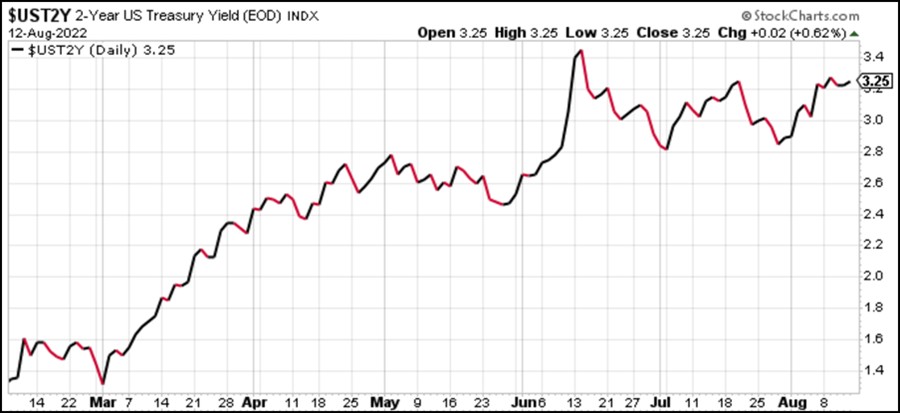
Meanwhile, the Five-Year Treasury Yield sits at a higher 2.97%.
While the Two-Year Treasury Yield is approaching much closer to its June highs than the 10-year or the 5-year, finishing this past week at 3.25%.
 Semiconductors have been rallying sharply off the lows as the VanEck Vectors Semiconductor ETF (SMH) posted its 5th straight up week since the June lows. Viewed within the context of a weekly chart and the prior downside move, the current rally looks like a typical bear market rally for the semiconductor sector. In fact, nearly all semiconductors names, with the exception of names like Intel (INTC) closely resemble the SMH chart. Note the lower volume over the past six weeks relative to the selling volume seen on the way down.
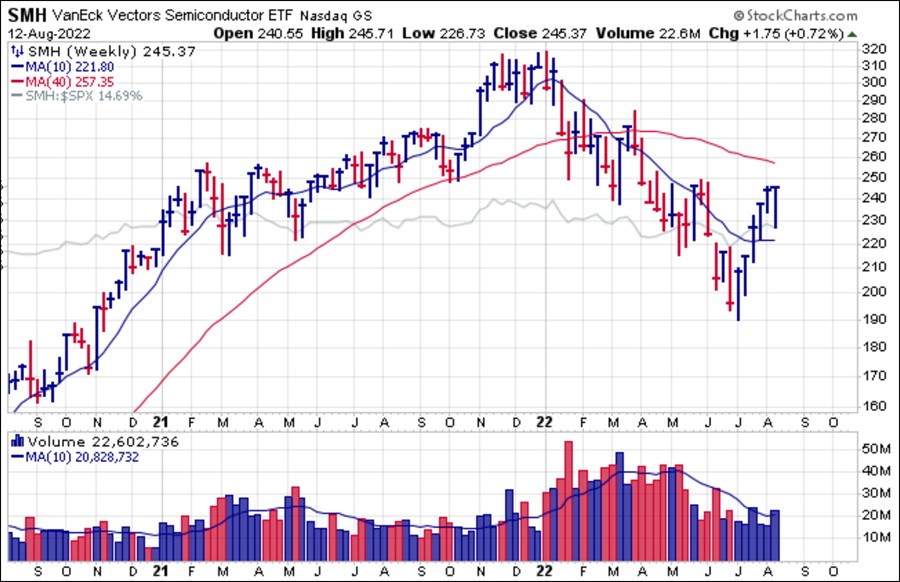 Most higher-PE tech and growth names, even infinite-PE names, have participated in the melt-up off the June lows. Apple (AAPL) carries a valuation that is perhaps less extreme, so it finds favor in a low-volume melt-up rally that is approaching the prior market top highs.
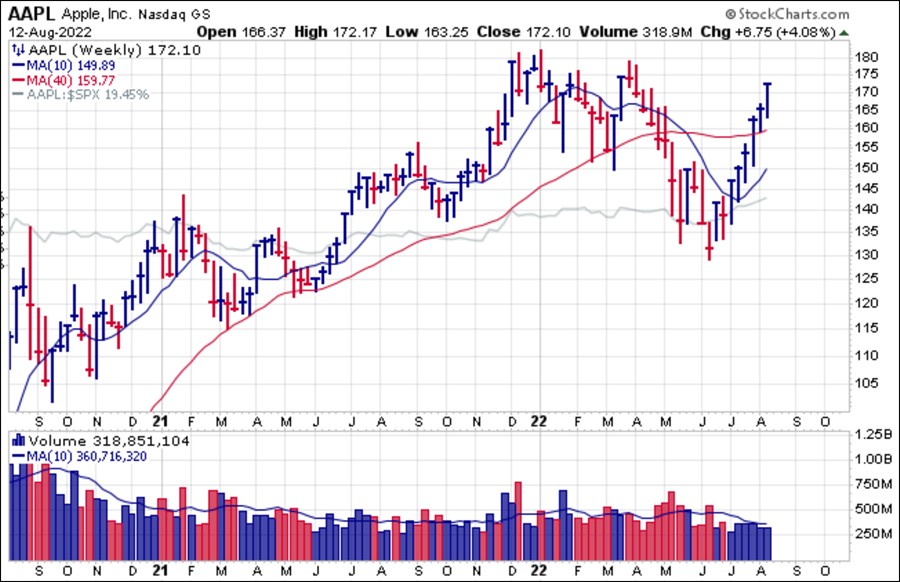 Solar and other clean energy names have benefitted recently when sudden upside in the space was sparked by renegade Democrat Senator Joe Manchin who did an about-face three weeks ago and declared that he would support the latest "Inflation Reduction Act" legislation which provides for $369 billion in pork-barrel spending target at the clean energy industry. Solars have rallied sharply off otherwise moribund patterns as the Invesco Solar ETF (TAN) illustrates.
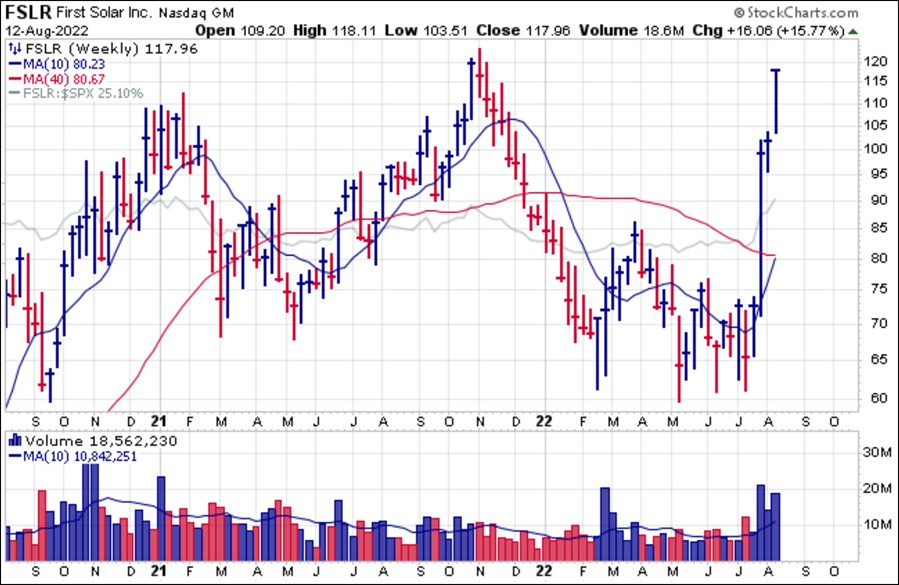
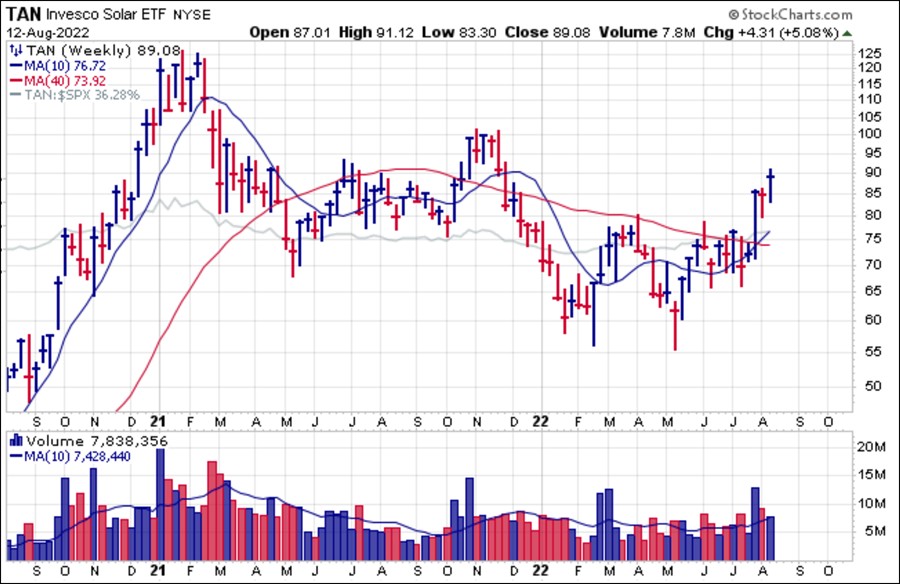 Most of the moves in solar names have been confined to the lower reaches of their current chart patterns, but First Solar (FSLR) has gone nuts on the upside in a four-week rally that has carried the stock all the way back to its all-time highs seen before the market top in late 2021 and early 2022. This has the look of a classic punchbowl formation where the stock was more than cut in half in 16 weeks to the downside off the late October peak and has now made up nearly all of those losses in just four weeks. One could argue that FSLR has become a new meme stock of sorts.
Our view is that this move is likely to prove unsustainable as it potentially and eventually evolves into a possible Punchbowl of Death formation. However, we will wait for the first pullback and consolidation to occur before drawing any firm conclusions. A Punchbowl of Death (POD) short-sale set-up must first see the stock fail at its 10-dma and 20-dema, which has not occurred yet. It could also top and trigger a short-sale entry on any double-top failure at the November 1, 2021 left-side peak at 123.13. If this does play out as a possible POD short-sale set-up, we will issue a Short-Sale Set-Up (SSS) report as appropriate.
 The Market Direction Model (MDM) remains on a SELL signal.