
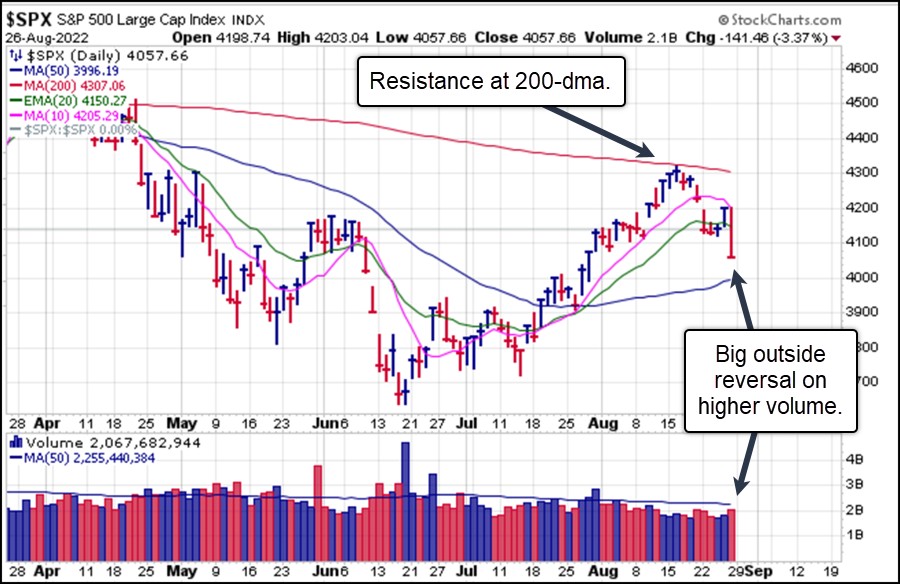
We have indicated repeatedly that we believe the rally off the June lows in the major market indexes has been a bear market rally based on our assessment of the underlying condition of individual stocks as they engaged in deeply oversold rallies off their June and July lows. On Friday, Fed Chair Jerome Powell confirmed the Fed's hawkish stance in a manner that was firmer than previous speeches. That initially sent the Dow down over 200 points before it briefly rallied and then failed back to the downside about 45 minutes after the opening bell. By the close the indexes had split wide open with the Dow down -1,008.38 (-3.03%), the S&P -141.46 (-3.37%) and the NASDAQ Composite down -497.55 (-3.94%).
The S&P 500's action has been similar to the bear market rallies of Summer 2000 and Summer 2008 which reached their 200-day/40-week moving averages before eventually breaking to lower lows in the months of September and October of those years. The timing of the current breakdown from the 200-day line in the S&P is intriguing as we approach the first day of September at the end of the coming trading week.
In any new bear market leg you will find short-sale set-ups and patterns that post new down legs of their own, or, if they are bullish formations, potential later-stage failure patterns like double-tops, Punchbowls of Death, or late-stage failed-bases (LSFB). We have watched the rally in energy drink producer Celsius Holdings (CELH) as it forms a 63% deep punchbowl-with-handle formation and attempts to break out from a one-week handle. One way to play this is as a double-top short-sale (DTSS) set-up using the left-side peak of the punchbowl at 110.22 as an entry trigger using that price level as a covering guide with 1-3% porosity added depending on one's risk preferences.
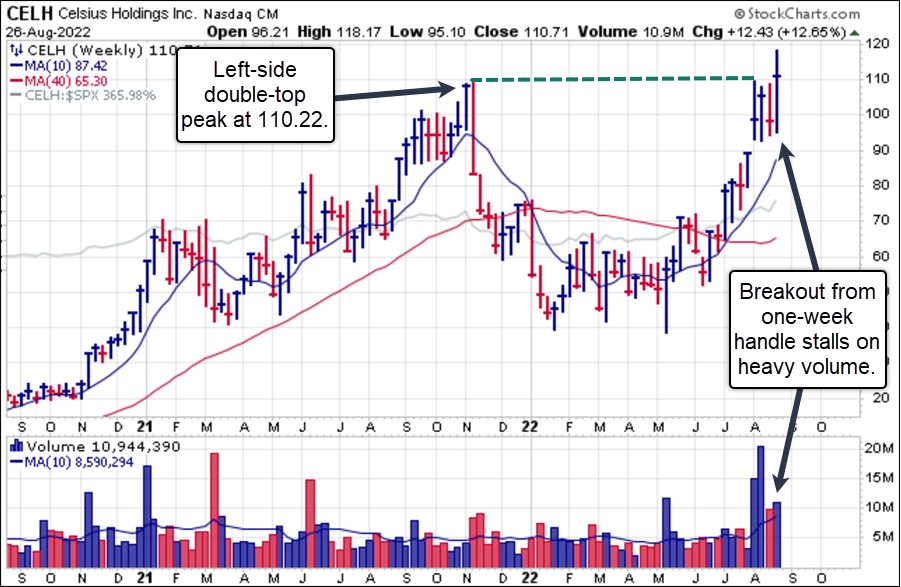 On the daily chart, we can also see how Celsius Holdings (CELH) would need to play out in order to becomes bona fide Punchbowl of Death. For now it is a punchbowl, only, and a doozy at 63% deep, until it busts the 20-dema. Below is the situation on the daily chart where we see CELH holding a recent three-week flag breakout. Support lies along the highs of the handle price range with the 10-day line serving as nearby moving average support. In sequence, a break below the 110.22 left-side peak of the punchbowl would trigger a DTSS short-sale entry, a subsequent break below the 10-dma would then trigger an aggressive short-sale entry at that moving average with the idea of seeing a break below the 20-dema occur soon thereafter. A break below the 20-dema would trigger another short-sale entry and serve as initial confirmation that CELH's punchbowl formation has developed into a Punchbowl of Death (POD) formation.
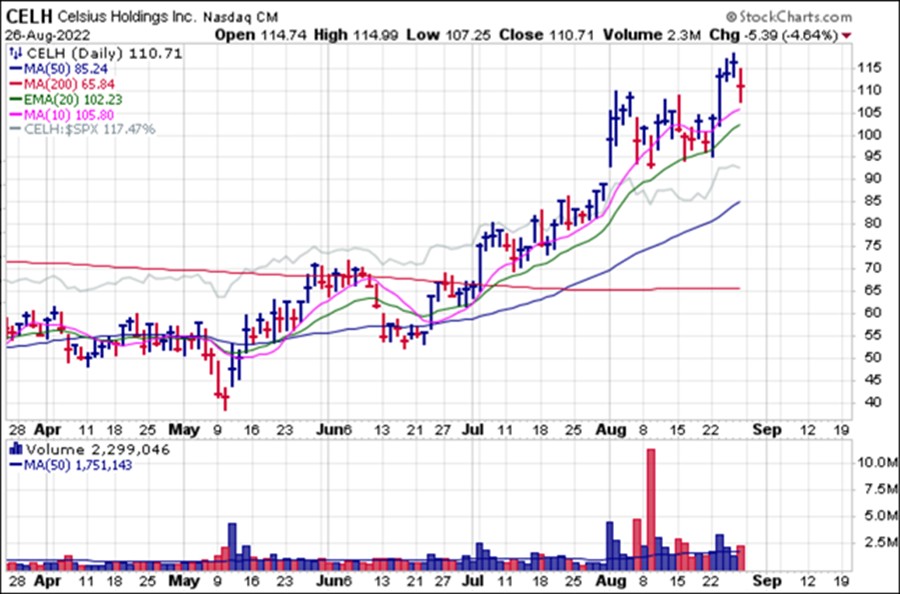
The Market Direction Model (MDM) remains on a SELL signal.
In the upcoming webinar and Market Lab Report, we will discuss the perils of supply-driven inflation and why consumers cannot withstand higher interest rates together with inflationary pressures. Inevitably, corporate earnings will be impacted and unemployment will start to soar in the coming months. Long term historical charts going back to the 1950s will be provided.