
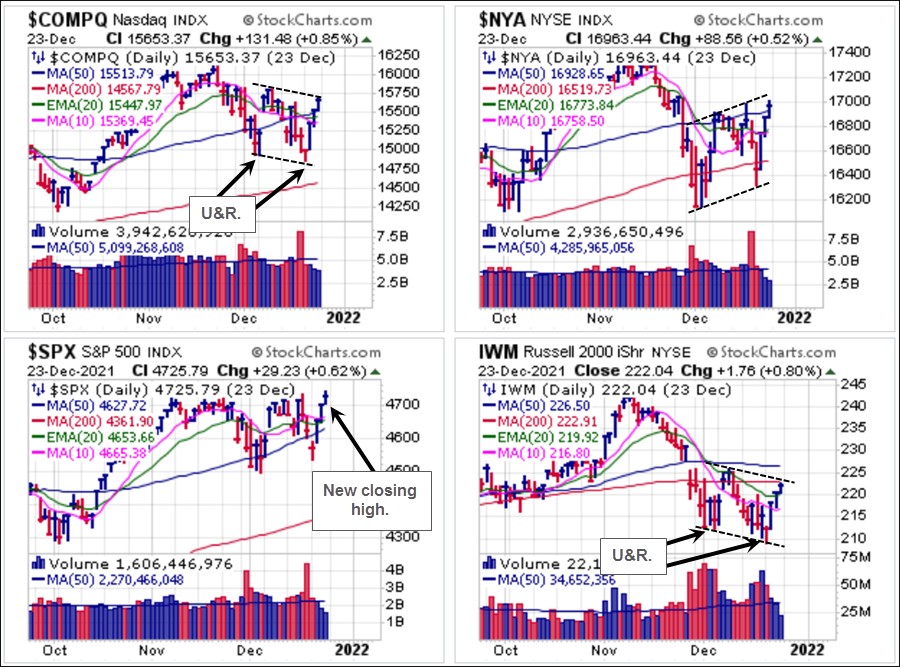
Major market indexes have rallied sharply over the past three days in a sort of Dead Santa Bounce. We use the term "bounce" for the simple reason that most individual stocks are merely bouncing in V-shaped moves off of Monday's oversold lows, despite the all-time closing high posted by the S&P 500 Index ($SPX) on Thursday. Many leaders, former leaders and perma-laggards have been under sharp selling pressure for the past month, so that by Monday's gap-down open things had become quite oversold on an individual stock basis. This led to an undercut & rally (U&R) move in the NASDAQ Composite Index. The small-cap Russell 2000 Index (IWM) also posted a U&R on the same day. Overall major market indexes are heading back towards prior price-high resistance with the S&P 500 making a bid to decisively clear the 4700 level.
 The Market Direction Model (MDM) remains on a SELL signal.
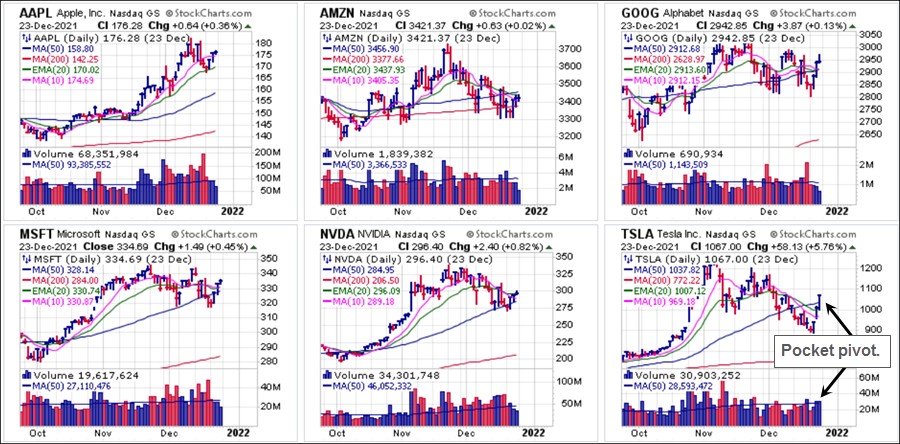
The NASDAQ Six, as we like to refer to the six big-stock NASDAQ names that garner a 49% weighting in the NASDAQ 100 Index, have all melted back to the upside over the past three trading days. The only one of the six showing anything in terms of an actionable long entry signal is Tesla (TSLA) which posted a pocket pivot at its 50-day moving average on Thursday.
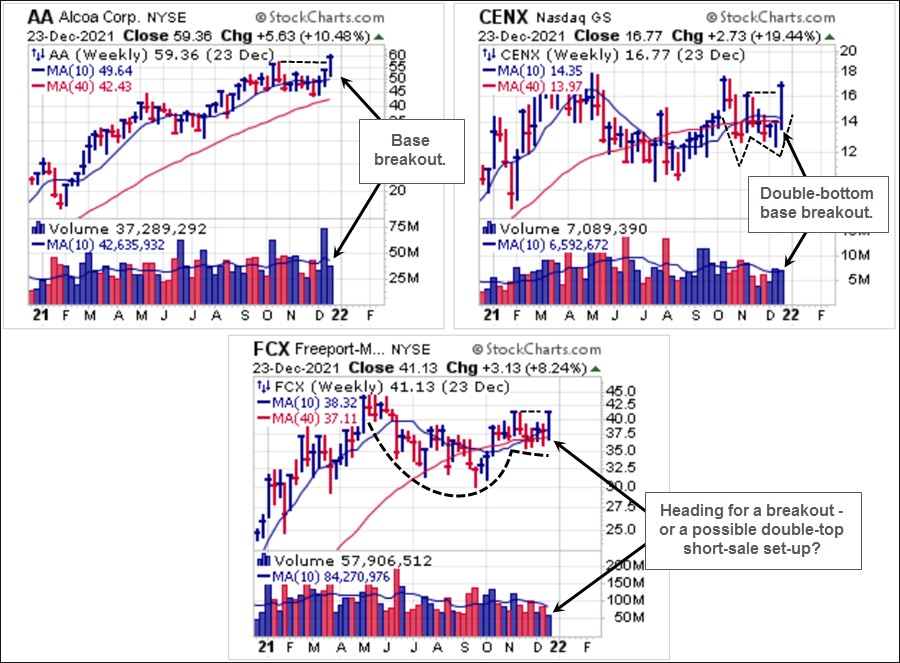
More orthodox strength is being seen in certain industrial metals names such as aluminums and coppers, which are shown on weekly charts below. Aluminum producers Alcoa (AA) and Century Aluminum (CENX) both broke out this past week. AA did so coming straight up off the lows of a nine-week base while CENX broke out through the mid-point of a double-bottom base. Copper producer Freeport McMoran (FCX) is approaching the highs of a handle type of consolidation it has formed over the past six weeks. It remains to be seen whether FCX will cleanly breakout of this formation or whether it will serve as double-top resistance and a therefore a potential double-top short-sale set-up. Breakouts in this market have tended to fail, and for this reason the double-top formation has been Gil's favorite short-sale pattern to target and stalk, as discussed in our live market webinars. Whether this pattern can be broken and these three stocks make substantial upside progress from here is something to watch for.
 Fertilizer names have also been strong and we show them on weekly charts below. CF Industries (CF) broke out of a flag-on-flag type of formation this past week but note how the breakout from the first flag formation back in October eventually failed. Intrepid Potash (IPI), the thinnest of the "fertz," is holding tight just below its 50-day moving average and right on top of a prior seven-week base from which it broke out in early October. Mosaic (MOS) is attempting to "re-breakout" from a prior cup base from which it broke out back in late September but failed. Nutrien (NTR) posted a base breakout from a nine-week base this past week. Note the prior reversal off the highs on a breakout attempt after earnings eight weeks ago.
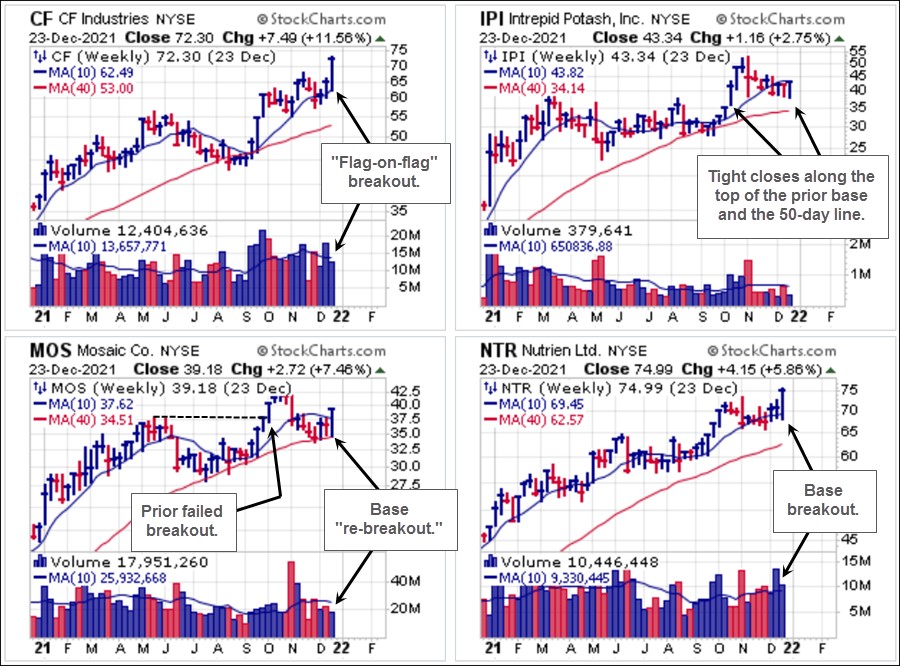 Early in the week we reported on gold miners Agnico-Eagle Mines (AEM) and Kirkland Lakes Gold (KL) after they posted bottom-fishing pocket pivots at their 20-day exponential moving averages. These have held up well but we would note on the weekly charts below that both stocks are moving up into potential resistance at their blue 10-week moving averages. These have remained buyable along the 20-dema on the daily charts (not shown) but we would look for confirmation to come in the form of a move above the 50-day lines if these are to produce more sustained uptrends from here. Both stocks are also working on U&R types of moves off their recent lows as well.
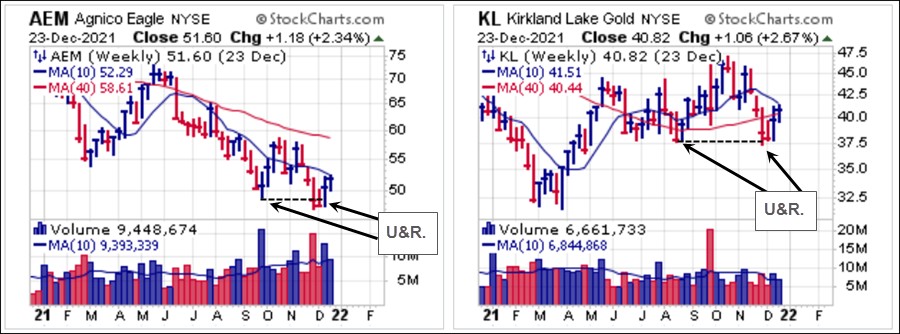 In the realm of alternative-currencies, for which we will use the weekly charts of Bitcoin ($BTCUSD), Ethereum ($ETHUSD), the Sprott Physical Gold Trust (PHYS) as a proxy for gold, and the Sprott Physical Silver Trust (PSLV) as a proxy for silver, there has been a strong correlation between crypto-currencies and precious metals since late September. $BTCUSD is holding support at the 40-week moving average on its weekly chart below, while $ETHUSD has closed tight along either side of its rising 10-week moving average for the past four weeks. A strong move back above the line would be a constructive development and like actionable on the long side using the 10-week or 50-day moving averages as selling guides. Both PHYS and PSLV posted weekly U&Rs off their recent lows two weeks ago.
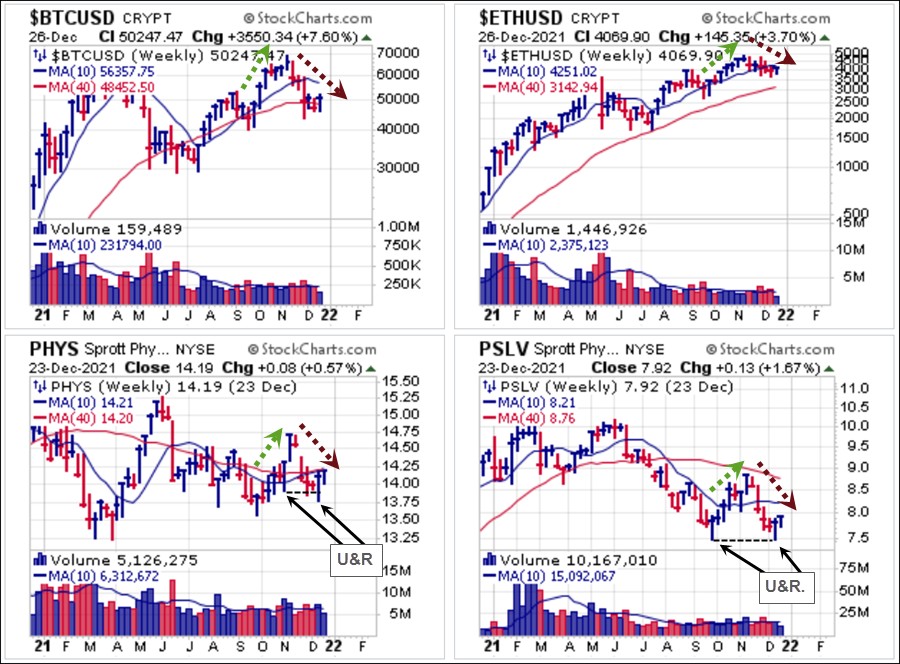 Despite the new closing highs in the S&P 500 Index, it remains at current resistance levels around the key 4700 level while other indexes lag somewhat. Individual stocks, meanwhile, are mostly bouncing off recent oversold lows, with little in the way of fresh actionable long set-ups aside from those shown above. In cases where these are base breakouts, it remains to be seen whether substantial upside progress will ensue, or whether these breakouts in metals and fertilizers will fail as prior breakouts in their patterns have. This remains a difficult environment and we see no reason to force matters. Long set-ups, in the few cases where they have occurred as noted above, can be tested but we would position-size cautiously while maintaining strict risk-management.