
Major market indexes put on a schizophrenic show this week as volatility and strange divergences were the order of the day. At the start of Fed Chairman Jerome Powell's press conference following the Fed policy announcement half an hour earlier, the market looked to be rallying. That rally lasted 15 minutes before the market turned tail and broke sharply to the downside as Powell's commented that rate cuts for March were not on the table.
The action was quite bearish, prompting a switch in the Market Direction Model from a BUY signal to a CASH/NEUTRAL signal that day. The following day, on Thursday, however, the market forgot all about its bearish ways and rallied as the NASDAQ Composite shook out along its 20-dema. On Friday the strong jobs number was ignored as the index plowed its way back up to the Monday high before falling just 1.63 points short of posting a higher high.
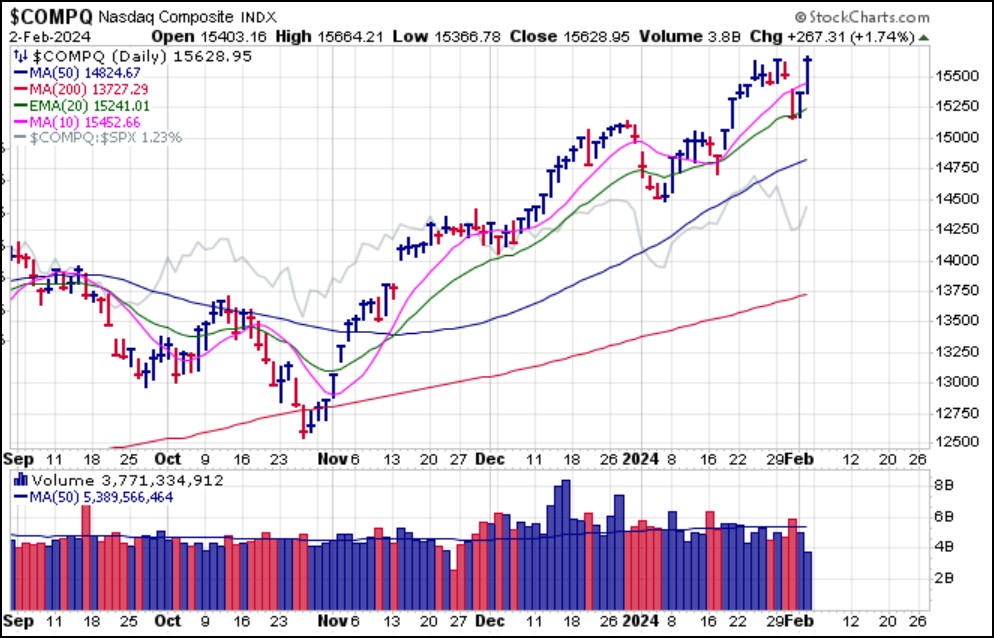 Certainly, the bulls were again invigorated ahead of Friday's Bureau of Labor Statistics jobs report which came in at a blistering 353,000 jobs vs. expectations of 175,000 on the Establishment Survey. However, the Household Survey showed a slight decline. The media of course fixates on the Establishment Survey, despite the fact that numbers are nearly always massaged and subject to sizable revisions as they were throughout 2023. According to some sources, Friday's 353,000 jobs blowout was the product of massive and broad revisions such that while 353,000 was the adjusted number, the unadjusted number showed a loss 2.635 millions jobs. Such are the manufactured vagaries of government economic data, and this may be what the market knew on Friday as it rallied in response.
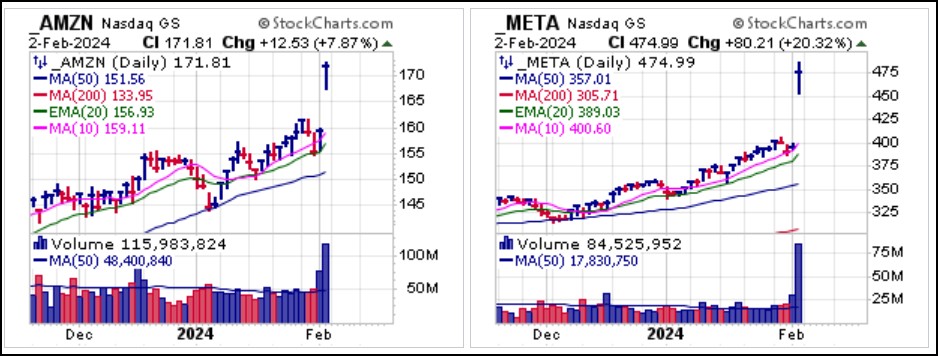
Some morning wobbling early in the day eventually saw the indexes find their feet to produce a furious rally in the NASDAQ Composite and NASDAQ 100 indexes as tech took the driver's seat. Breadth, however, was running at approximately 2-1 negative on the NYSE and 5-3 negative on the NASDAQ the whole way in a strange divergence as money piled into a narrow group of mega-cap tech names. That action was likely prompted by strong earnings reports from Amazon.com (AMZN) and Meta Platforms (META) the night before. Both stocks gapped higher in buyable gap-up (BGU) moves where the intraday lows would have served as selling guides.
 Arista Networks (ANET) has been a strong performer since we first reported on it as a pocket pivot long entry back in early December and again in early January. On Friday it posted a buyable gap-up (BGU) type of move using the intraday low at 269.12 as a selling guide. ANET closed at 273.10 which technically keeps it within buying range but keep in mind that earnings are expected on February 12th, a week from this coming Monday.
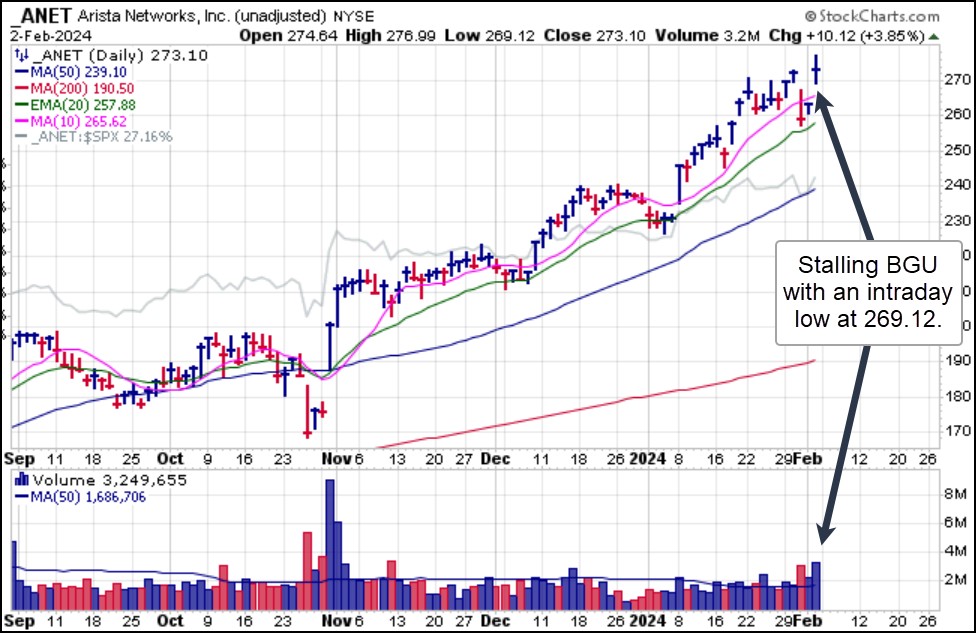 Friday certainly had an odd feel to it with some unusual Ugly Duckling OWL set-ups coming into play with big-stock NASDAQ names Apple (AAPL) and Alphabet (GOOGL) which posted big-volume moving average undercut & rally (MAU&R) moves and long entry triggers at the 200-dma and 50-dma, respectively. Both stocks remain within buying range using the respective moving averages as tight selling guides.
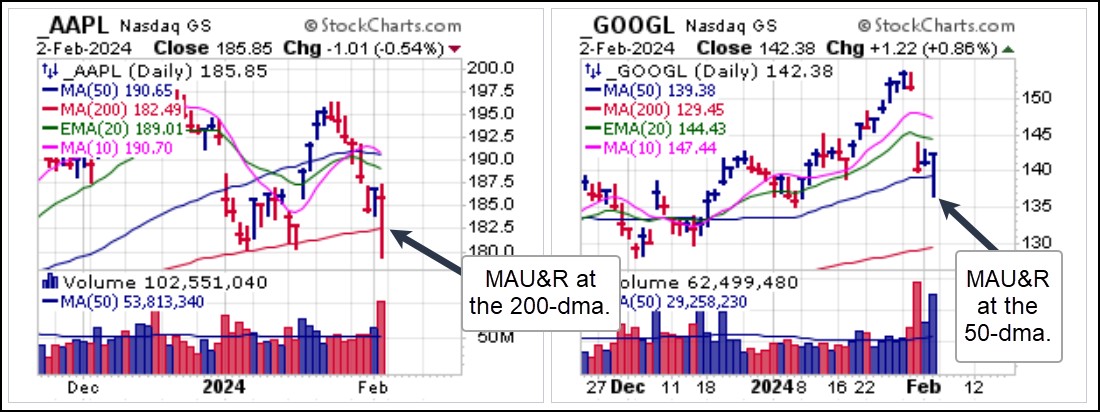 While AI Meme stocks and other techs get all the headlines, one of the best-performing stocks over the past three weeks has been DraftKings (DKNG) which Gil discussed in detail in a VoSI VooDoo Report piece dated January 14, 2024. This is what he wrote at that time:
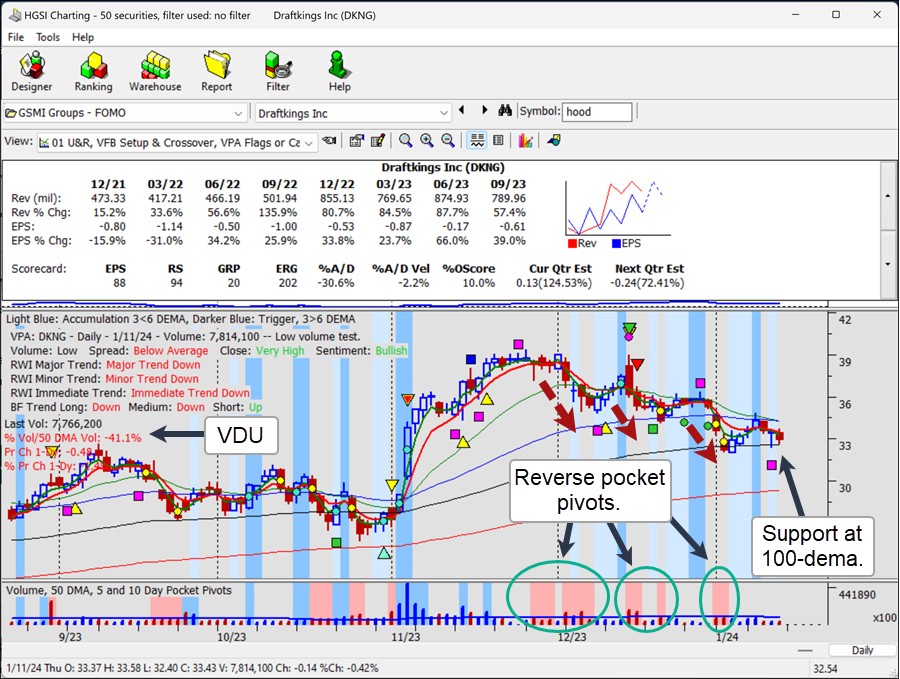
"Lately I have noticed some interesting action in online gambling concern DraftKings (DKNG). We can observe the high-velocity rally it posted in the first half of November after it reported earnings on November 2nd. That rally flattened out in the latter part of November before the stock began rolling back to the downside in a three-waves-down tumble over the past month that has finally reached the left-side peak of the prior base structure and the 100-day exponential moving average (black). Volume dried up on Friday to -41.1% to define a VDU pullback to the 100-dema that could be bought using the 100-dema at 32.58 as a selling guide following Friday's 32.95 close.
This all comes after three waves of selling that are defined by three distinct groupings of reverse or downside pocket pivots. The first two groupings show heavy, above-average selling volume while the third shows volume drying up. On the first two of these reverse pocket pivots DKNG was testing the prior low, a test for supply that failed each time. On the third test, which is occurring now, volume is drying up. Meanwhile, a bullish VPA signal (magenta box) pops up on Thursday. This argues for a potential reversal off the 100-dema as sellers are finally washed out, at least near-term.
On a more orthodox chart the action looks far, far less appetizing. However, it is possible to see the three-waves-down sell-off in DKNG off the late November peak and the current low-volume drift into the left-side peak of the prior base structure. To an orthodox chart reader this looks like a short-sale target where entries on the short side were available at the 20-dema this past Tuesday and again at the 10-dma on Friday. I would argue, however, that it was certainly a nicely profitable short on the early short-sale entry signals near the November highs, but now this is too obvious.
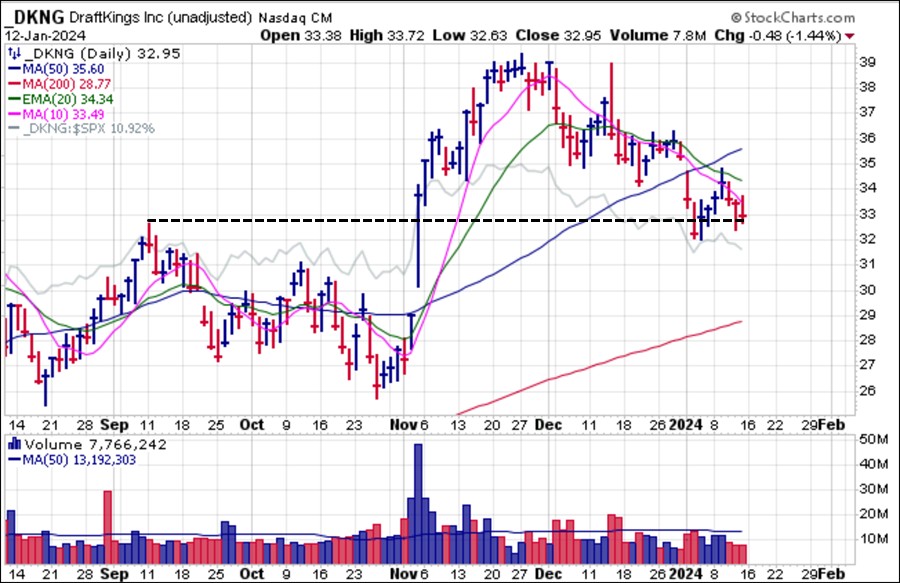
So while the orthodox daily bar chart shows a stock that looks like it is, for all intents and purposes, headed lower, the unorthodox VPA Chart View on top of it shows some bullish characteristics. Now we can watch this play out in real-time from here and discern whether the VPA Chart View offers an edge in this example in a process that I have been working through for some time as I use both types of charts to come up with similar or divergent conclusions and then see which ones tend to prevail in real-time. So, have a good time with this one, and maybe even think about going long DKNG while using the 100-dema as a tight selling guide within the context of any market upside this coming week."
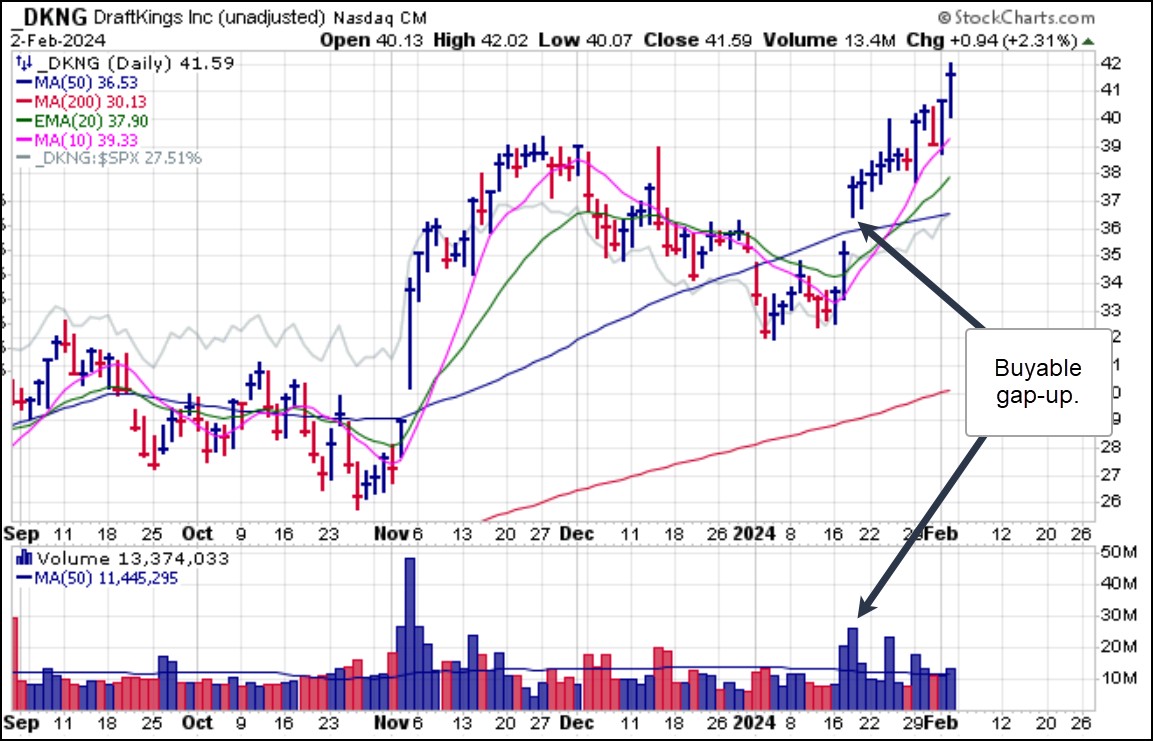
This is what DraftKings (DKNG) looks like today on the daily chart. The sharp move off the mid-January lows has streaked to higher highs and was punctuated along the way with a buyable gap-up (BGU) move through the 50-dma three days after the original VooDoo Report covering DKNG was emailed to members subscribing to it. Gil does not post VooDoo Reports often, but generally when something this offbeat but yet this actionable appears, it more than pays for itself.
 Despite the strong jobs number, at least on the surface, which sent interest rates and the dollar higher, Bitcoin ($BTCUSD) held its ground along 20-dema support. It continues to act constructively after posting an undercut & rally (U&R) long entry along multiple prior lows a week ago. Over the past week it has been buyable along 20-dema support where it shook out constructively on Thursday and then held again on Friday before closing back above the 50-dma.
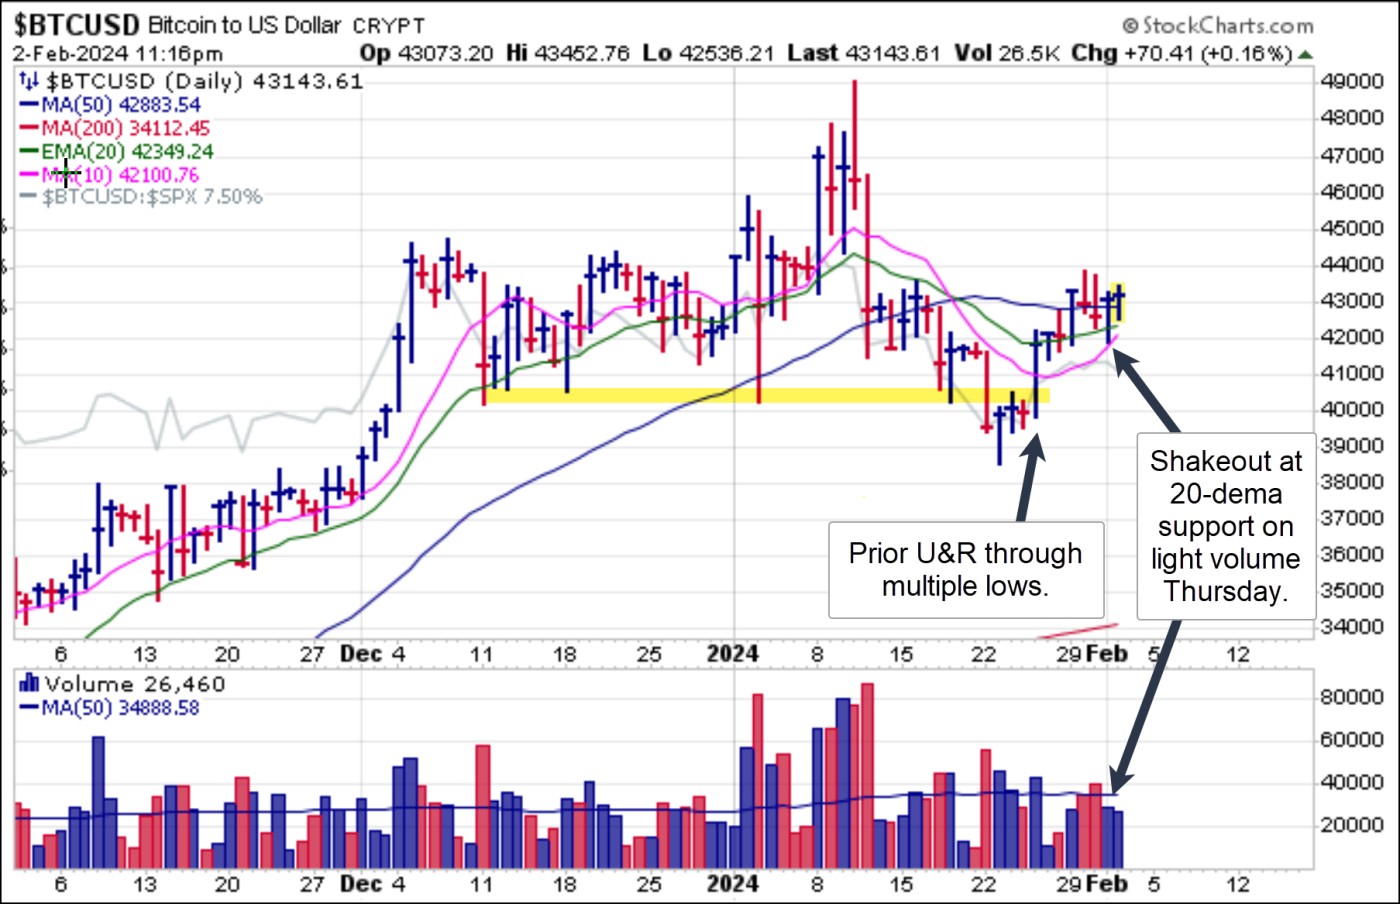
The Market Direction Model (MDM) switched to a CASH/NEUTRAL signal on Wednesday, January 31, 2024.