
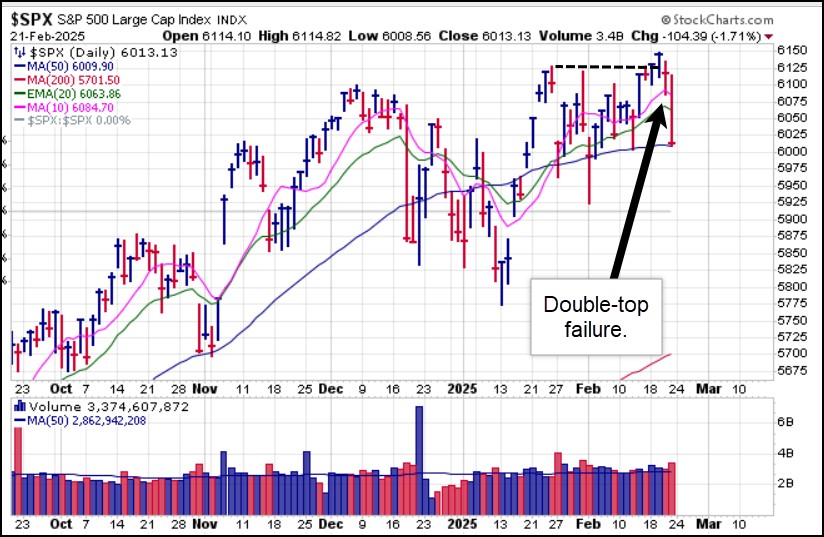
Major market indexes ended the week with a sharp sell-off. As we have said, we do not view this as a favorable environment for trend-following, position-building investors. It has been, at least up until now, a trader's market. On Thursday we saw the first clues of a potential market pullback as the S&P 500 Index posted a double-top short-sale entry trigger along the prior 6128.18 high of January 24th. It then broke hard to the downside as it tested 50-dma support and held.
 The NASDAQ Composite Index was the weakest on Friday among the larger-cap indexes as it slashed through 50-dma support on higher selling volume. The breakdown in the indexes marked a broad sell-off in stocks, many of which were already wavering or acting poorly well in advance.
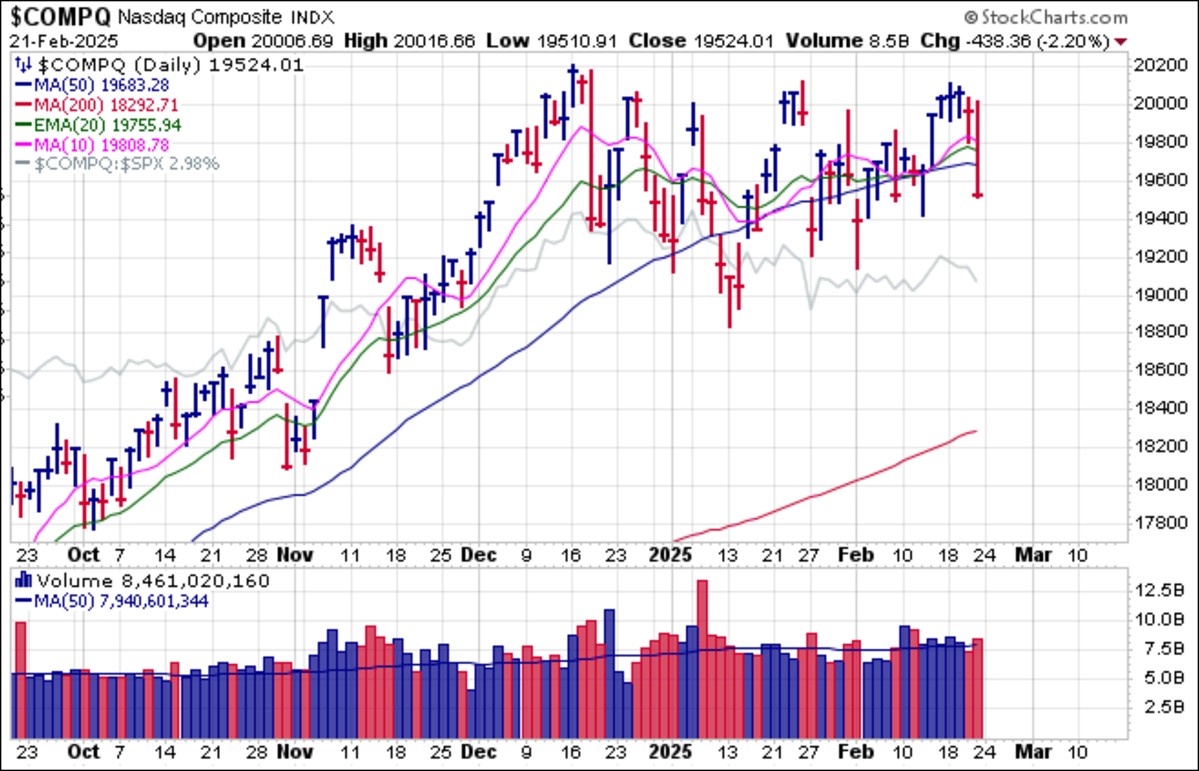 The small-cap Russell 2000 Index as represented by the iShares Russell 2000 ETF (IWM) was smashed on Friday, down 2.88% as it
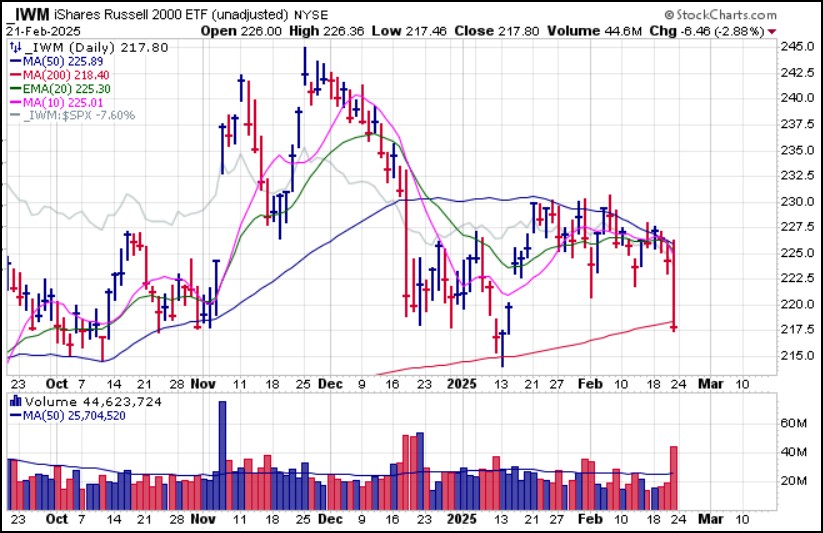 Key sectors were slammed on Friday.
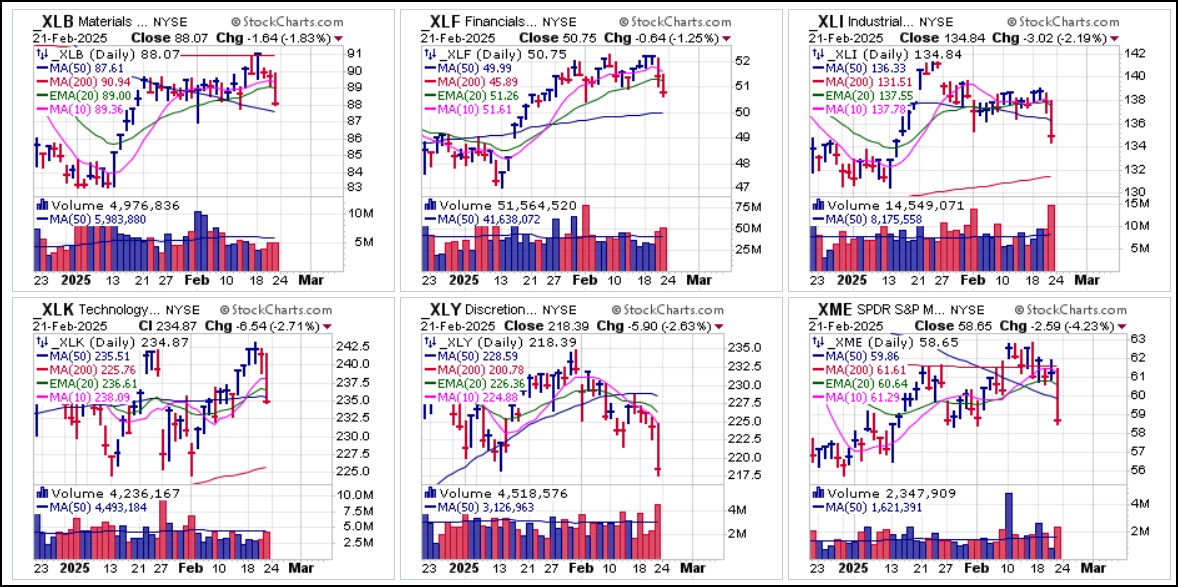 In particular, technology was hit hard on Friday as the SPDR Select Sector Technology (XLK) ETF broke hard and closed beneath 50-dma support. Note the prior double-top short-sale (DTSS) entry triggers at the 242.58 high of January 24th.
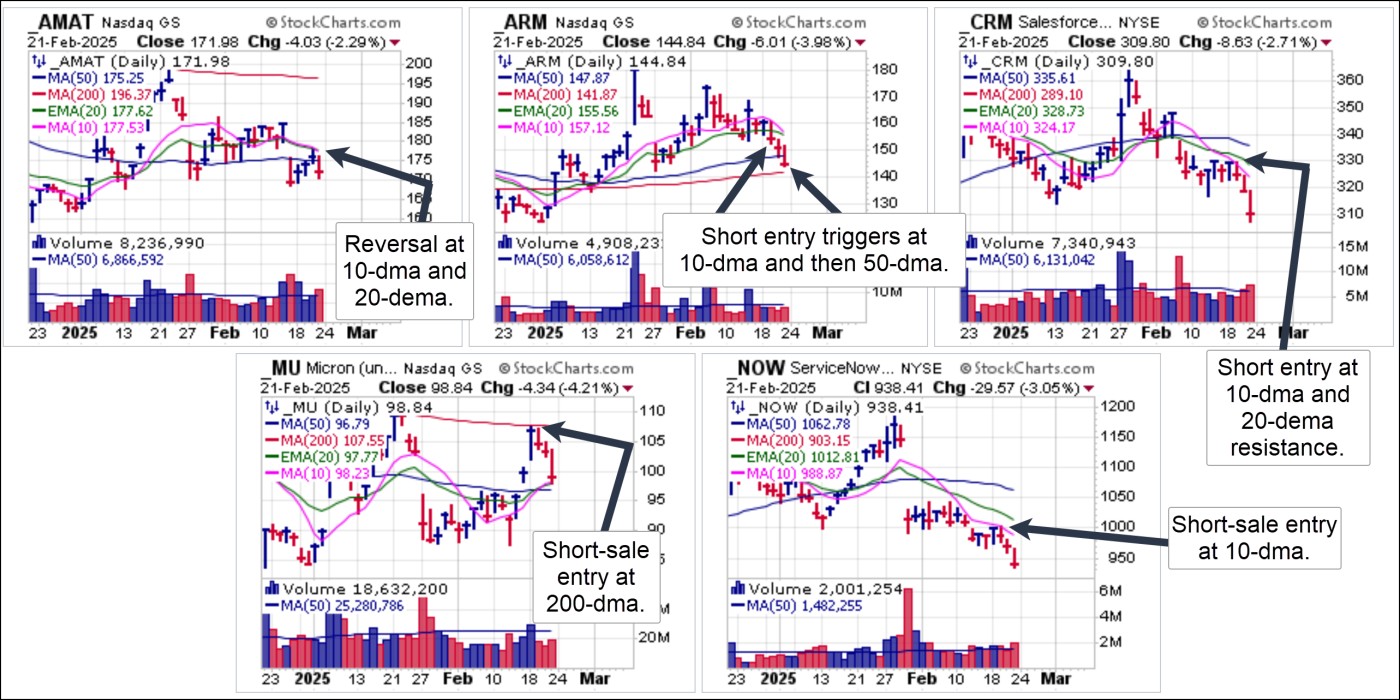
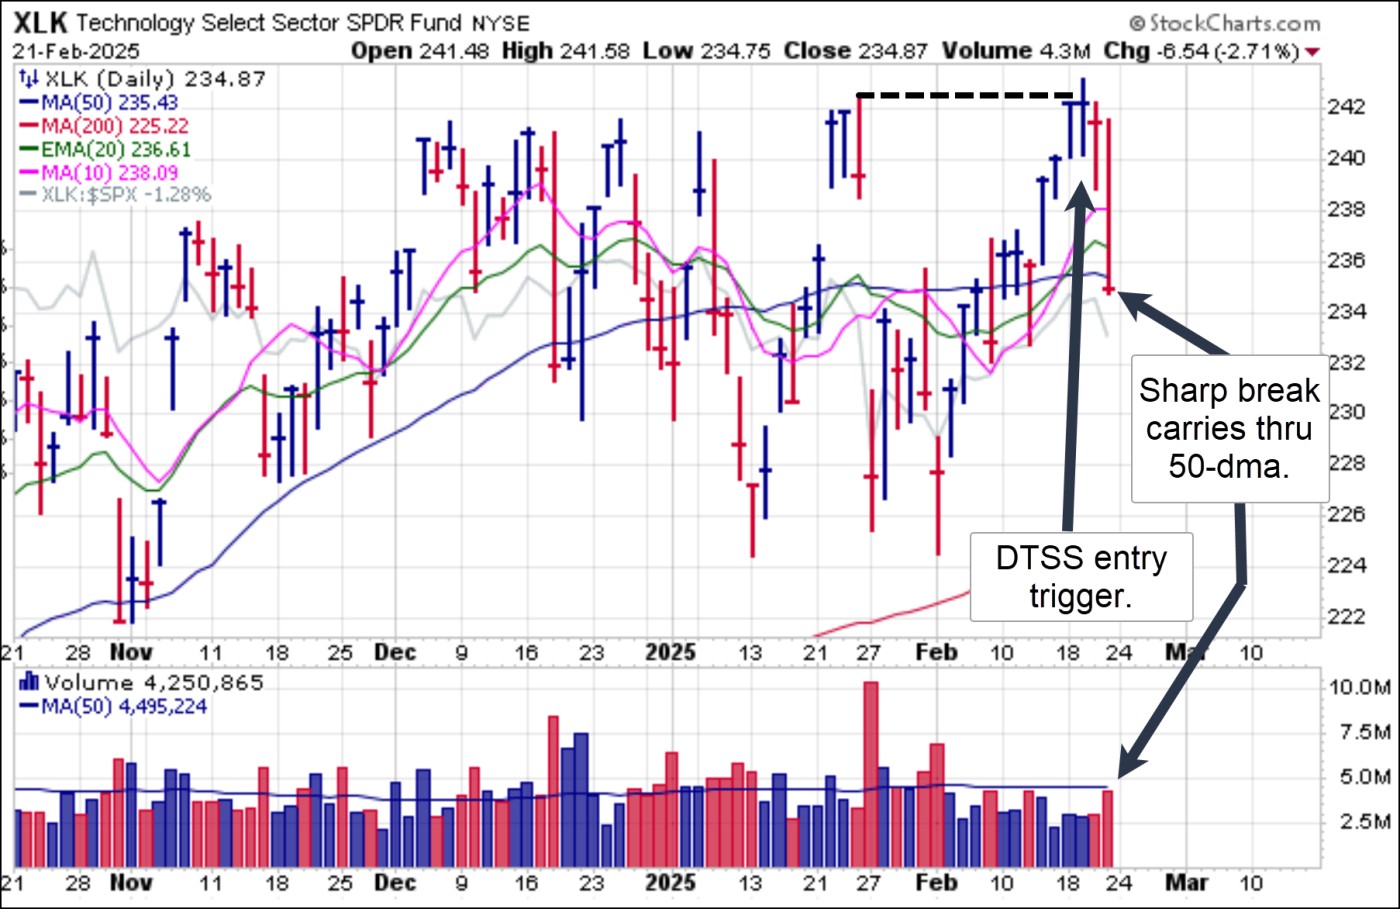 On Wednesday, in anticipation of impending weakness in technology based on the DTSS in the XLK, above, we issued Short-Sale Set-Up Reports on five big-stock tech names, Applied Materials (AMAT), Arm Holdings (ARM), Salesforce.com (CRM), Micron Technology (MU), and ServiceNow (NOW). In a difficult market environment as we are in now, it is difficult to find consistently successful set-ups, long or short. These five short-sale set-ups triggering on Wednesday all ended the week lower. The so-called hit rate here is interesting as it may be telling us something about this current market break as potential market feedback.
AMAT reversed at 10-dma and 20-dema resistance on Thursday before breaking below 50-dma support to trigger a second short-sale entry. ARM reversed at the 10-dma and busted 20-dema support on Wednesday before busting the 50-day line on Friday. CRM reversed at 10-dma resistance on Wednesday and broke to lower lows on Friday. MU reversed at 200-dma resistance on Wednesday and ended the week down at 50-dma support. A breach of the 50-dma would trigger a second short-sale entry from here. Finally, NOW reversed at 10-dma resistance on Wednesday and closed at lower lows on Friday.
 Bitcoin ($BTCUSD) reversed again at 50-dma resistance and closed Friday at the lows of the day. For now the 50-dma has served as consistent resistance following a failed breakout in mid-January. $BTCUSD remains in a potential late-stage failed-based (LSFB) short-sale set-up, but so far has shown support along and above the $90,000 level as it awaits some sort of catalyst from the Trump Administration, which so far has not been forthcoming.
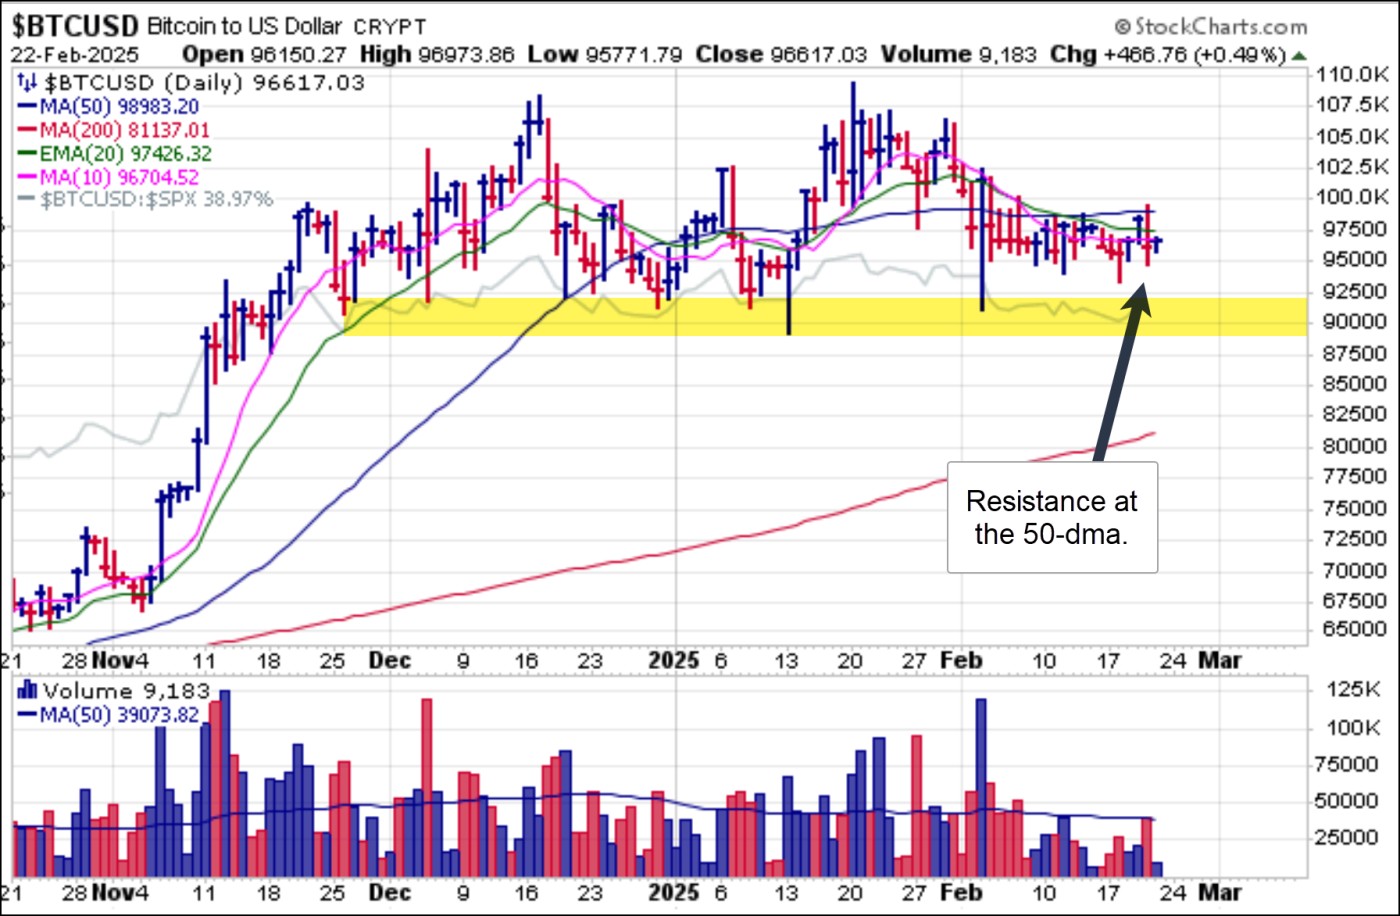 Meanwhile, money continues to flow into gold as the Continuous Gold Futures Contract ended its eighth straight upside week to post a new weekly high of $2,953.20/oz. Generally, in the past, gold will tend to correct with stocks after a short period of outperformance when the market corrects. Underlying conditions for the yellow metal, which is now a Tier 1 asset, are much different today than at any other time in the past 20 years or so. Therefore, it is always possible that this becomes more about underlying fundamentals than technicals.
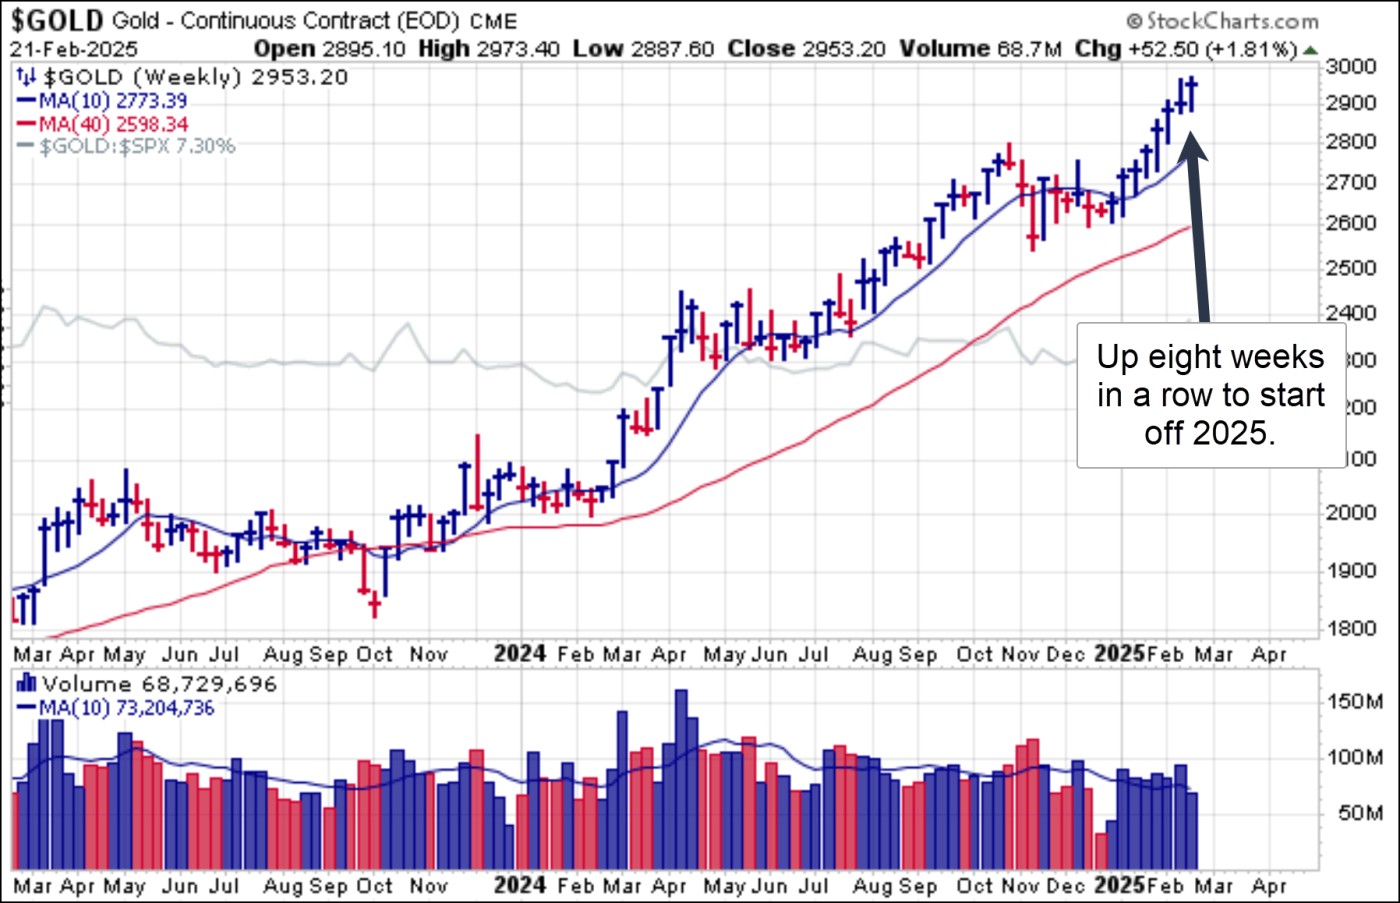
The Market Direction Model (MDM) remains on a BUY signal.