
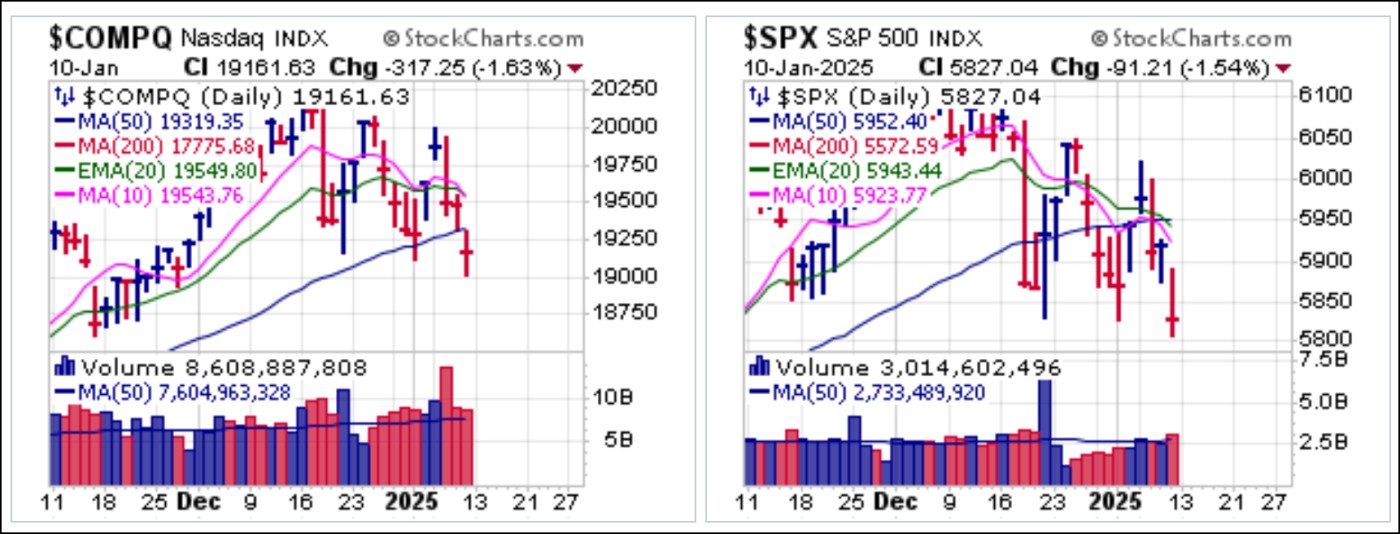
Major market indexes ended the week on a down note as the NASDAQ Composite closed below 50-dma support for the first time since peaking on December 16th, immediately after clearing the 20,000 level for the first time. The S&P 500 made its third visit to the land below 50-dma support on Tuesday and ended the week by posting its lowest closing low since it also peaked in mid-December. Lower lows and lower highs now characterize the action of the NASDAQ and the S&P 500 in what has been a very choppy and volatile downtrend over the past four weeks.
 Meanwhile, the Dow has broken out of a bear flag to lower lows with the NYSE Composite not far behind as the broader market remains flat on its back.
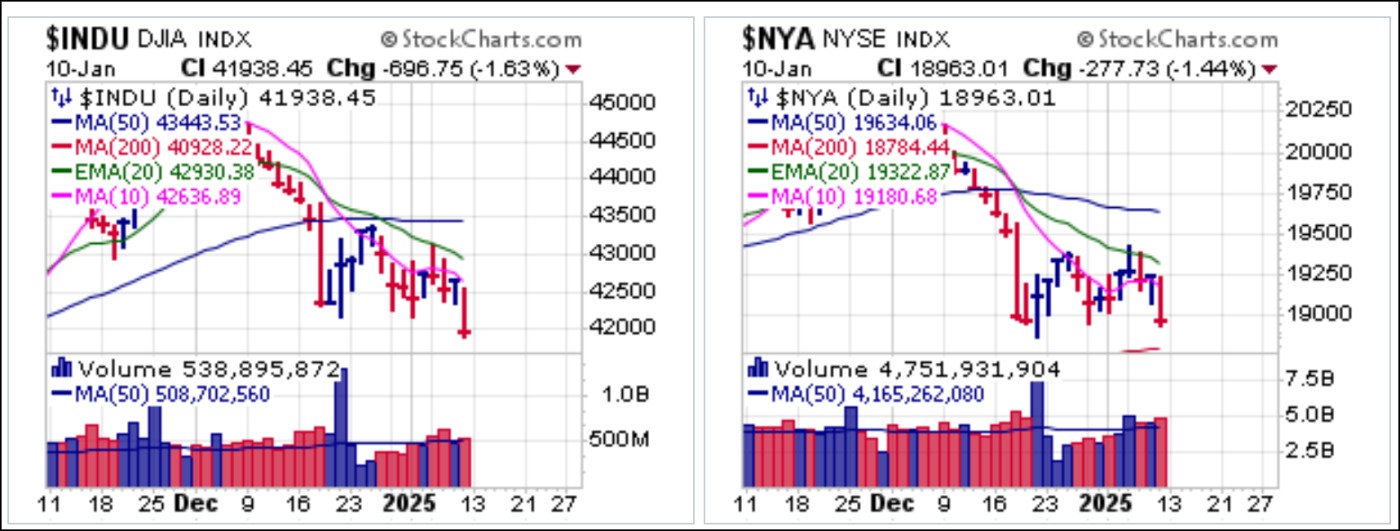 Friday's strong jobs number was the culprit for the selling as the Bureau of Labor Statistics reported 256,000 new non-farm payrolls vs. expectations of 154,000 and 223,000 non-farm private payrolls vs. expectations of 140,000. Last month’s numbers were revised downward by 12,000 and 13,000, respectively while the unemployment rate came in at 4.1% vs. expectations of 4.2%. This sent interest rates and the U.S. Dollar ($USD) meaningfully higher.
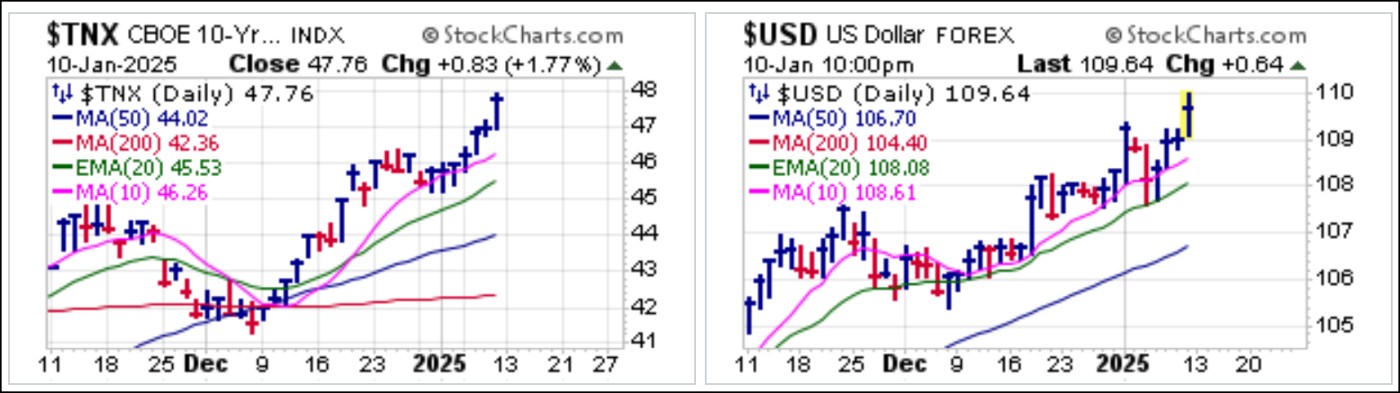 Ominously, regional banks sold off en masse as the SPDR S&P Regional Banking (KRE) ETF broke out to the downside of a well-defined bear flag.
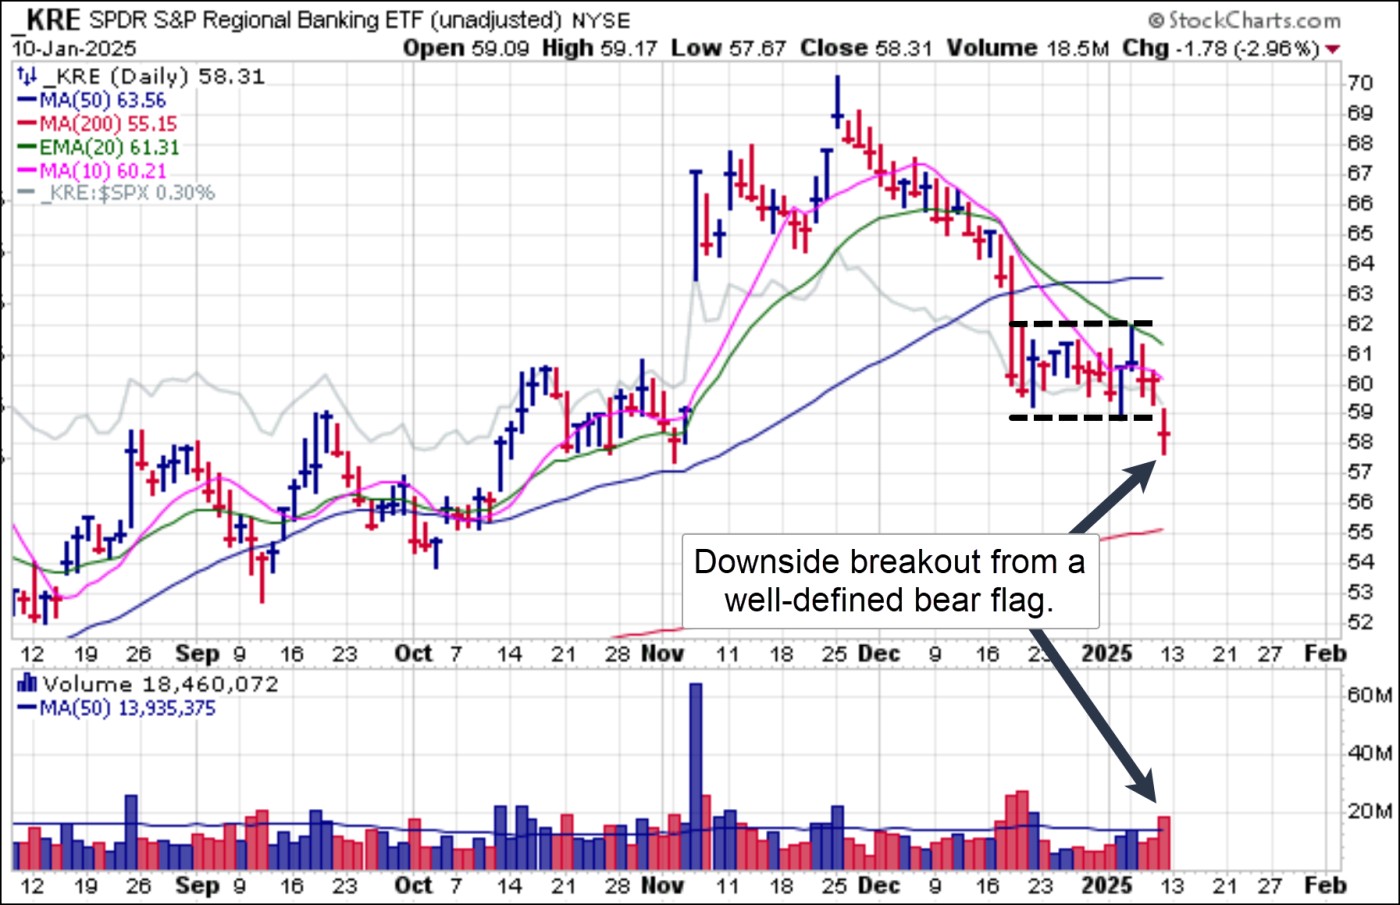 Weakness in the financial sector was not limited to regional banks and other small financials as the chart of the SPDR Select Sector Financials (XLF) ETF shows. Like the KRE, it also broke out to the downside of a well-define bear flag formation.
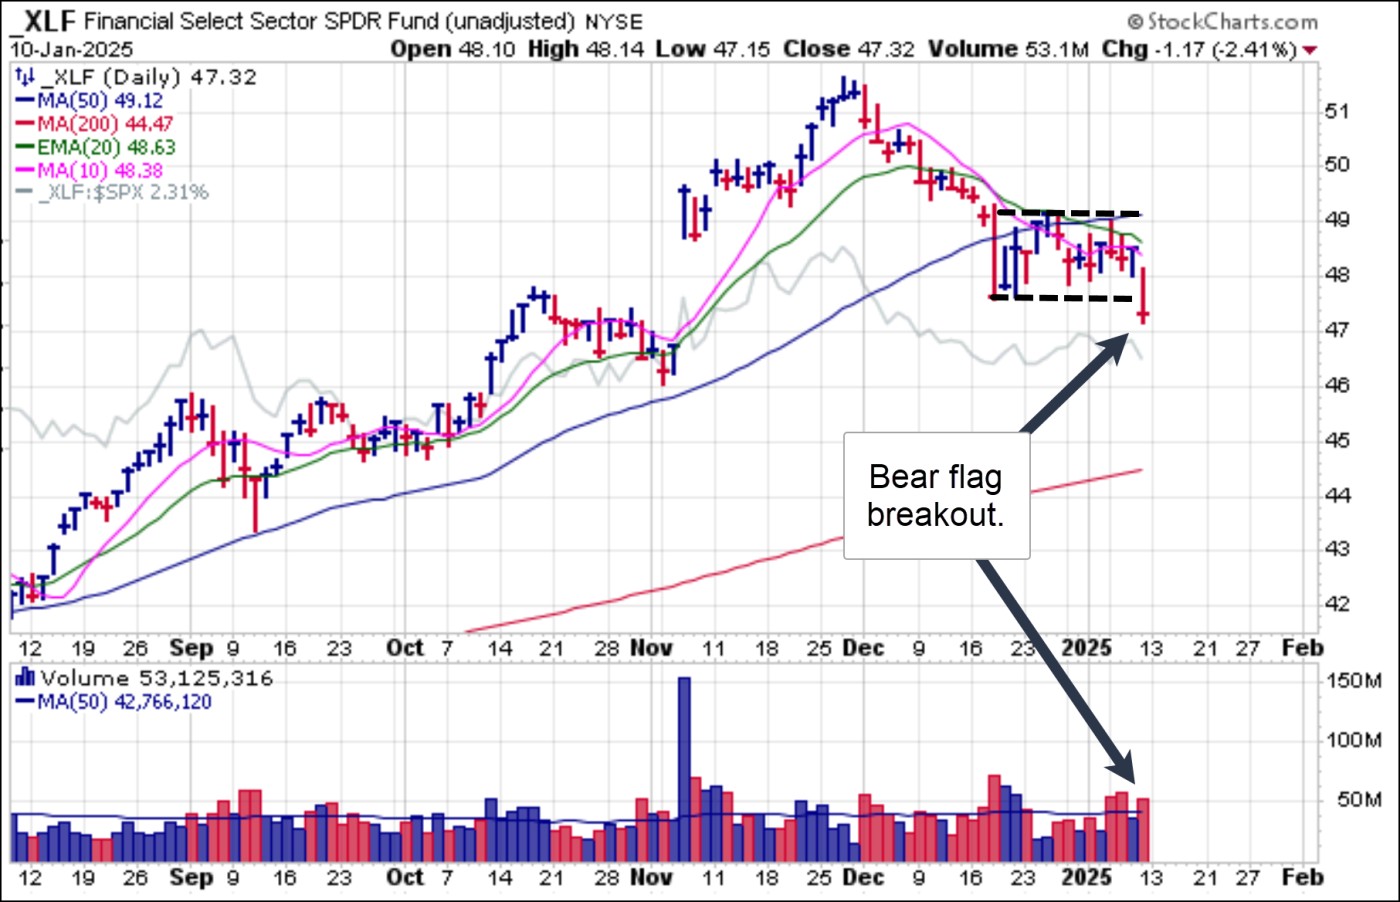 Bitcoin ($BTCUSD) is back below 50-dma support but continues to hold price support along the 91,000-92,000 price area. As previously noted, $BTCUSD will likely require concrete legislation from the Trump Administration and the new Congress if it is to permanently clear the $100,000 level. That said, one might also notice a fractal head and shoulders type of formation taking shape here, with support along the lows delineating the neckline.
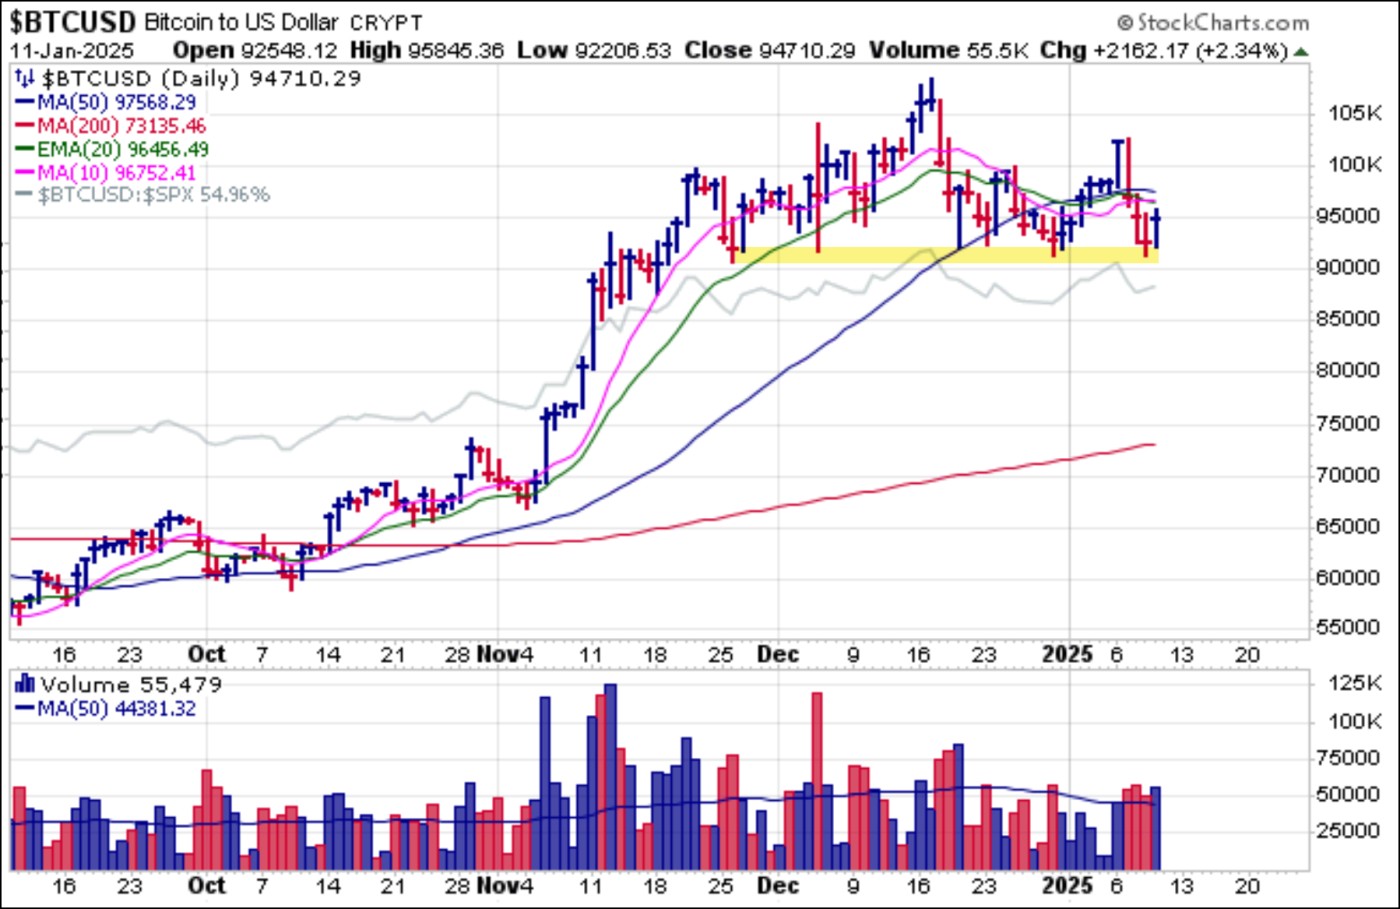
The evidence is clear - the market is now in a clear correction as all of the major market indexes continue to lower in what have been steady, if choppy, downtrends off the late November to mid-December peaks depending on the index in question.
The Market Direction Model (MDM) remains on a CASH/NEUTRAL signal.