
 The NASDAQ Composite posted bearish action of its own on Wednesday on a higher-volume outside reversal into the red before dipping below its 50-day moving average on Thursday. It then gapped higher on Friday and made up most of the prior two days' downside on big index volume. Overall, the index remains in a very choppy range extending back to the October lows.
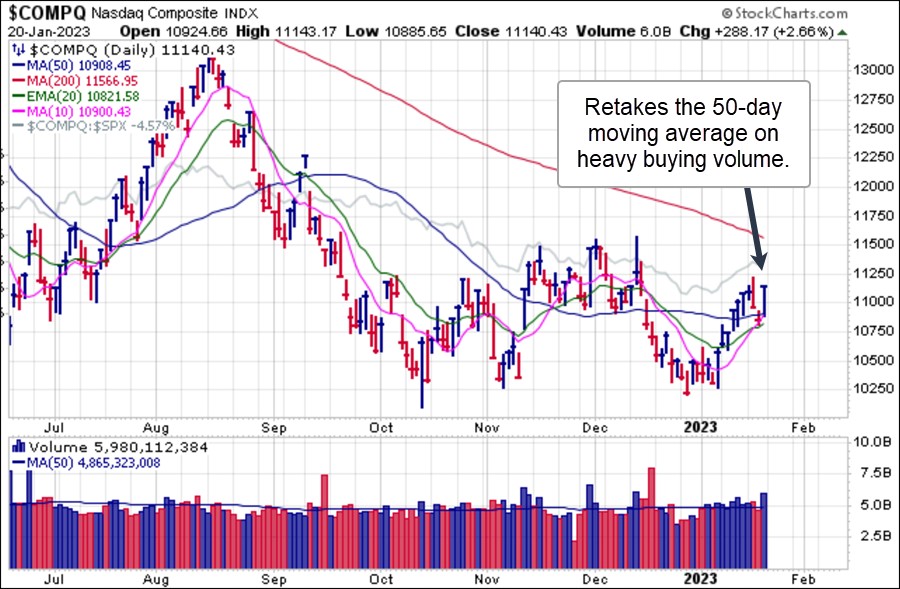 We have remained constructive on gold which made another weekly higher high in a move that is going vertical as the chart of the SPDR Gold Shares (GLD) illustrates below. The yellow metal is still extended on the upside and we would be looking for some kind of consolidation to come into play at some point. Otherwise, pullbacks to the 10-dma or deeper into the 20-dema would offer opportunistic add points if they occurred.
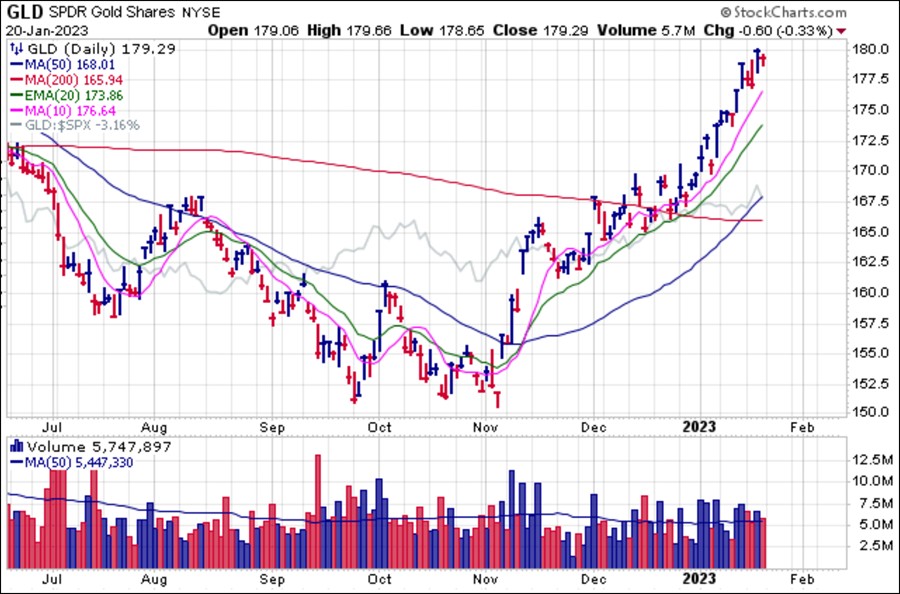 As we see it, there are currently two forces driving the dollar lower. The first is the potential for the Fed to reverse course and begin easing sooner than expected, otherwise known as the Fed Pivot. The second is the current movement towards de-dollarization as BRIC and EEU countries, along with many other southern hemisphere nations seek alternatives to the U.S. Dollar as a global reserve currency used in trade. Recent developments indicate that Saudi Arabia and China are coming to an agreement to trade and price oil in Yuan, effectively creating a PetroYuan to replace the PetroDollar which has been used exclusive for pricing and trading oil since 1973.
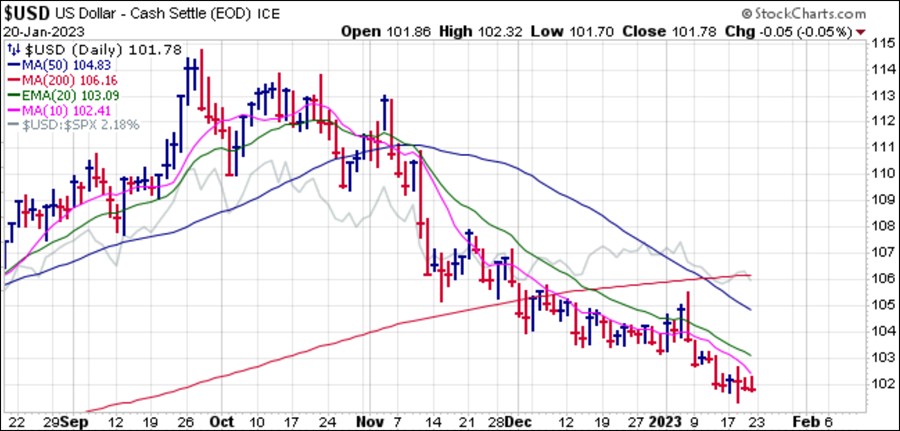 As gold has gone parabolic in early 2023, silver lags but the iShares Silver Trust (SLV) may soon play catch up as it currently forms a five-week base. This is the first real consolidation of the prior sharp uptrend off the October lows and so far silver does not show any signs of breaking down. We believe the SLV and other other silver ETFs such as the Aberdeen Physical Silver Trust (SIVR) or the Sprott Physical Silver Trust can be bought using the 20-dema as a rough selling guide of the 50-dma as a wide selling guide about 5% below where the SLV closed on Friday.
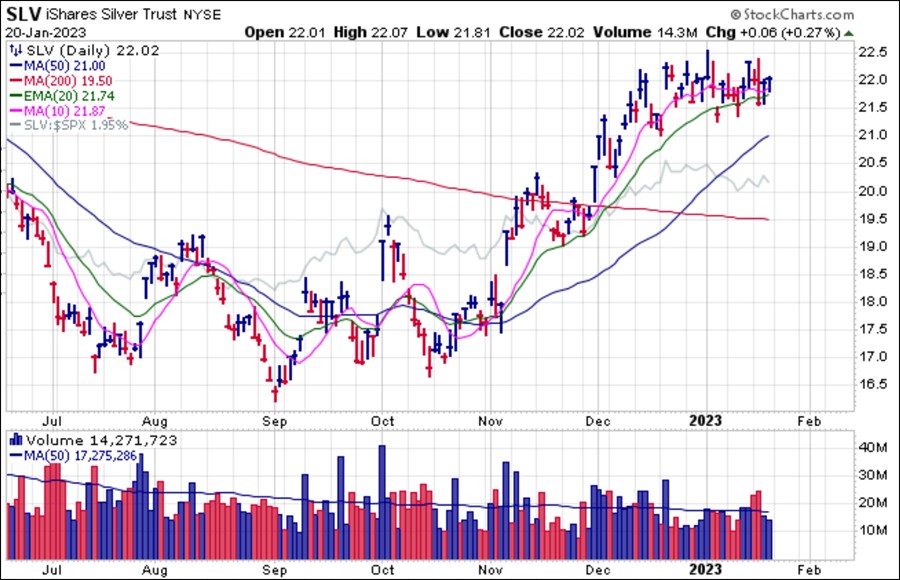 Gold miners have been an effective way to play the move in gold as we have discussed in our reports over the past few months. Our two favorite gold miners have been AngloGold-Ashanti (AU) and Gold Fields (GFI), both of which have been on a tear since early November of last year. Here we see AU posting a lower-volume pullback to the 10-day moving average, but given how extended the stock is at this stage we would look for an opportunistic pullback to the 20-dema as a preferred entry if we can get it.
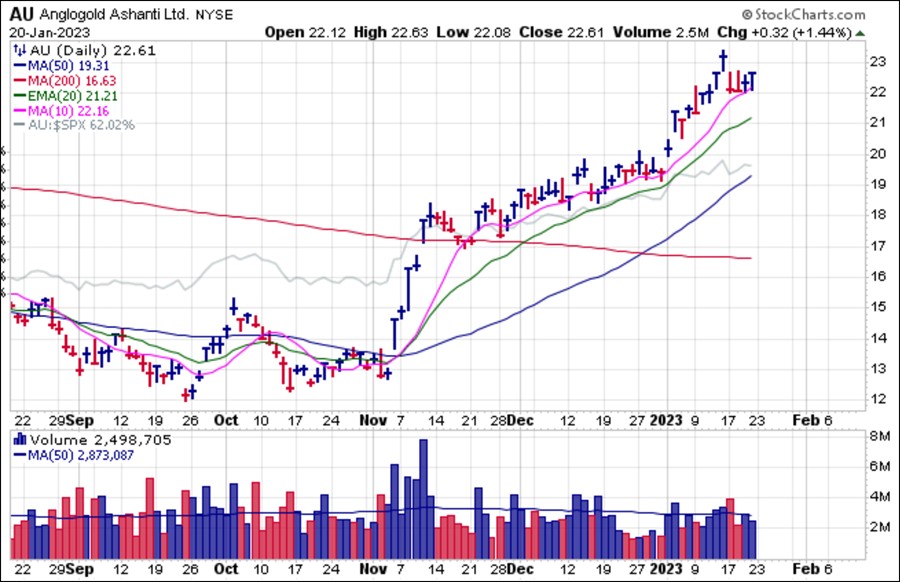
Gold Fields (GFI) had the biggest run up of all of the entire precious metals space back in November thanks to the general move in the group along with the simultaneous news that its deal to buy Yamana Gold (AUY) was off. Agnico-Eagle Mines (AEM) and Pan-American Silver (PAAS) came in with what was allegedly a better offer and so AUY dropped GFI’s hand in favor of more lucrative suitors.
That was good news for holders of GFI shares which shot higher and eventually cleared to a peak of 12.80 in a wild five-day move space before the stock backed down and formed a two-month base. Note that the pullback to the 50-day line market the low point of the base, after which a trendline breakout occurred at the start of the year. GFI is now testing that prior 12.8 to high where it ran into resistance two Fridays ago and has now backed into the 10-day moving average. While this is potentially viable along the 10- day line, as with AU we would prefer to see a pullback down to the 20-day line down at 11.67 as a more opportunistic entry if we can get it.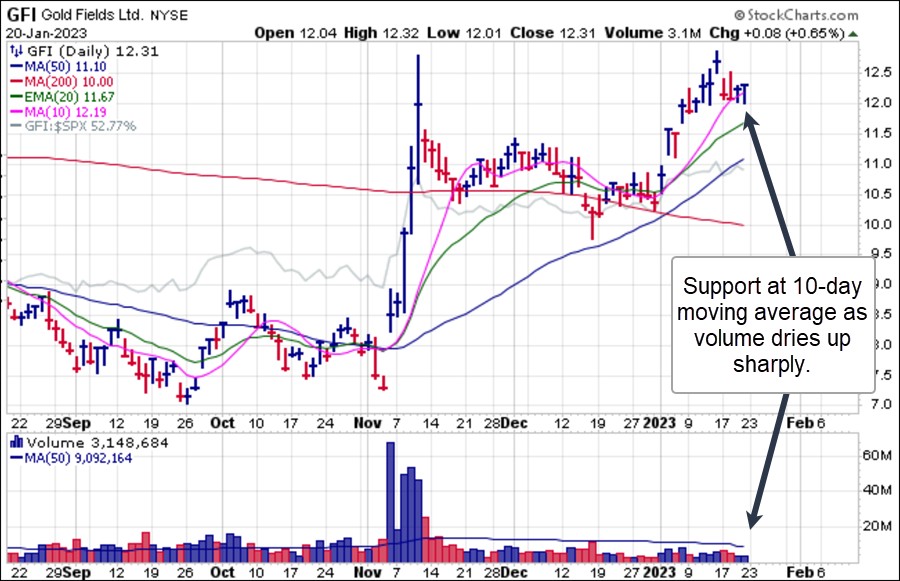
 While the short side of the market has been playable, the day-to-day volatility makes proper entries challenging. We reported last week about Ford (F) and General Motors (GM) as potential short-sale targets as they rallied into their 50-day and 200-day moving averages. F played out as a short at 200-dma resistance although at the time it was unclear whether 50-dma resistance were hold sway. As it turned out, F rallied right up into the underbelly of its 200-day line before gapping down two Thursdays ago. Thus, one had to be in position as of the close of that particular Thursday. Now the stock is sitting under the 20-dema which could be viewed as a possible short-sale entry using the line as a tight covering guide. It could also continue rallying back up to the 50-dma where a more opportunistic short-sale entry could be tested using the 50-day as a covering guide. This market environment requires that one map out all the possibilities and remain fluid when it comes to finding effective short-sale entries amid all the volatility.
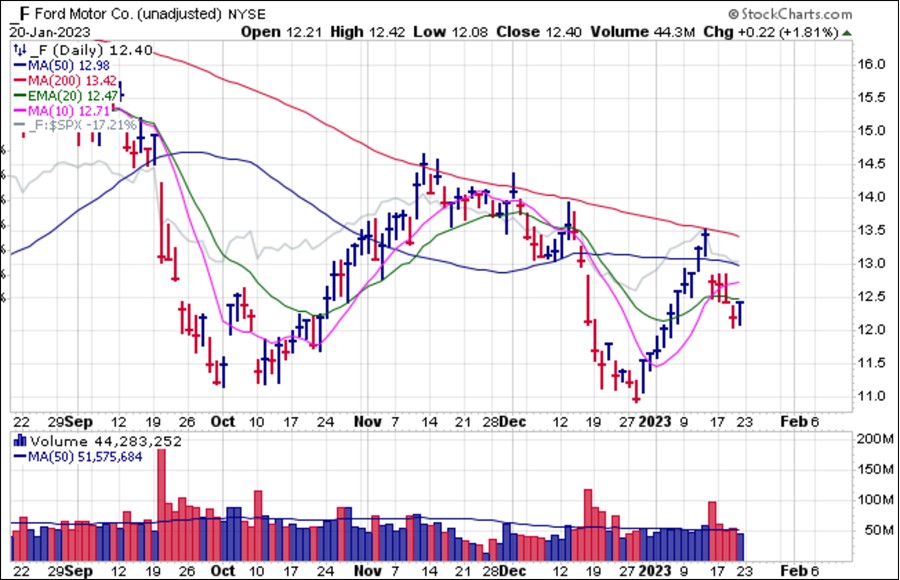 General Motors (GM) defied resistance at both its 200-day and then 50-day moving averages as it skidded right past both last week. It then gapped lower two Fridays ago, but there was no logical entry at moving average resistance as there was with F. However, a rally into the 50-day moving average on Wednesday of this past week offered alert shorts an opportunity put out a short position and GM then cooperated nicely from there, breaking below the 20-dema. As with F, the 20-dema could potentially serve as shortable moving average resistance, but also be alert to the possibility of a rally further up to the 200-dma or even the 50-dma as alternatives short-sale entry points if GM is able to bounce more strongly from current levels.
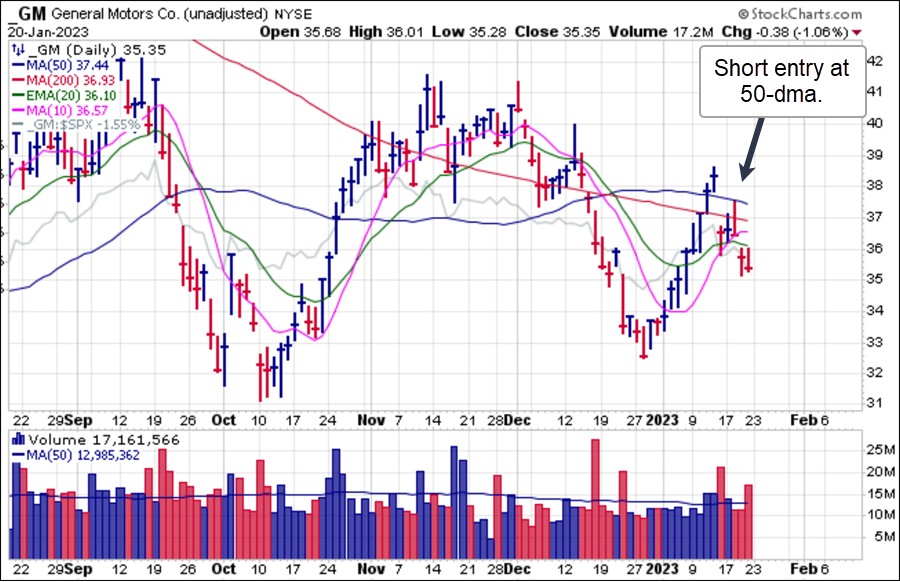 Volatility and uncertainty as the market hashes out the Fed Pivot possibilities makes this a market for nimble swing-traders. Trend-following intermediate- to longer-term investors who are not interested in playing the current trends in the precious metals space are likely better of in cash for now.