
The market have ridden a 75-basis point Fed rate hike, a second quarter of negative GDP growth, and not-as-bad-as-expected earnings reports in big-stock index names to higher highs as the NASDAQ Composite pushes further beyond its 50-day moving average in a typical bear market rally. The assumption is that the Fed is close to the end of its interest rate raising activities than not, clearing the way for new rounds of QE and a return to the nirvanic Land of ZIRP. Essentially, the crowd expects a Fed-engineered soft landing.
In our view, this ignores the potential for a Fed-engineered crash-landing (given the Fed's poor record for engineering soft landings) that creates a sharp economic slowdown, negatively impacting money flows, credit flows, and general liquidity which in turn keep massive money flows from returning to equities. We would also refer the reader to our Market Lab Report post of July 21:
At the same time, lowered expectations seven months into the 2022 bear market has set up a logical rationale for a bear market rally. As analysts have downgraded their expectations for stocks the more beaten-down they became, the stage has been set for these companies to still report poor earnings and revenue numbers but will rally if they can simply manage to beat lowered estimates. That may remain the case for many badly beaten-down stocks as we progress through earnings season.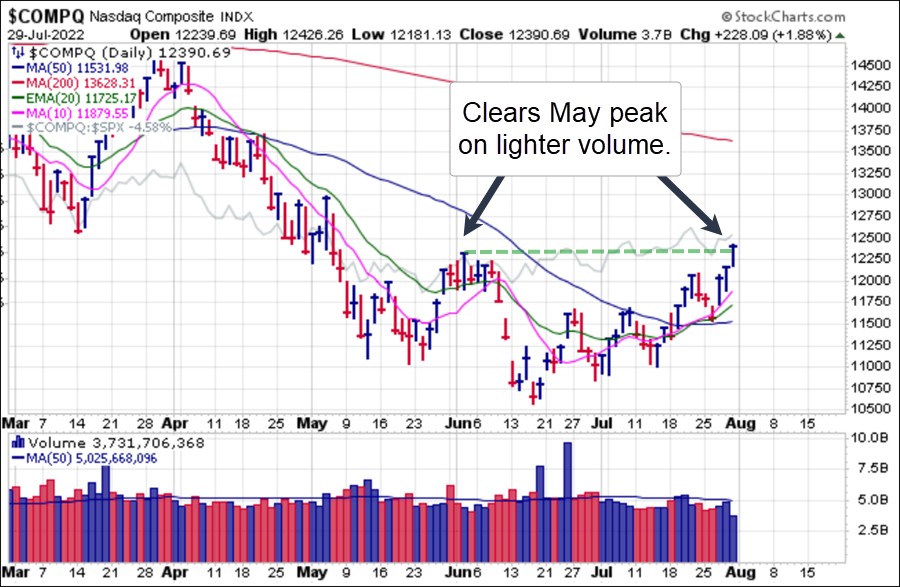 Typical bear market rallies within longer-term bear phases that occurred in 2000 and 2008 saw the indexes rally as far as their 200-day/40-week moving averages on the daily/weekly charts. Below we see a rally in Summer 2000 that finally ran out of gas and rolled over in September to start a new bear leg to the downside in an ongoing bear market that ultimately did not bottom until 2003. Note the double-top formation that formed just above the 40-week line, with the second peak marking the final top before the next bear leg set in.
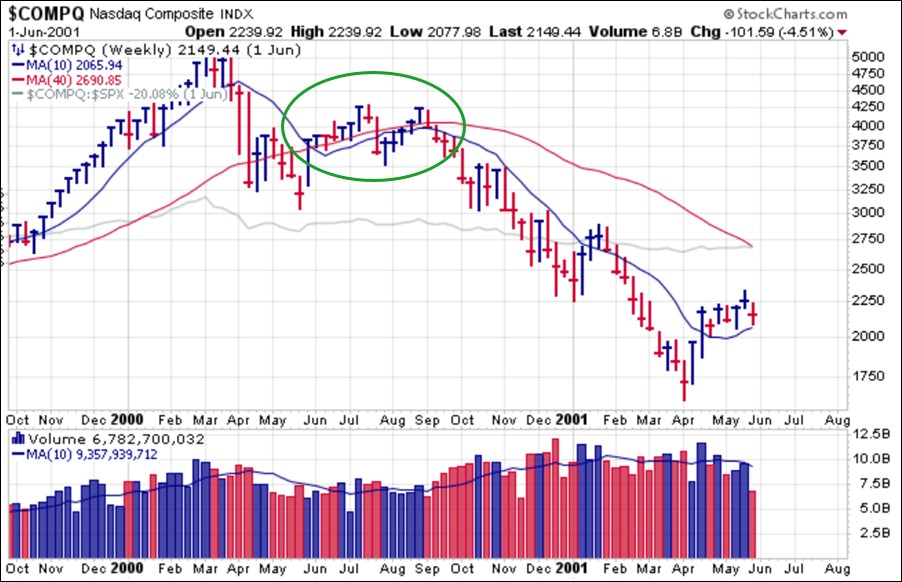 In 2008 following the October 2007 market top ahead of the great financial crisis Bear Market saw two bear market rallies, one in spring and one in summer. This has a similar double-top look, but in this case the second high in August 2008 is well below the first high in May. The market then blew apart in September.
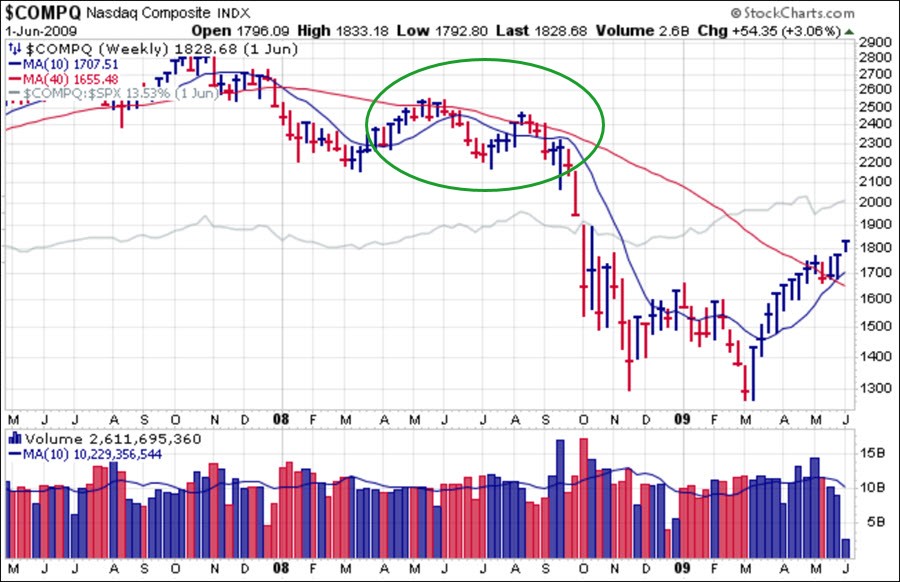 Today we see the NASDAQ Composite is well below its 40-week and 200-day moving averages, so it is certainly possible that the current bear market rally could carry further if it is similar to the last two major bear markets we've seen 2000-2003 and again in 2007-2009. If the Everything Bubble has a bigger bill due as a result of off-the-charts money-printing, debt, and leveraged speculation in a variety of bubbly manias from crypto to SPACs to real estate then perhaps this rally does not carry as far as the 200-day/40-week moving averages on the respective daily and weekly charts.
With so many bizarre paradoxes and cross-currents that make up current underlying conditions, most of which we have not been seen previously in market history, the market has little to operate on other than the singular hope that the Fed will soon be forced to capitulate to weakening economic conditions and begin reversing hawkish monetary policy. The idea that the Fed will slay the inflation dragon with one or two more rate hikes once and for all may turn out to be somewhat presumptuous at this stage. A market rally that depends entirely on this singular Fed outcome has the potential to be dangerously premature, so in our view caution remains warranted, any natural bear market rally notwithstanding
The Market Direction Model (MDM) remains on a SELL signal.