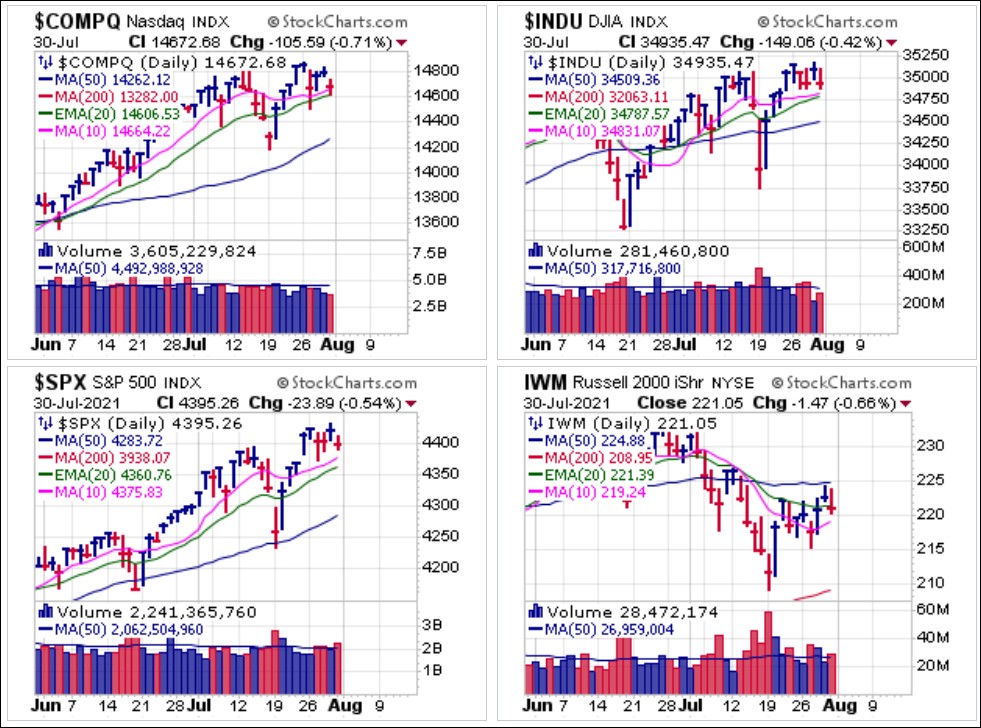
Major market indexes closed down in the final week of July despite posting all-time highs early in the week. The The Market Direction Model (MDM) switched to a BUY signal on Wednesday, July 28, but has not been accompanied by further upside in the major market indexes. If the indexes begin to deteriorate again, then the signal may be reversed. Otherwise, on an individual stock basis, we continue to find nothing that meets the criteria for inclusion on our Focus List, which remains empty for now.
 This past week saw all of the S&P Five, the five big-stock NASDAQ techs that comprise over a fifth of the S&P 500 Index, report earnings. While these reports were highly anticipated to produce blow-out numbers and big rallies that would propel the market higher, the net effect was a dull thud as Apple (AAPL), Alphabet (GOOG), and Microsoft (MSFT) went nowhere after earnings while Amazon.com (AMZN) and Facebook (FB) flopped.
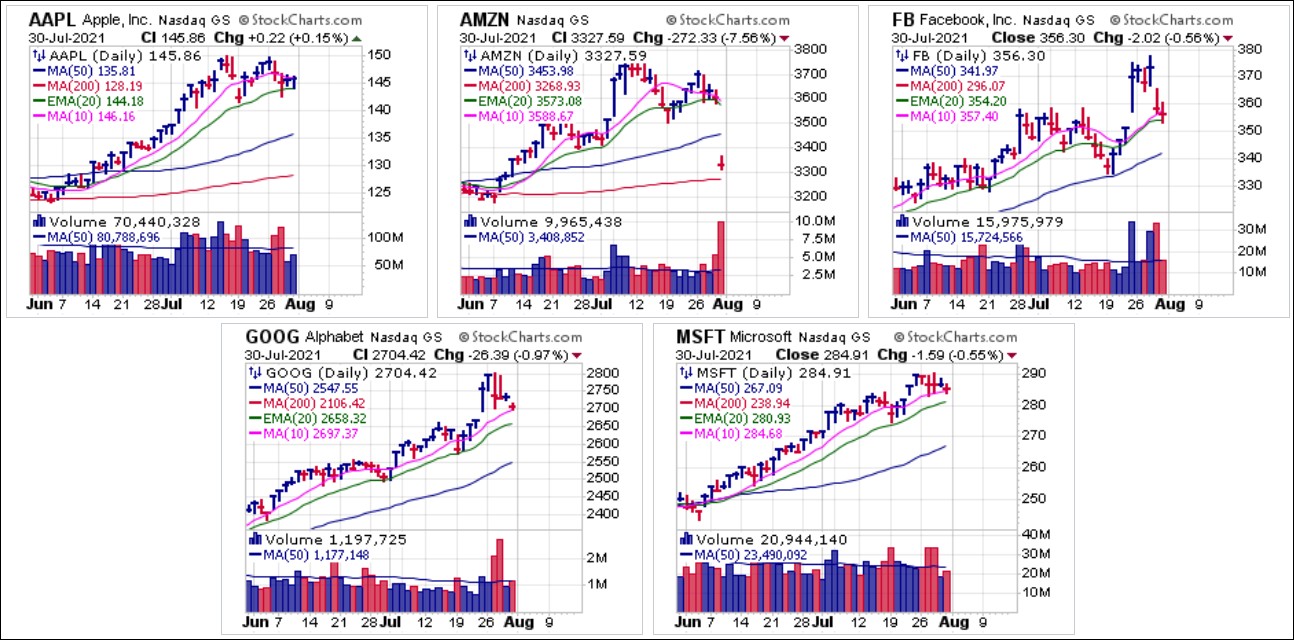
Nevertheless, tech leaders such as FB and GOOGL have been trending higher in sloppy fashion despite the majority of the market which has been dragging. AAPL and AMZN both broke out of bases on their weekly charts recently and look to move higher though AMZN's earnings report came in light causing the stock to gap lower.
On the other hand, GOOGL's earnings came in strong so it gapped higher but is reversing as the stock market has been trading lower the last couple of days. Its revenues came in at over $61 B vs. estimates of $56.23. Earnings came in at 27.26 vs estimates of 19.325.TSLA's earnings report was nicely ahead of expectations. Its car margin sits at 28% vs. most companies such as Comcast which sits at 12%. Revenue growth was 98%, EBITDA growth 106%. They're sold out of powerwalls until the end of next year due to pent up demand. The PEG ratio (price-to-earnings to growth) is 0.9633. No disruptive tech stocks have such a low PEG ratio. Its P/E is 100 based on today's earnings, not 1200 as mistakenly reported by some sources. It has been getting support at its 40-week MA.
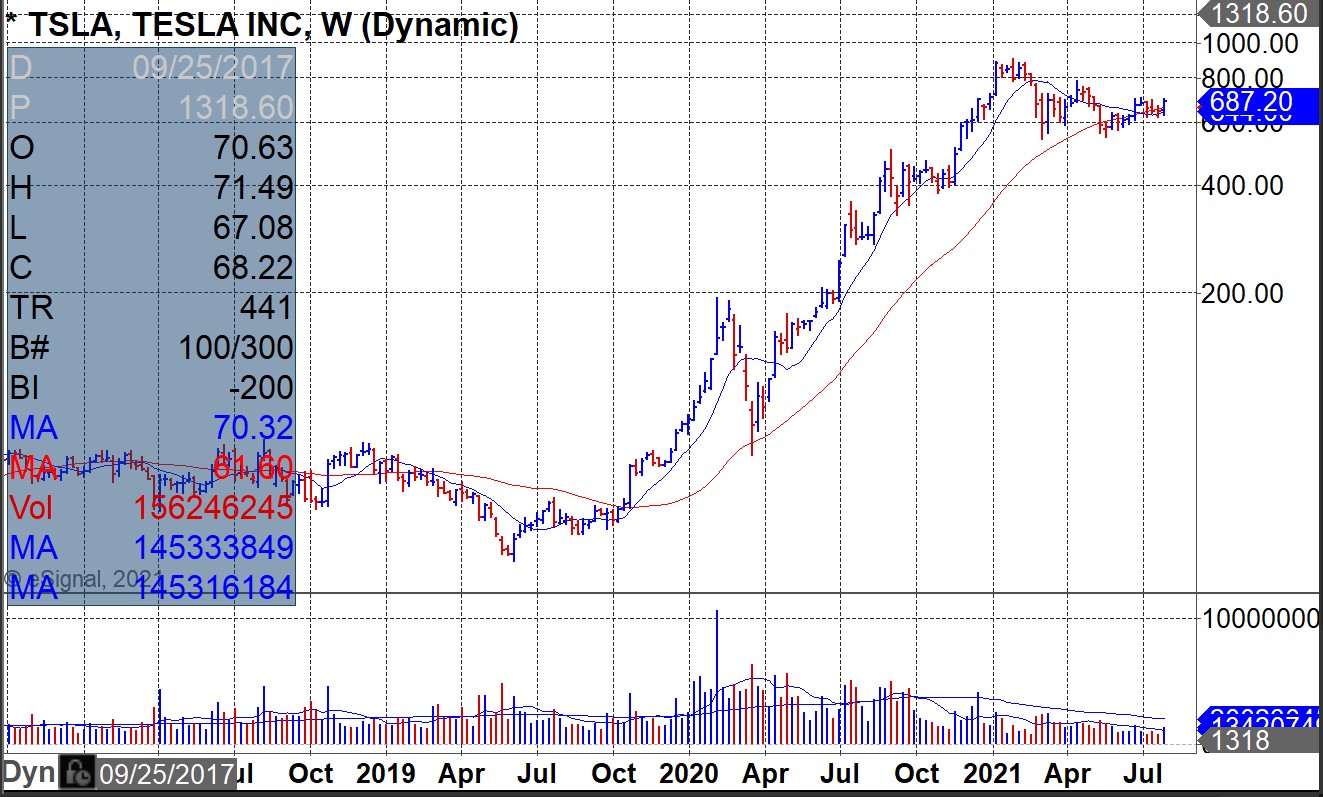
For longer term holders using weekly charts and 10-week and 40-week moving averages, all of the above names can be held for the longer term but only buy at logical entry points with favorable risk/reward and never buy extended unless you're willing to deal with drawdowns that may exceed your risk tolerance levels. A stock such as TSLA can have steep corrections as shown on its weekly chart above.
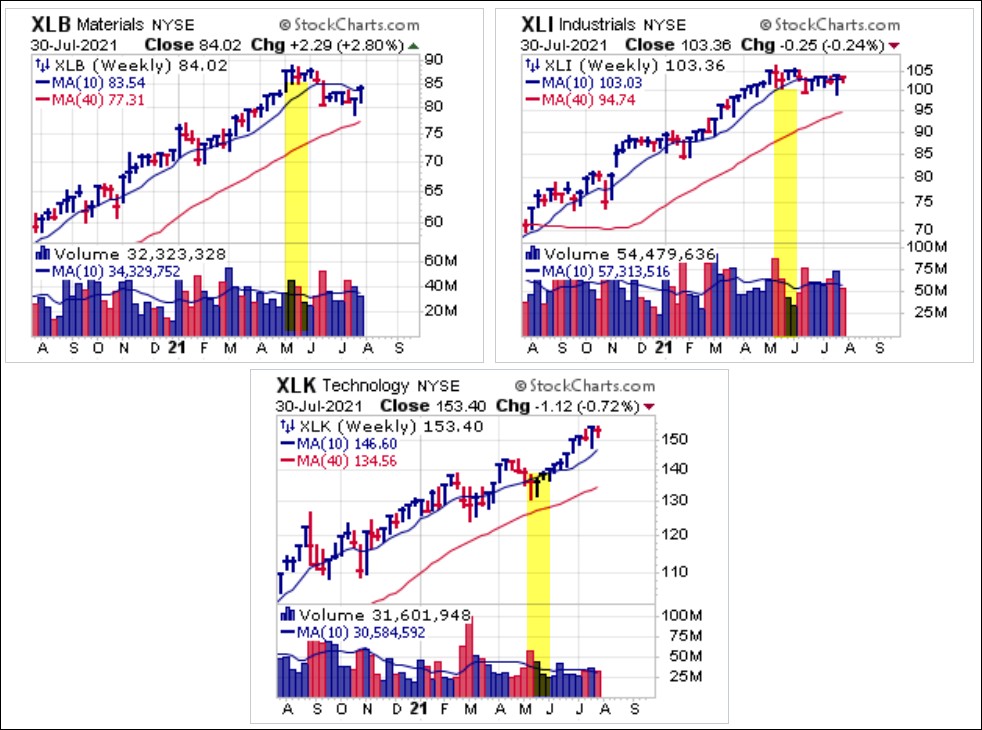
The rotational nature of this market environment is evident on the weekly charts of the Select Sector SPDR Materials Fund (XLB), the Select Sector SPDR Industrials Fund (XLI) and the Select Sector SPR Technology Fund (XLK). The inflation-trade led by stuff stocks in the materials and industrials sectors was outperforming throughout March and April before topping and correcting in May. At the same time, technology had been lagging until May when tech/growth names bottomed and began to turn higher. Thus, a rotation out of the inflation-trade stuff stocks and back into tech has dominated the action since early May, leading to a bifurcated market where the indexes are able to continue trending higher while individual stocks underneath the surface are much more mixed.
 This is also evident to some degree in the lagging NYSE Advance-Decline line.
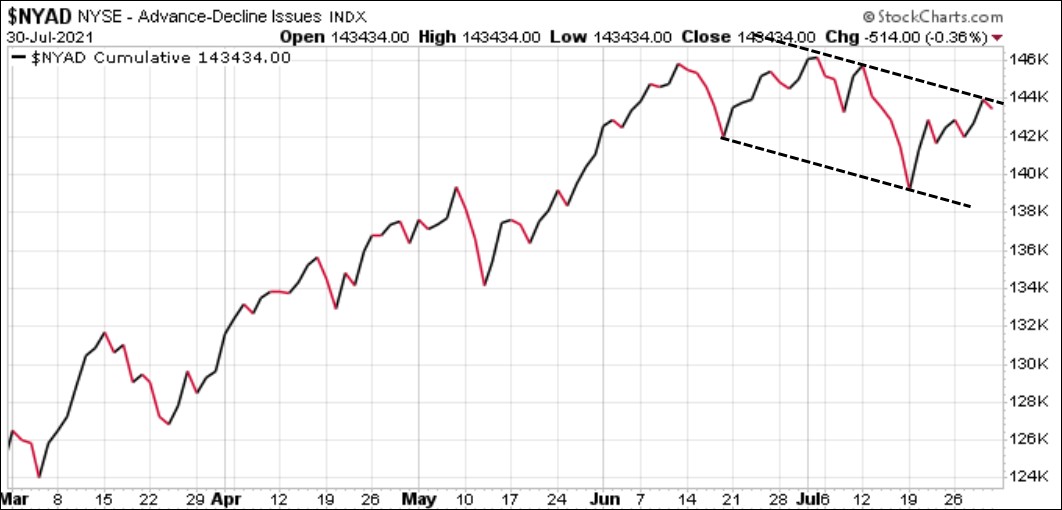 And to a much more severe degree in the lagging NASDAQ Advance-Decline line.
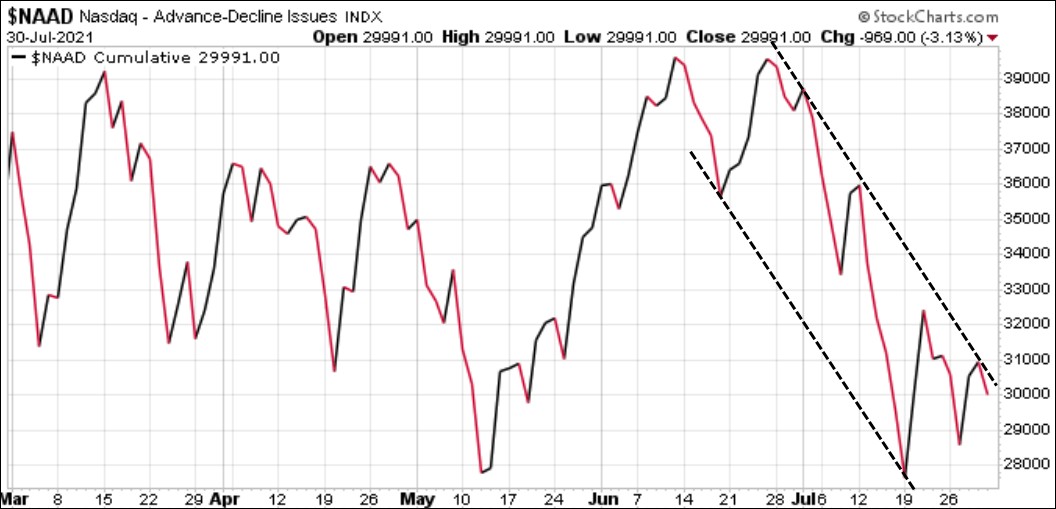 The primary issue with the current market environment in our view is uncertainty regarding inflation and the Fed's responses thereto. Equally important is the severe lack of fresh merchandise and compelling thematics in the way of new developments in key industries and companies pushing the innovation envelope. This has led to a somewhat stale, highly rotational market as groups run up and then correct while other groups rise off their lows to assume leadership roles. Thus, we continue to view the market as primarily a swing-trading environment.
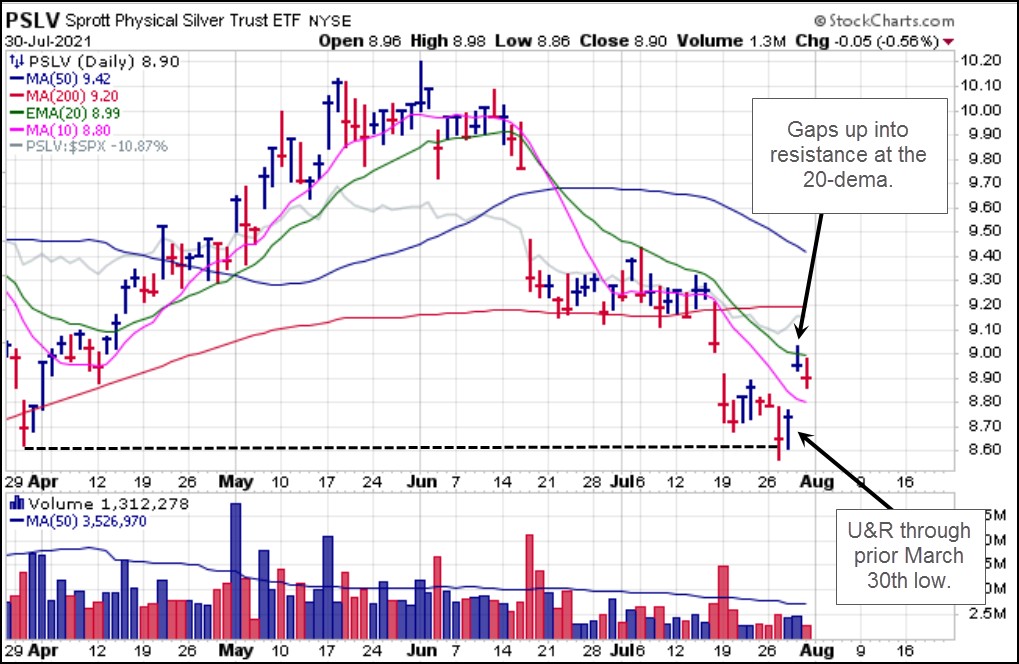
On Wednesday morning we reported on the Sprott Physical Silver Trust (PSLV) as a Pocket Pivot along its 8.62 March 30th low. That resolved in a sharp gap-up move the next day up just beyond the 20-dema and appeared to be setting up as a buyable gap-up (BGU) at that time as we reported. However, by the close, volume receded sharply and the volume requirement for a BGU was not met. The 20-dema now acts as near-term moving average resistance with the 10-day moving average at 8.80 as a reasonable trailing stop for any position taken Wednesday on the basis of the pocket pivot at that time.