Current Focus List
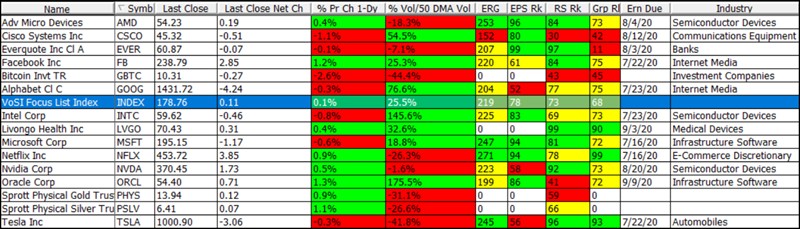
The VoSI Focus List is a compilation and reference list of stocks for which Pocket Pivot or Buyable Gap-Up Reports have been issued and which have been deemed suitable for inclusion on the Focus List. Not all stocks for which a Pocket Pivot or Buyable Gap-Up report has been issued will necessarily be added to the list. It is not intended as a "buy list" or a list of immediately actionable recommendations. Stocks on the list may or may not be in proper buy positions, and investors should exercise discretion and proper judgement in determining when and where stocks on the Focus List can be purchased. The following notes are intended to assist in this process. Please note that members can enlarge the Focus List image by clicking on the body of the email and then holding the Control Key while pressing the "+" key until it is large enough to read.
General Observations:
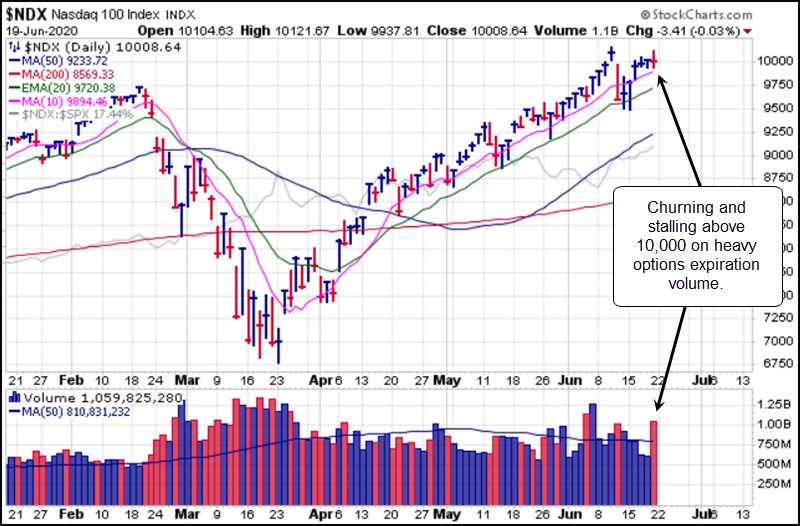
The NASDAQ 100 Index posted its first weekly close above the 10,000 level, but stalled on heavy quadruple-witching options expiration volume on Friday. It remains in a short double-top type of formation after rebounding off the 20-dema on Monday following a sharp gap-down open.
Meanwhile, both the Dow and the Russell 2000 Indexes remain below their 200-day moving averages. The lack of strength in the alleged “risk-on” Russell 2000 Index points to the fact that this is mostly a QE-driven rally led by big-stock names. We expect that volatility will remain high, with the potential for Black Swans (and possibly White Swans) lurking around every corner.
The Market Direction Model (MDM) switched to a CASH/Neutral signal on Monday but switched back to a BUY signal on the same day. Limitless liquidity continues to provide a firm floor for any setbacks, economic or otherwise. Markets continue their relentless, but choppy/noisy, gap-down-prone uptrends. The recent sharp pullback was even more brief than expected despite renewed cases of COVID-19 which could prolong or reinstate parts of the lockdown. Part of successful investing is remaining fluid to changing conditions at all times.The market boost that day was caused by this announcement: The Federal Reserve Board announces updates to Secondary Market Corporate Credit Facility, which will begin buying a broad and diversified portfolio of corporate bonds to support market liquidity and the availability of credit for large employers. Full report:
https://www.federalreserve.gov/newsevents/pressreleases/monetary20200615a.htm
Notable Action Among FL Names:
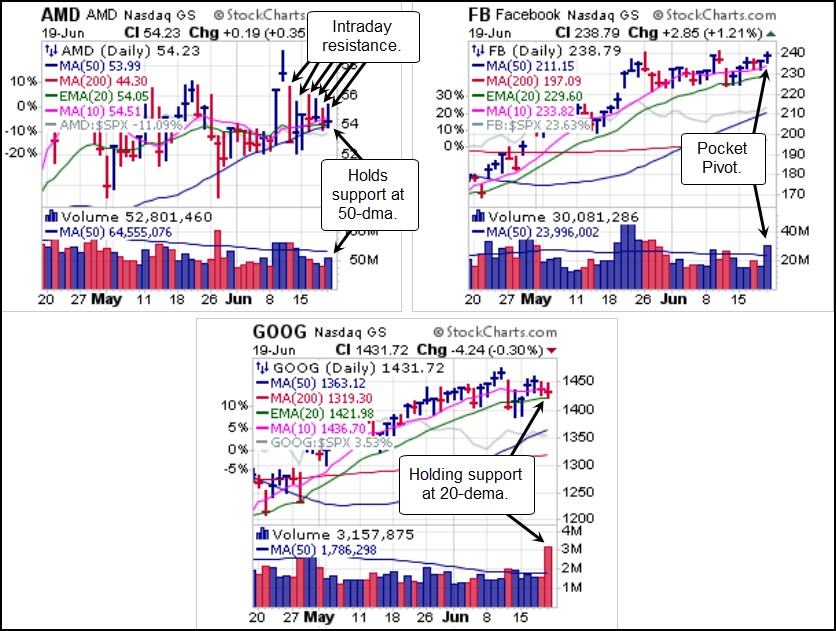
Advanced Micro Devices (AMD) is again back at critical support along the confluence of its 10-dma, 20-dema, and 50-dma. This technically puts it in a lower-risk entry position using the lowest moving average among the three as a tight selling guide. However, note the steady intraday resistance the stock has encountered since getting sold into its gap-up breakout attempt of eight trading days ago on the chart.
Facebook (FB) posted a pocket pivot on Friday as it found support within 1% of its 10-dma and then turned higher.
Alphabet (GOOG) has settled into its 20-dema which may offer a lower-risk entry using the 20-dema as a selling guide.
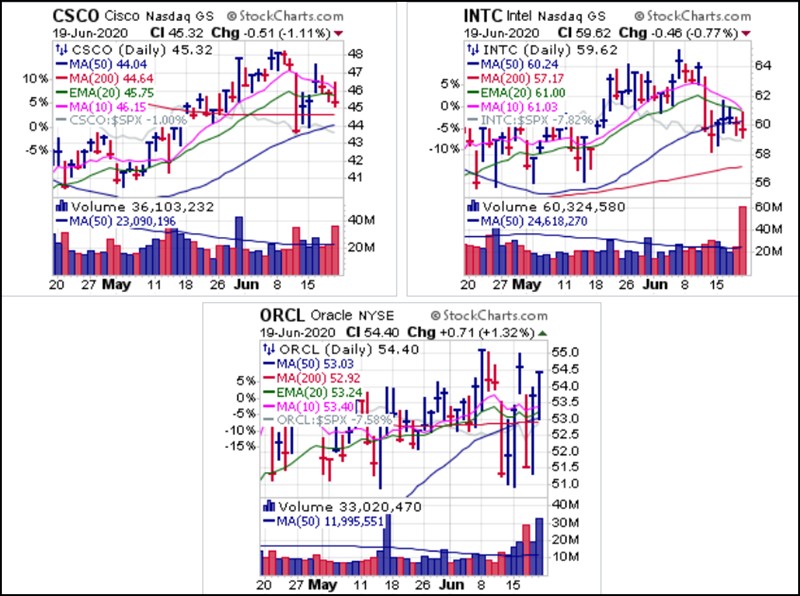
Big NASDAQ names Cisco Systems (CSCO) and Intel (INTC) are floundering, while Oracle (ORCL) remains extremely erratic.
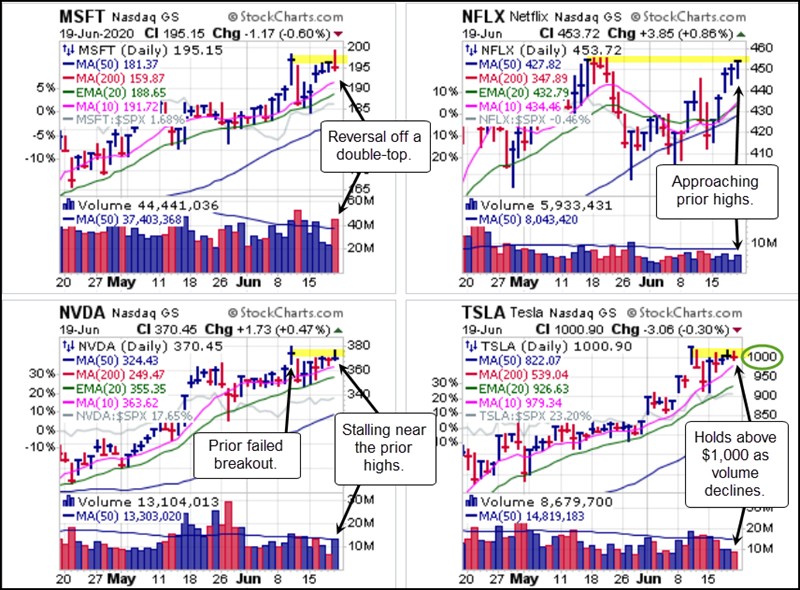
Meanwhile, other big-stock NASDAQ names on the Focus List are showing tentative action. Microsoft (MSFT) stalled and reversed from the $200 Century Mark on Friday on heavy volume. This is also a reversal in a double-top type of formation.
Netflix (NFLX) acts well as it approaches its prior May highs. Volume, while light, was at least higher vs. the prior day on Friday, and the stock is extended in this position.
Nvidia (NVDA) stalled and reversed near the highs of its prior flag breakout attempt over a week ago. The 10-dma stands as near-term support.
Tesla (TSLA) closed Friday just above the $1,000 Millennial Mark (also the 10th Century Mark) at 100.90. So far the stock has not shown any impetus to veer far from the 10th Century Mark as it spins around the $1,000 level with no resolution. Technically, in this position 90 cents above the Century Mark, TSLA is buyable based on Jesse Livermore's Century Mark Rule for the long side using the $1,000 level as a selling guide. Conversely, should TSLA break below the $1,000 level in decisive fashion, it could also trigger a short-sale entry based on Livermore's same rule in reverse for the short side. Thus this remains a fluid situation.
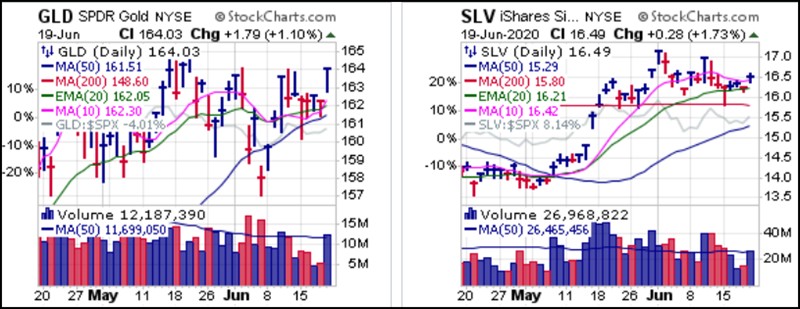
Precious metals moved higher on Friday. Both the SPDR Gold Shares (GLD) and iShares Silver Trust (SLV) gapped to the upside but remain within existing price consolidations.
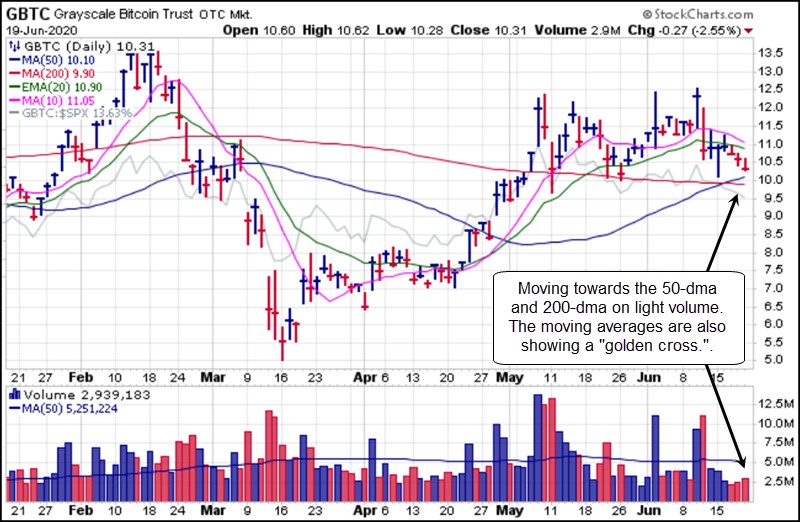
Bitcoin as represented by the daily chart of the Grayscale Bitcoin Trust (GBTC) is pulling back on light volume as it now approaches its 50-day moving average. The 200-day line lies just below as the two moving averages have intersected in a "gold cross" with the 50-day line now above the 200-day line. We continue to view maximum support at the 200-day line. If it can hold the 50-day line so much the better. A continued pullback to either moving average may offer a lower-risk entry using the 200-day line as a maximum selling guide.