
Current Focus List
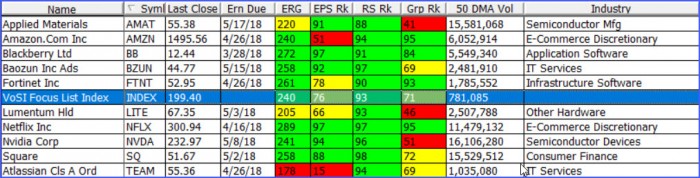
The VoSI Focus List is a compilation and reference list of stocks for which Pocket Pivot or Buyable Gap-Up Reports have been issued and which have been deemed suitable for inclusion on the Focus List. Not all stocks for which a Pocket Pivot or Buyable Gap-Up report has been issued will necessarily be added to the list. It is not intended as a "buy list" or a list of immediately actionable recommendations. Stocks on the list may or may not be in proper buy positions, and investors should exercise discretion and proper judgement in determining when and where stocks on the Focus List can be purchased. The following notes are intended to assist in this process. Please note that members can enlarge the Focus List image by clicking on the body of the email and then holding the Control Key while pressing the "+" key until it is large enough to read.
General Observations:
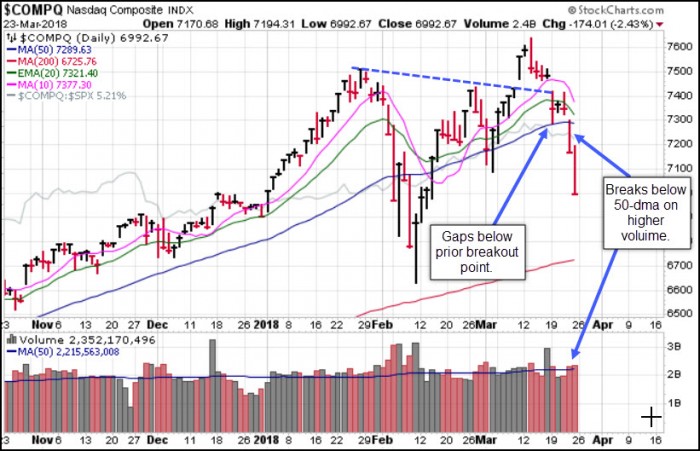
Major market indexes came undone this past week as the NASDAQ Composite Index first gapped below its prior breakout point on Monday and then gapped and broke below its 50-dma on Thursday on higher trading volume. This is another sharp break off the peak not unlike that seen in early February. The NASDAQ now looks poised to test its 200-dma and the prior February lows. Meanwhile, the S&P 500 Index, which was already lagging the NASDAQ by virtue of its failure to break out to new highs two weeks ago in conjunction with the NASDAQ, gapped below its 50-dma on Monday and traded down to its 200-dma on Friday. Overall, the action is extremely bearish, and we previously warned members of the potential for further downside earlier in the week in our morning Pre-Market Pulse/Focus List Notes report.
The Market Direction Model (MDM) shifted to a sell signal on Friday morning.
Removed from the List this Week: None.
Focus List Stocks Expected to Report Earnings this Week: None.
Notable Action:
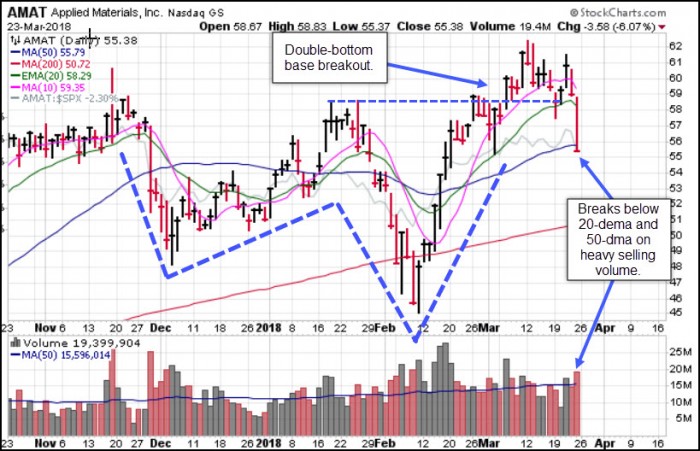
Applied Materials (AMAT) remains on the list primarily because it has not yet technically violated its 50-dma, but the reality is that the stock has already failed on a prior double-bottom base breakout, as the chart shows. This now brings the stock into play as a possible late-stage failed-base (LSFB) short-sale target. The breach of the prior breakout point and the 20-dema on Friday was the initial sign of failure, and the close below the 50-dma now likely confirms the stock as an LSFB short-sale set-up. Any rallies back up into the 20-dema would provide lower-risk entries on the short side.
Focus List Names that have breached their 20-dema have triggered our own initial selling guides, while those that have breached their 50-dma are now in danger of technically violating the 50-dma, which would be a maximum downside selling guide. This is the current breakdown by stock, no pun intended:
Stocks breaking their 20-dema: AMZN, NFLX, SQ, and TEAM.
Stocks breaking their 50-dma: AMAT, BB and NVDA.
Stocks still holding above their 20-dema: BZUN, FTNT, and LITE.
Generally, we will use the 20-dema as our initial selling guide, with the idea of having cash in hand and the flexibility of re-entering a stock if it can show support lower in the pattern, normally at or near the 50-dma. We also like to watch for undercut & rally (U&R) long set-ups that may occur in conjunction with a similar low in the indexes, should that occur. The daily chart of NFLX helps to illustrate the concept. Should the stock continue lower to test the 50-dma, it may, in the process, undercut two prior lows in the pattern that are near or around the 50-dma. If NFLX undercuts either of these lows in a test of the 50-dma and then rallies back above those lows, that could trigger a U&R long entry at that point. In this QE market, where v-shaped bottoms have been the rule rather than the exception, this sort of long set-up is quite typical and something to be aware of. There is no guarantee that they will work, or that the market will form another bizarre v-shaped low like it did in February, but risk can be managed very tightly by simply using the undercut low as a selling guide after the stock has rallied back above that low.
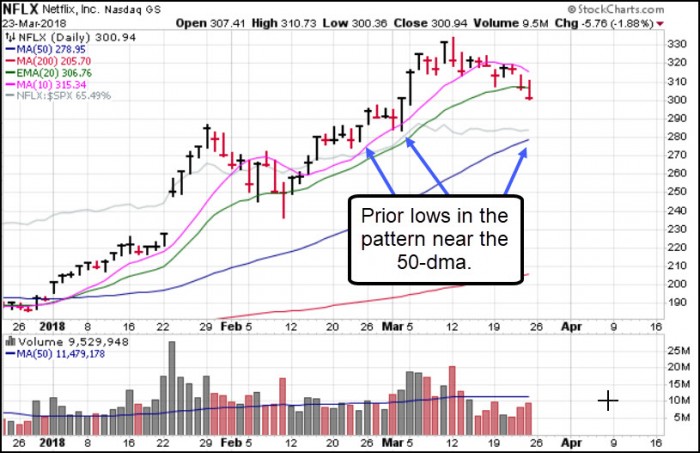
As an example, let's assume that NFLX trades down to its 50-dma and in the process undercuts the March 2nd low at 283.23, then rallies back up through that low. At that point the U&R long entry is triggered using that same 283.23 low as a selling guide. One can use the precise low as a stop, or allow for 1-3% additional downside porosity. The U&R long set-up is a derivative of "Wyckoff's Spring," and is also illustrated by the chart of AMAT, above. If you study this chart carefully, you will see that in early February AMAT undercut an early December 2017 low and then rallied back above that low. At that precise point, a U&R long entry was triggered as the market was also engaged in its own U&R move off the lows. Notice how that U&R long entry worked quite well for AMAT, and in fact produced the best upside gain relative to the rote, simplistic O'Neil-style method of waiting for the double-bottom breakout way up in the 60 price area relative to where the U&R long set-up was triggered at 48.16. This is an essential reality of the QE market. Those who bought the AMAT breakout in strict CANSLIM style are now losing money. Those who bought the U&R set-up at 48.16, or even the bottom-fishing pocket pivot at the 50-dma on February 15th for which we issued a Pocket Pivot Report at that time, are still ahead of the game. Therefore, from a practical standpoint, it has paid to remain alert to such opportunities as the market has sold off previously in this market. While there are no guarantees things will play out the same this time around as the market sells off, one should at least maintain an open mind when it comes to these types of set-ups.