
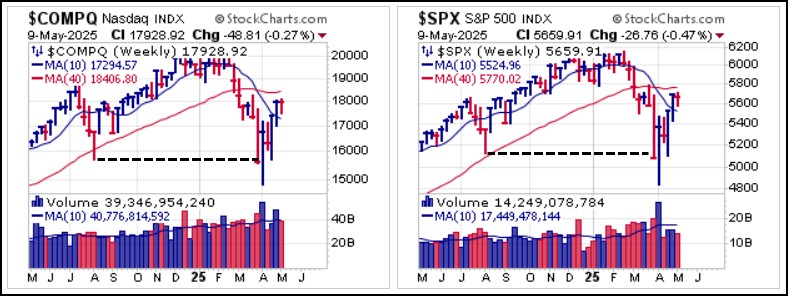
Weekly charts of the NASDAQ Composite and S&P 500 Indexes reveal sharp v-shaped rallies off the early April lows. Those lows occurred as the indexes undercut and then rallied back above their August 2024 lows in what so far mostly has the look of a bear market rally. However, that is more accurately determined in hindsight and it becomes more a matter of what individual stocks are doing. Like the indexes, most individual stocks are in V-shaped rallies off their early April lows with new high base breakouts almost non-existent.
 Weekly charts of key sector ETFs in Materials, Financials, Industrials, Technology, Mining & Metals, and Retail reveal weekly charts that are mostly identical to those of the major market indexes. This makes sense since the market sold off hard when Trump announced a smorgasbord of tariffs on the so-called Liberation Day on April 2nd, but quickly reversed course when Trump declared a 90-day tariff delay. In essence, the market has been led around by the nose courtesy of the tariff-related news flow. This weekend, as the U.S. and China wrap up initial trade talks, the market will have a chance to digest where the two countries stand and discount its assessment accordingly.
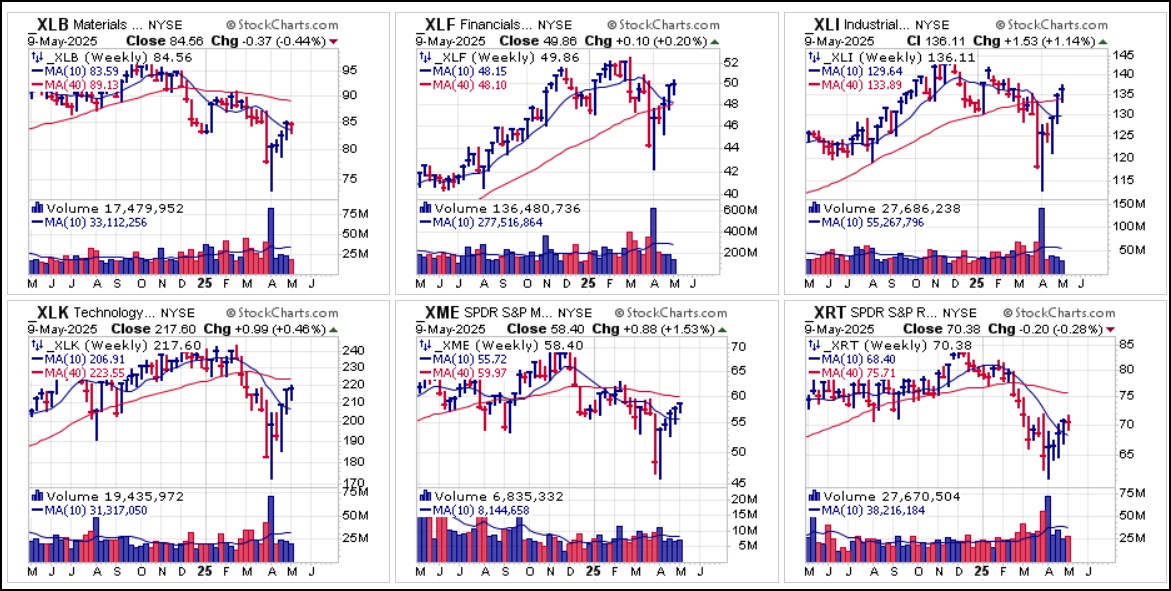
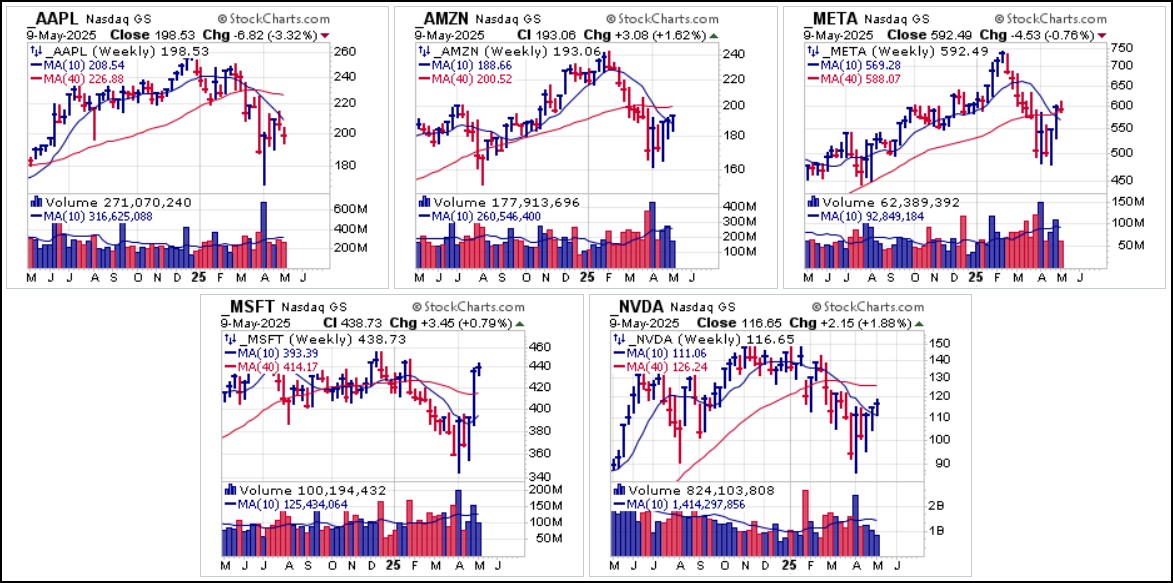
Big-stock NASDAQ names that we have reported on recently also reflect similar action on their weekly charts.
Last Wednesday we reported on the copper mining situations, the Global X Copper Miners (COPX) ETF, small Brazil-focused copper producer Ero Copper (ERO), and big-stock copper name Freeport-McMoRan (FCX). The weekly charts here certainly do not look all that appetizing.
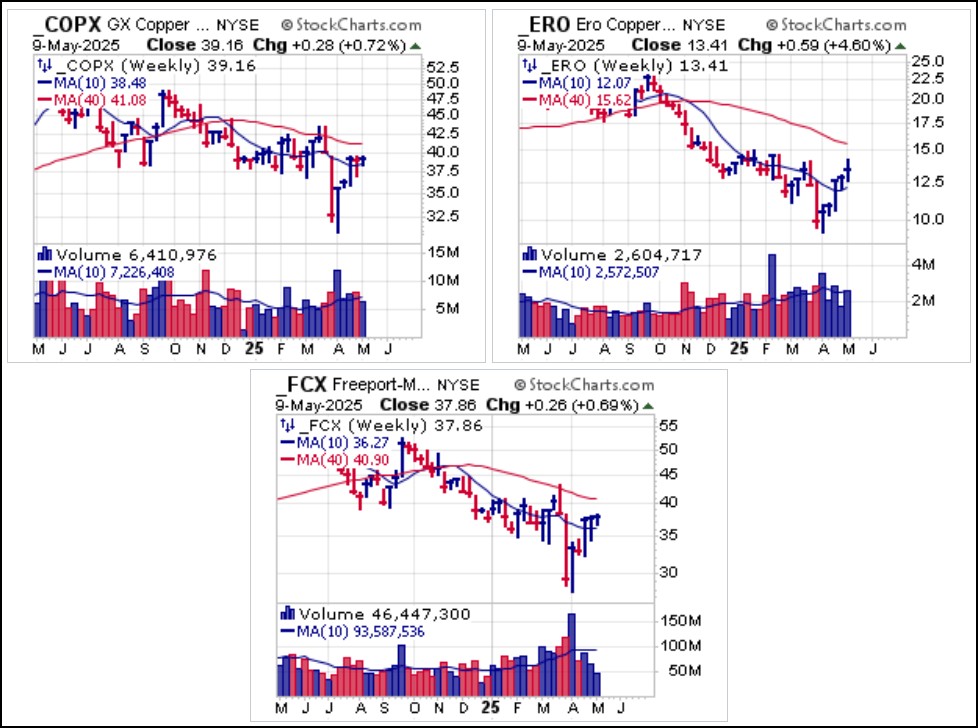 The daily charts, however, reveal a potentially more constructive look. Both COPX and FCX are showing tight action as they track sideways along their 10-dma and 50-dma with volume drying up sharply. Thus these become actionable using the 50-dma as a selling guide. ERO gapped up after earnings on Tuesday, clearing the $14.00 level on volume that was 46.5% above average which in our view is sufficient for a BGU. It then backed down as volume declined to test the 13.22 intraday low of Tuesday's BGU price range where it may present a lower-risk entry using the 13.22 BGU intraday low as a tight selling guide.
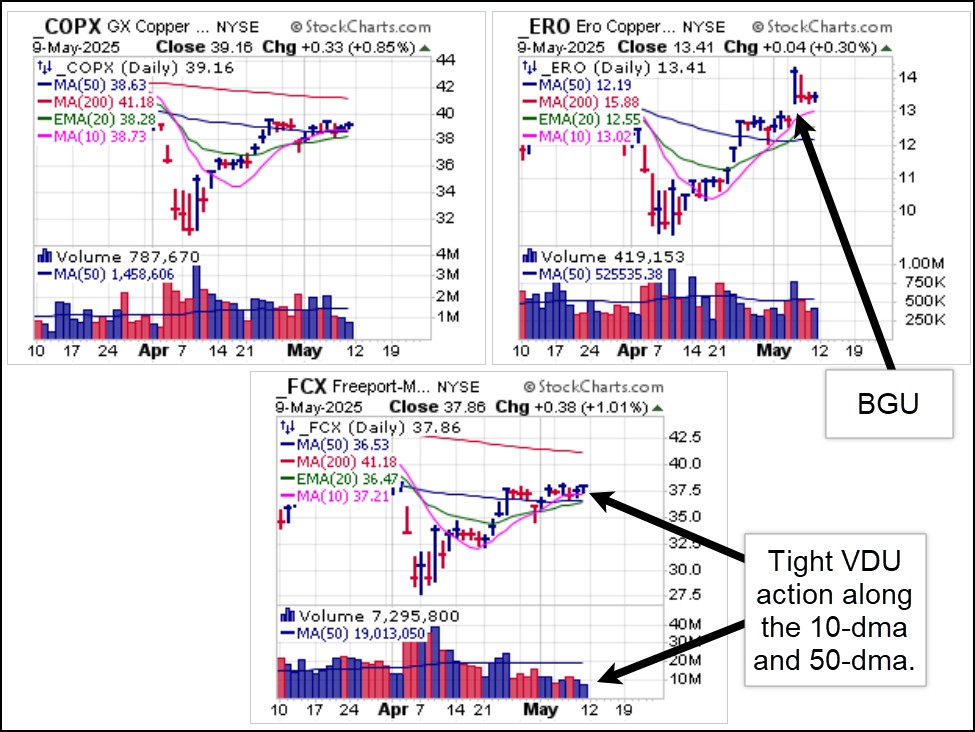 The most coherent and best-looking weekly charts belong to Bitcoin ($BTCUSD) and Gold as both fulfill their roles as alternative currencies. Gold is now basing in a short flag formation after a parabolic run to an all-time high of $3,509/oz. while $BTCUSD is starting to sync up as it approaches the highs of a 15-week base following a failed breakout in January.
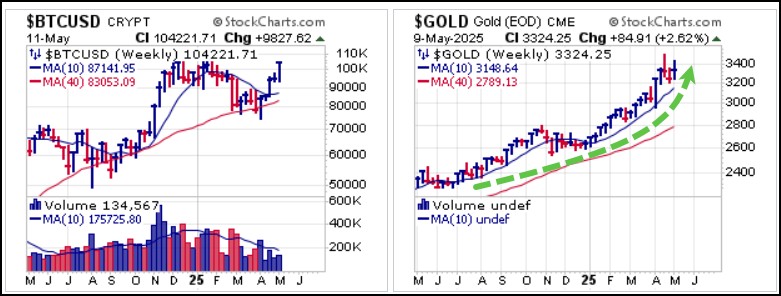 Crypto miners that we reported on two weeks ago are attempting to come up off recent lows but are lagging stocks in general, and severely lagging $BTCUSD as they remain significantly below their own all-time highs.
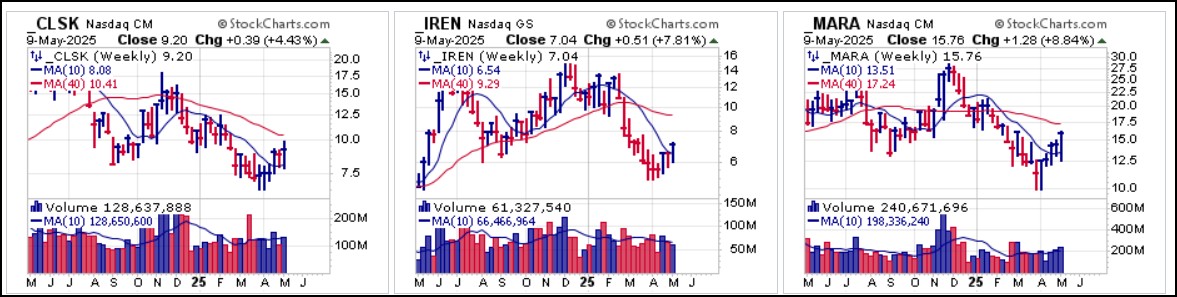
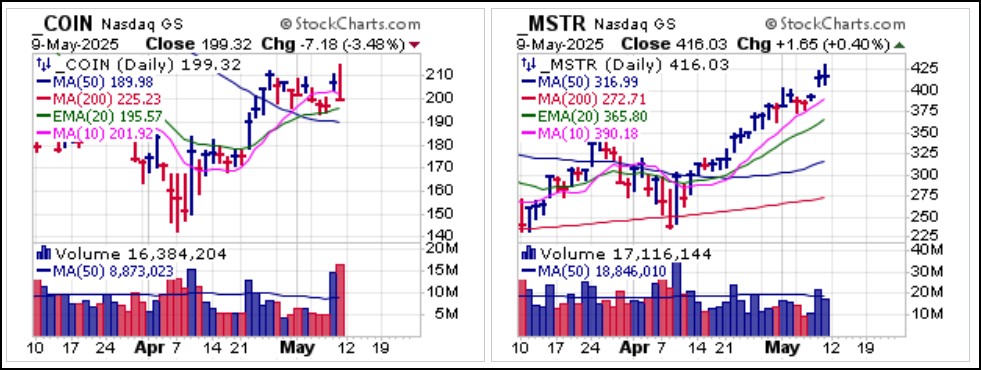
Two other crypto-related names we discussed in recent reports as long set-ups, Coinbase Holdings (COIN) and Strategy (MSTR) are going their separate ways. COIN reversed badly in a big outside reversal on Friday after reporting earnings, triggering a potential short-sale entry using the 10-dma as a covering guide. MSTR, which is essentially $BTCUSD in drag, will tend to track with King-Crypto and so is moving higher in synchrony. After gapping higher on Thursday, MSTR is currently extended from any long entry position.
 As gold remains near its all-time highs, the better miners remain in similar chart positions. We have previously reported on the biggest of the big-stock miners, Newmont Corp. (NEM), as it was coming up off recent lows and it has since moved higher. Following a gap higher in the second week of April the stock has since formed a four-week flag formation, and on Friday posted a typical VDU pullback to and long entry at 20-dema support.
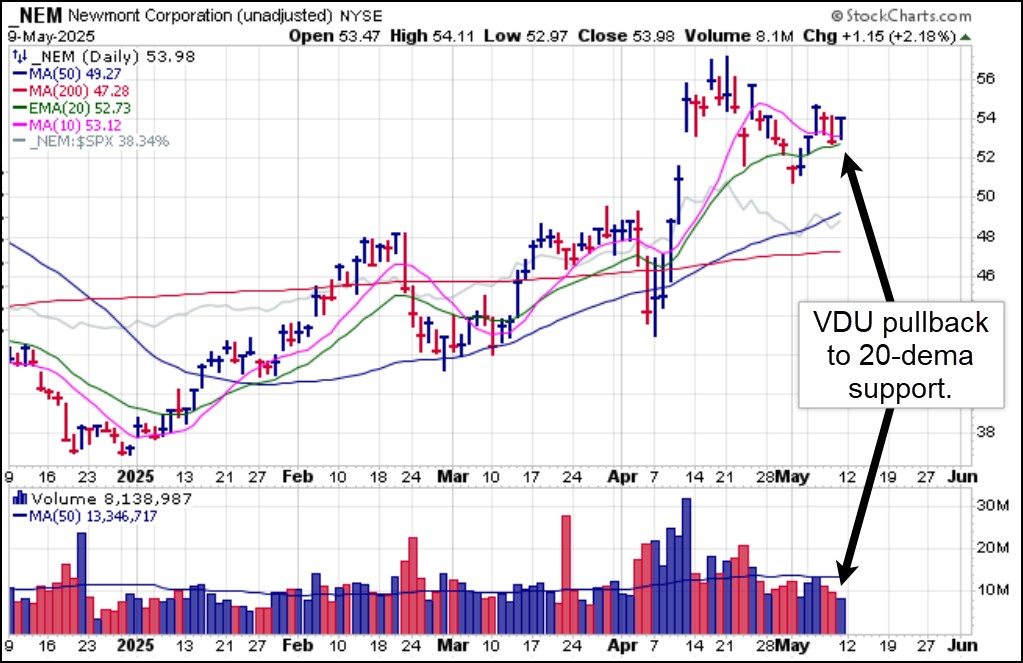 No doubt, tariff-related news will continue to factor in heavily with respect to the market action as investors assess exactly where the chips will fall, so to speak, as the trade situation resolves and settles into an ambient level of tariffs. Our view is that tariffs, even an ambient level of 10% tariffs for all and higher tariffs for the Trump-declared bad actors, will slow the economy but that will spur more quantitative easing in all its forms including lower rates. For now, the situation remains highly news-dependent and fluid. Investors should remain cautious and maintain strict risk management.
The Market Direction Model (MDM) remains on a BUY signal.