Current Focus List
The VoSI Focus List is a compilation and reference list of stocks for which Pocket Pivot or Buyable Gap-Up Reports have been issued. It is not intended as a "buy list" or a list of immediately actionable recommendations. Stocks on the list may or may not be in proper buy positions, and investors should exercise discretion and proper judgement in determining when and where stocks on the Focus List can be purchased. The following notes are intended to assist in this process. Please note that members can enlarge the Focus List image by clicking on the body of the email and then holding the Control Key while pressing the "+" key until it is large enough to read.
General Observations:
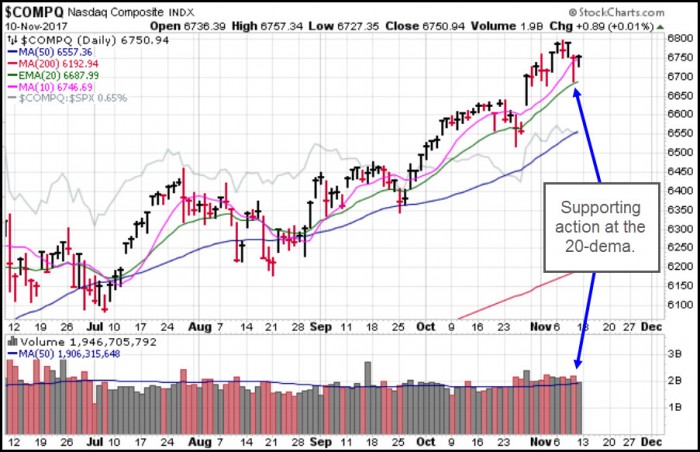
The market was hit with a gap-down sell-off at the open on Thursday, taking the Dow Jones Industrials Index down a little over 1% on an intraday basis. The Dow, along with other major market indexes like the S&P 500 and NASDAQ Composite Indexes, then rallied off its intraday lows to cut its intraday losses by more than half. The S&P and the NASDAQ both found support at their 20-day moving averages, closing near the top of their daily gap-down trading ranges. On Friday, the indexes were mostly flat as volume contracted.
Meanwhile, the NASDAQ Composite Index has rallied back up into its 10-dma, and could see more backing and filling type of action as we head into what is seen as the generally favorable holiday season. We would be careful about the rote application of such bromides, since this is not always the case. For example, last year we did see a market correction during November.
Thus far, the major market indexes remain in roughly three-week sideways ranges with intermittent new highs and closing highs showing up along the way. NYSE breadth is somewhat flat with a slight downward tilt, but NASDAQ breadth has been deteriorating steadily since early October as the index has continued to make new highs.The chart of the NASDAQ Advance-Decline Line vs. the NASDAQ Composite, below, reveals a stark divergence. This attests to the narrowness of the current rally. However, if one is positioned in the right stocks, upside opportunities continue to exist.
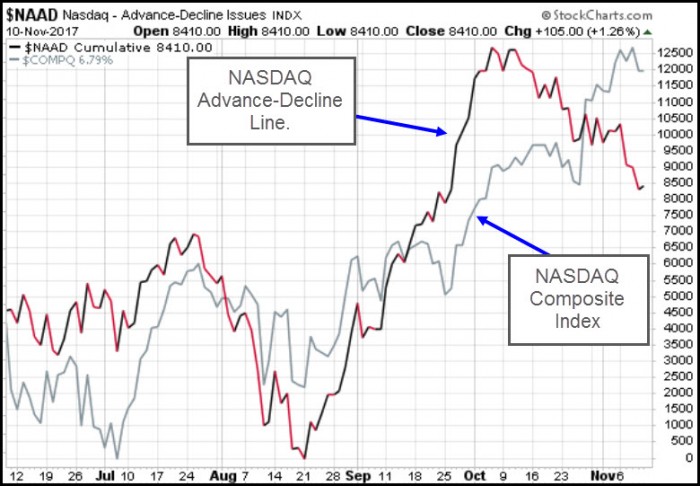
Whether this divergence is a sign of a correction to come remains to be seen, but it is something to be aware of. Falling into a trap whereby one assumes that a correction can't happen can put one in a lax mental state. In the meantime, investors merely need to abide by two basic rules: 1) only look to enter stocks on the long side on pullbacks to logical support rather than chasing extended strength, which helps to minimize risk, and 2) know where your absolute and trailing stops and selling guides are and stick to them. If the general market does get into a more severe correction, then one's selling guide should automatically force one out of the market and into higher cash levels as appropriate.
The Market Direction Model (MDM) remains on a buy signal.
Removed from the List this Week: Weight Watchers International, Inc. (WTW) after failing on a buyable gap-up attempt after earnings.
Focus List Stocks Expected to Report Earnings this Week: None.
Notable Action:
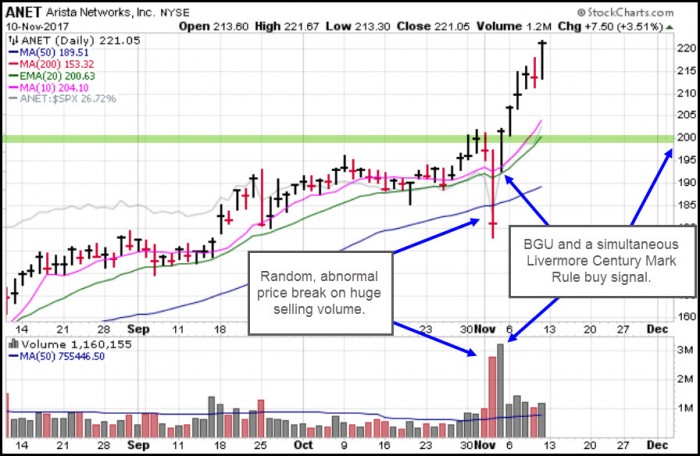
Arista Networks (ANET) is a fascinating example of how this market likes to mess with investors' heads. Heavy selling two Thursdays ago sent the stock slashing below it 50-dma on massive selling volume. That afternoon, ANET reported earnings after the close, resulting in an even larger-volume gap-up move that regained not only the 50-dma, but also the higher 20-dema and 10-dma. At that point the stock was in fact actionable as a buyable gap-up (BGU).
In addition, using Jesse Livermore's Century Mark Rule, one would have also seen a buy signal as soon as ANET crossed and closed above the $200 "Century Mark" price level. We discussed this buy signal in last weekend's Focus List Review piece. ANET then stock spent the entire week moving another 20 points, or 10%, above the $200 Century Mark.
Had one been stopped out of the stock on the big price break through the 50-dma, one could have conceivably bought the stock back some 16 points higher on the ensuing BGU to realize the move beyond the 220 price level as of Friday, helping to get back those 16 points of decline and more. Easier said than done, perhaps, but illustrative of how this market forces investors to be enterprising, nimble, and, most of all, entirely open-minded. The proper mental state would have dictated that one simply react to ANET's buyable gap-up and Century Mark Rule buy as concrete buy signals, without judging them on the basis of what happened just one day before, even if they were stopped out. Strange, yes, but true! Even in non-QE markets, some of the most profitable plays were achieved by being able to rebuy the stock by psychologically overcoming the loss.
Alibaba (BABA) pulled back to support at its 20-dema on Thursday. This set up a lower-risk entry opportunity, as we discussed it in our Focus List Notes on Thursday morning. The 20-dema remains your near-term reference point for buyable pullbacks.
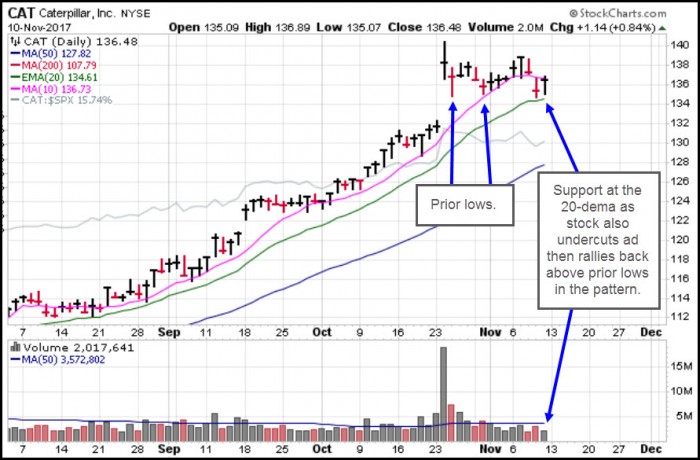
Caterpillar (CAT) is holding support at the 20-dema and the 134-35 price area. This puts it in a lower-risk entry position using the 20-dema and/or the 134 price level as a selling guide. Notice also that CAT undercut two prior lows in the pattern on Thursday, and on Friday rallied back above those lows, triggering an undercut & rally (U&R) long set-up at that point.
Facebook (FB) found support at its 20-dema on Thursday and bounced slightly up into its 10-dma. We would continue to view pullbacks to the 20-dema as your best, lower-risk entry opportunities while keeping risk tight by using the 20-dema and the top of the prior base breakout as the selling guide.
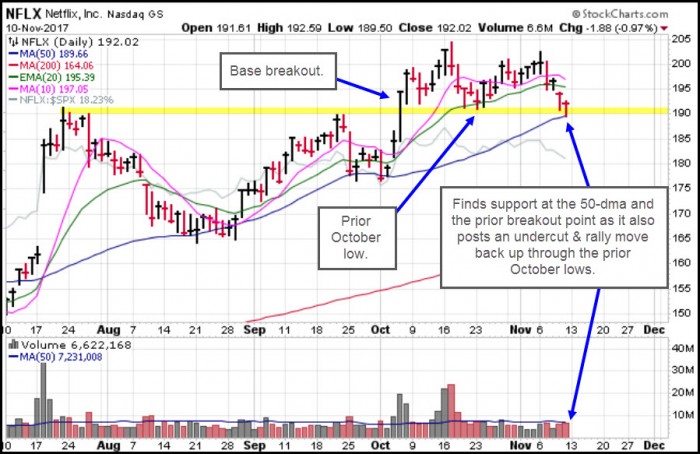
Netflix (NFLX) has breached its 20-dema, but found support Friday at its 50-dma. The question is whether the stock can hold the 50-dma as a "last stand" support level. While the initial breach of the 20-dema can often be an early sign of a possible breakout failure, the fact that NFLX held support at the 50-dma would still make it buyable here at the 50-dma, which, incidentally, also coincides with the top of the prior cup-with-handle base breakout. We would also note the fact that NFLX on Friday undercut the prior October low and then rallied back above it, triggering an undercut & rally (U&R) buy signal.
A breach of the 50-dma, however, would confirm NFLX as a late-staged failed-base (LSFB) short-sale target. We would be open to the stock resolving in either direction as it meets up with the 50-dma, and would simply react to the real-time evidence as it unfolds this coming week.
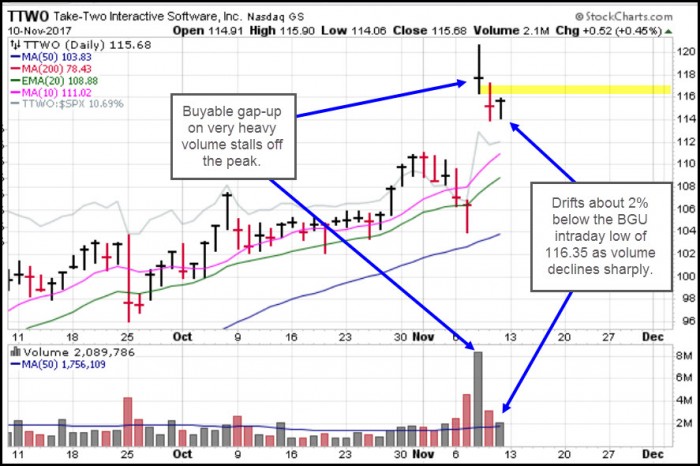
Take-Two Interactive (TTWO) has dropped below the 116.35 intraday low of Wednesday's buyable gap-up after earnings. The stock has dipped about 2% below the 116.35 level, which could be considered normal, allowable downside "porosity" below the BGU intraday low. Notice that volume dried up sharply on Friday as the stock found support near the 114 price level. This could still be treated as a BGU, with the idea of using the 114 price level as a tight selling guide. Alternatively, one could wait for the stock to push back above the 116.35 price level, triggering a type of U&R move, and then use the 116.35 level as a very tight selling guide.
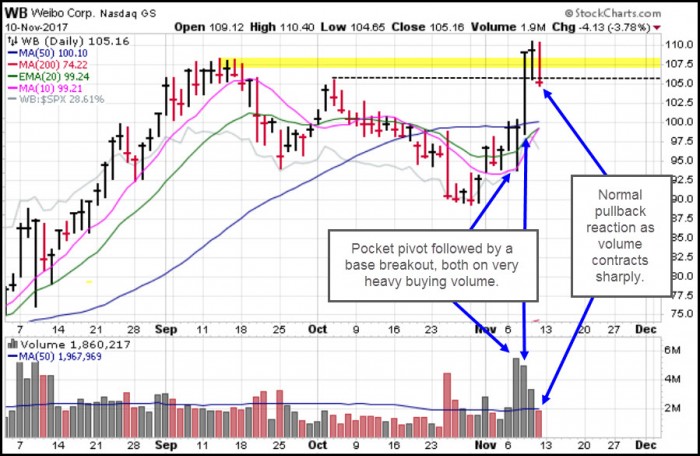
Weibo (WB) is having what appears to be a normal pullback reaction after becoming extended from its 50-dma and Tuesday's pocket pivot at the 10-dma. This is a good example of why we wouldn't be looking to buy this as a standard-issue O'Neil-style breakout. OWL methods, like Tuesday's pocket pivot, are much more efficient as long entry signals, and WB illustrates this quite well. So far, WB has retraced about 1/2 of the prior move from the 50-dma up to the 110 price level, so is entering a lower-risk entry zone.
This also has the look of a double-bottom formation, but the left side of the "W" is only two weeks in duration, which, in the "old days," was considered deficient. We find that trying to label bases as "proper" or "deficient" is a pointless game in this market environment. Notice also that if the mid-point of the "W" is considered a buy point, the stock has now moved just below this alleged "buy point" at around 105. Instead of looking at the stock in this way, we would focus on the retracement back towards the 50-dma, where the much lower pocket pivot entry occurred, as potentially setting up a lower-risk entry. Watch for volume to dry up as the stock presumably completes this pullback.