
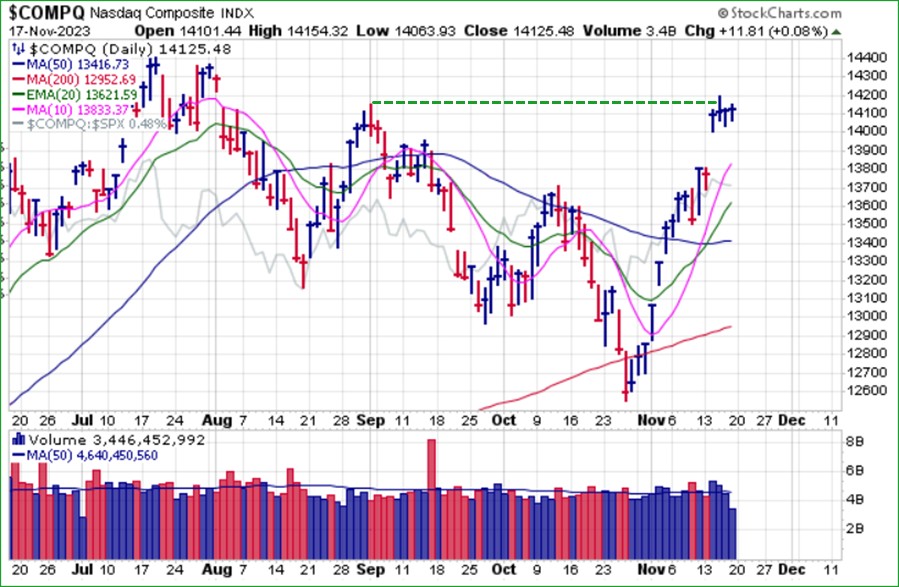
Major market indexes launched higher after lighter-than-expected Consumer Price Index (CPI) data on Wednesday. That resulted in a big-volume gap-up move to the prior September 1st high in the NASDAQ Composite Index. Near-term, the NASDAQ is running up against double-top resistance at the September 1st high as the rally off the late October lows gets quite extended. The NASDAQ is now up 14 out of 16 days in a row and wedged to higher closing highs on Friday as volume declined sharply on an options expiration day.
 Most big-stock NASDAQ names are emulating the index as they remain the primary drivers of the rally. In most cases the rallies are steady, machine-like, melt-up moves coming straight up off the late October lows. With respect to big-stock NASDAQ names, a sampling of which we show below, the action correlates in the extreme like a stock market version of synchronized swimming.
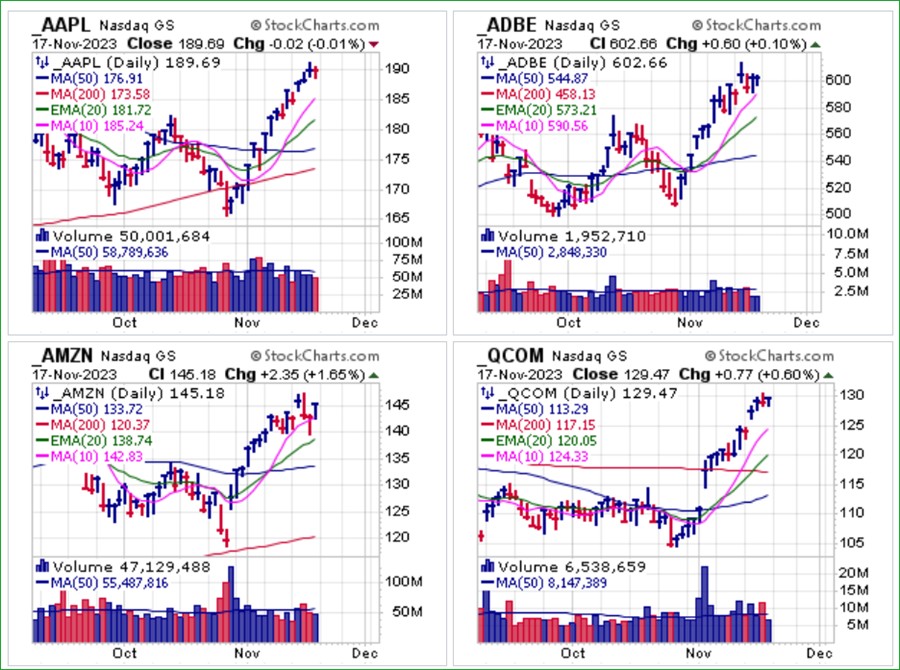 Not everything is coming up roses for big-stock NASDAQ names, however, as Cisco Systems (CSCO) demonstrates by blowing up after reporting earnings Wednesday after the close. We had previously reported on the stock as a short-sale target along the 50-day line in early October, and it was the only stock that did not stop us out during the market rally off the late October lows.
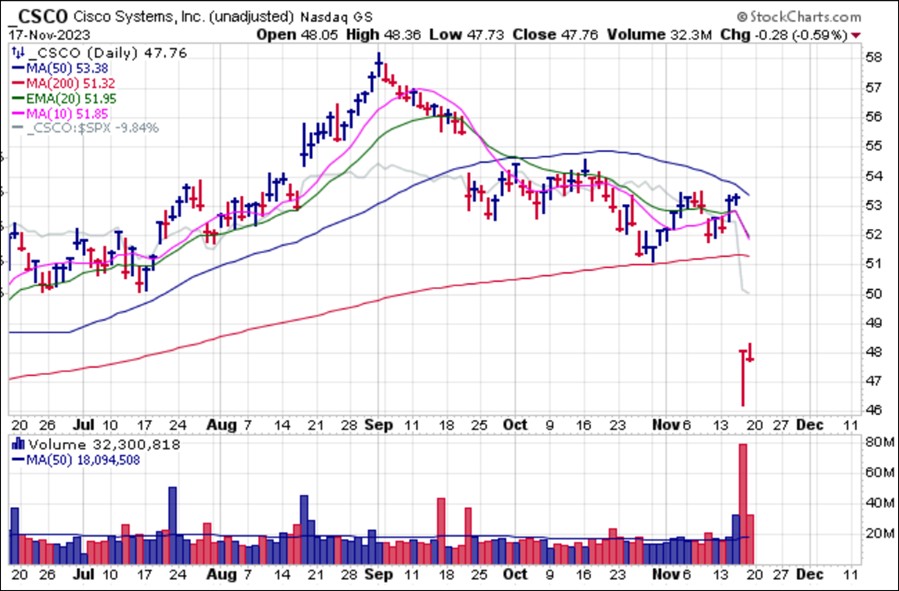 In cases where we are seeing actual breakouts among big-stock tech leaders, volume has not been spectacular, as Microsoft (MSFT) shows on its recent breakout two Fridays ago. That breakout also occurred on a move that was straight up from the bottom (SUFB) and at this stage is in fact quite extended. MSFT showed some fatigue on Friday as it sold off on heavy volume on an options expiration day.
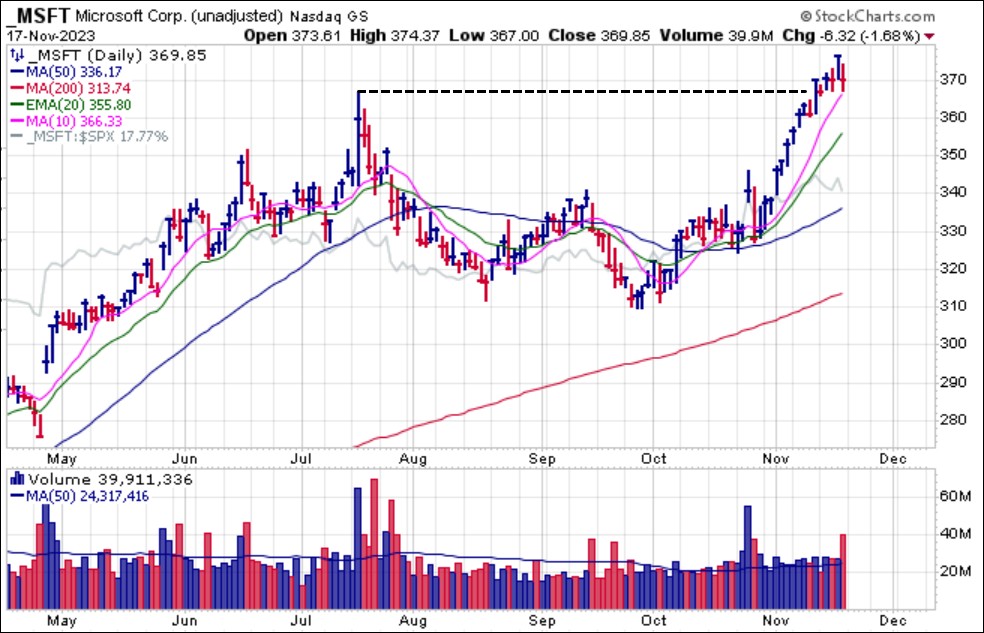 Where strong volume is seen on a breakout, such as with Broadcom (AVGO) two Fridays ago, you are still dealing with a big-stock NASDAQ name that reported a mere 8% earnings growth on an equally tepid 5% sales growth. Earnings growth over the past three quarters has steadily decelerated from 34% to 23% to 14% to the latest 8% while sales growth has decelerated from 21% to 16% to 8% to the latest 5%. Not necessarily an attractive long candidate on a fundamental basis.
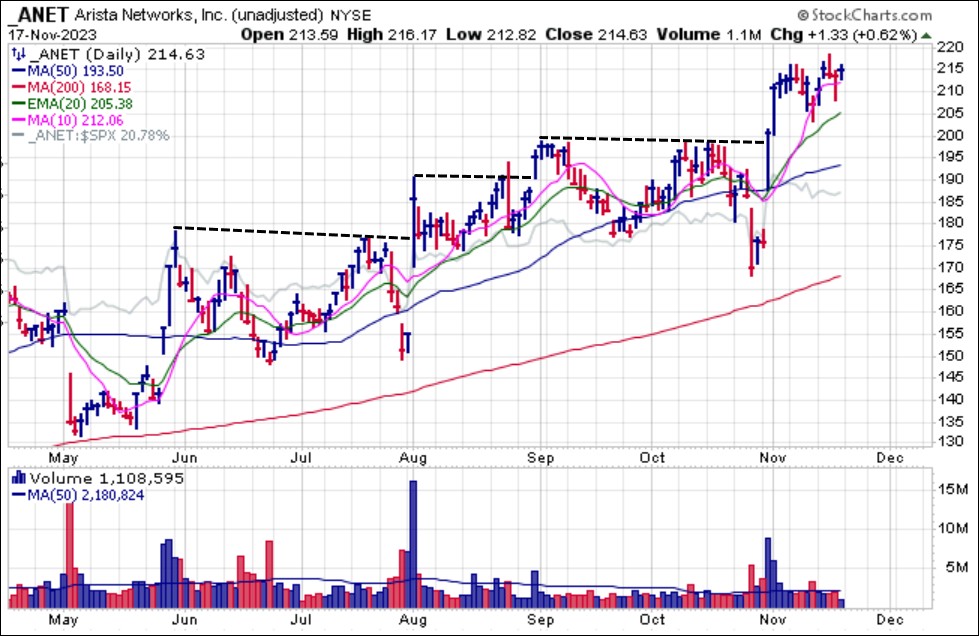
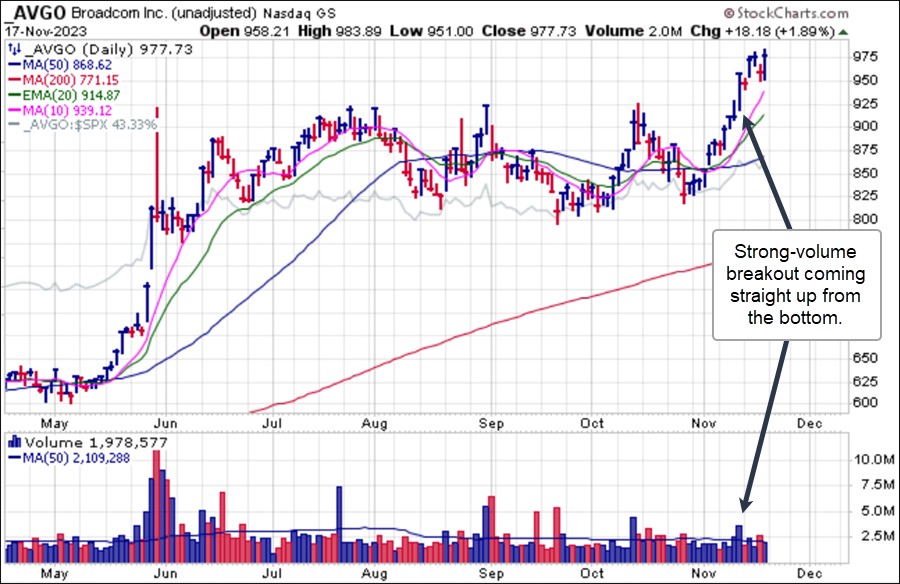 Finally, in case where decent earnings and sales growth is being seen in a recent breakout, progress beyond the breakout has been minimal, as Arista Networks (ANET) shows below. It continues to edge higher as volume dries up sharply. The stock's breakout on August 1st served as a blueprint for its latest breakout - a big-volume gap-down break that appears indicative of further downside to come before the stock immediately finds its feet and then gaps straight up off the bottom to post a new high breakout.
Normally, one would not be blamed for being reticent about buying such a breakout that occurs in such stark SUFB fashion. Prior breakouts in the stock have gone up before backing and filling to the point of origination, so it remains to be seen how this one plays out.
 Active money managers are now 72.06 net long the market according to the latest results of the National Association of Active Investment Managers Exposure Survey. This remains below prior extreme peaks over the past two years and well below the net long exposure of over 100% seen at the end of July when the market peaked.
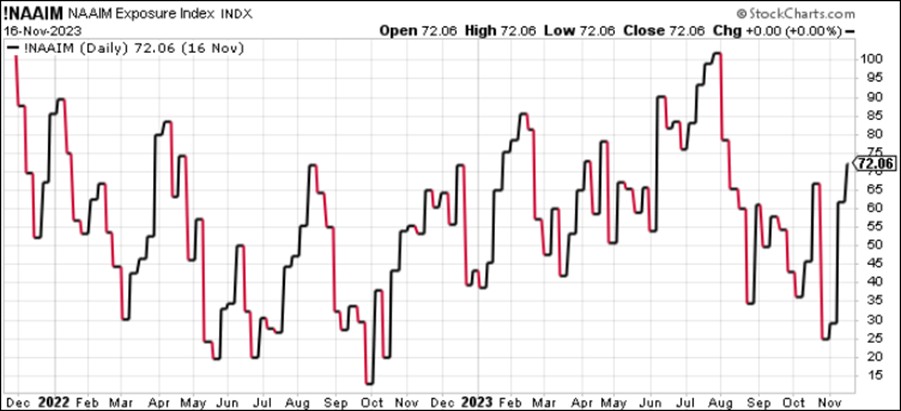
The Market Direction Model (MDM) switched to a CASH/NEUTRAL signal on Tuesday, November 14th.