
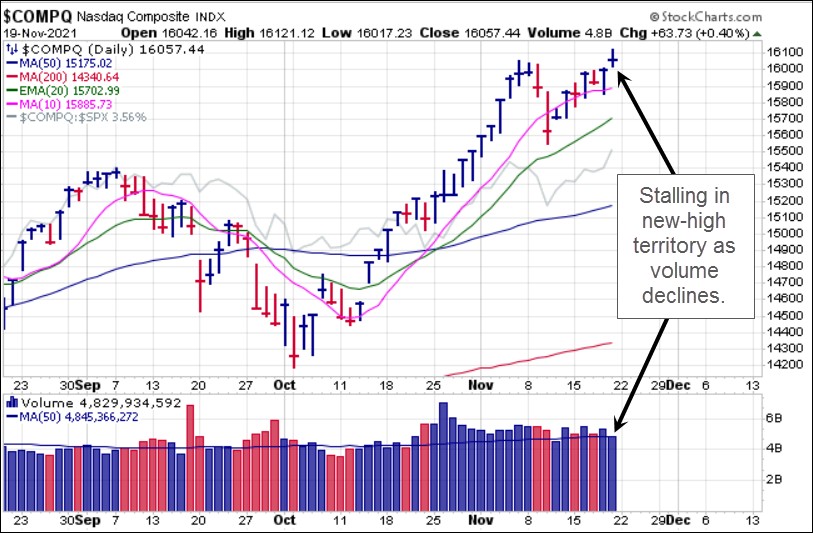
Major market indexes are at or near prior all-time highs. The NASDAQ Composite and NASDAQ 100 Indexes posted new highs on Friday but at the same time stalled on lighter volume. The S&P 500 and Dow Indexes were down on Friday on higher volume in a stark divergence that was also seen on Thursday.
 Evan as the big-three major market indexes move higher, the NASDAQ Advance-Decline line has been in a steep decline over the past two weeks.
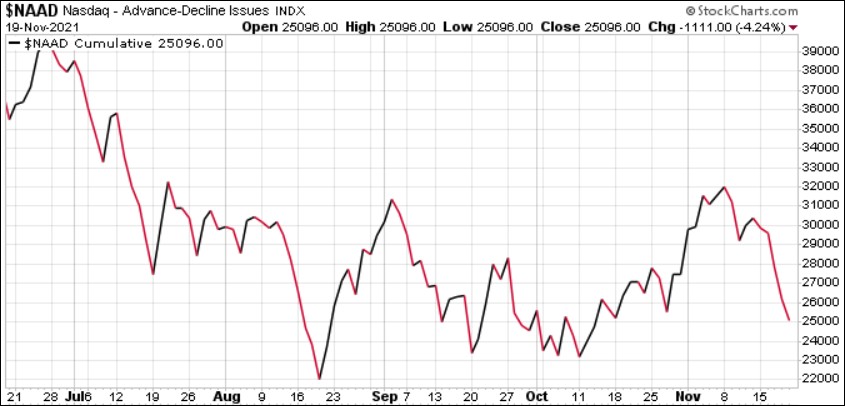 The mixed action among individual stocks under the surface is evident in the broader NYSE Composite Index and small-cap Russell 2000 Index via its proxy, the iShares Russell 2000 ETF (IWM). Both indexes have been down three days in a row and posted lower lows on heavy volume on Friday.
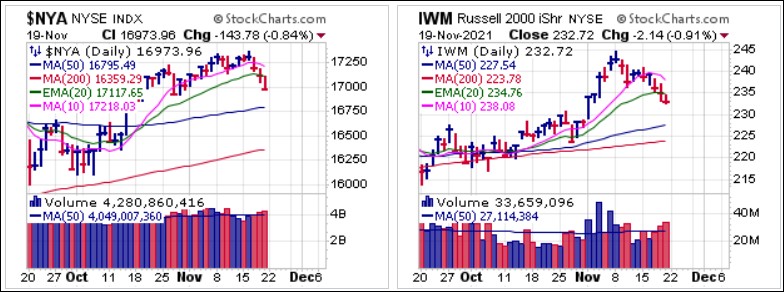 The Market Direction Model (MDM) remains on a BUY signal.
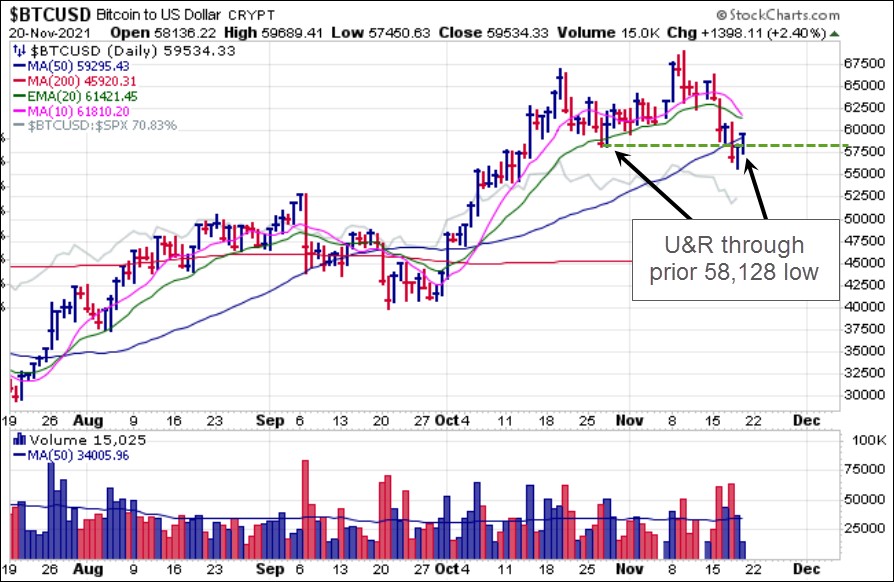
Bitcoin ($BTCUSD) has recently triggered a breakout-failure short-sale entry at the 20-day exponential moving average. That has led to a subsequent break below the 50-day line. As of Saturday afternoon, November 20th, $BTCUSD is attempting an undercut & rally (U&R) move through the prior 58,128 low. In addition, it is currently posting a moving average U&R on what is so far a shake-out at the 50-day line. These can be used as opportunistic entries where the 58,128 prior low or the 50-day line serve as selling guides. They are not guaranteed to work, but risk can be kept to a minimum based on the simple risk-parameters for this trade. A number of metrics with solid predictive track records such as whale support, SOPR, etc are showing big support at the 55,000 level and bottoming indications below 57,000, thus the recent bounce. Many crypto traders follows these as they are transparent on the blockchain so prophecy becomes reality much as the 50-dma and other popular indicators are heavily used by traders in stocks.
 The weekly chart of $BTCUSD also reveals that the current pullback has been contained to the 10-week moving average and the top of the prior large punchbowl-like cup formation.
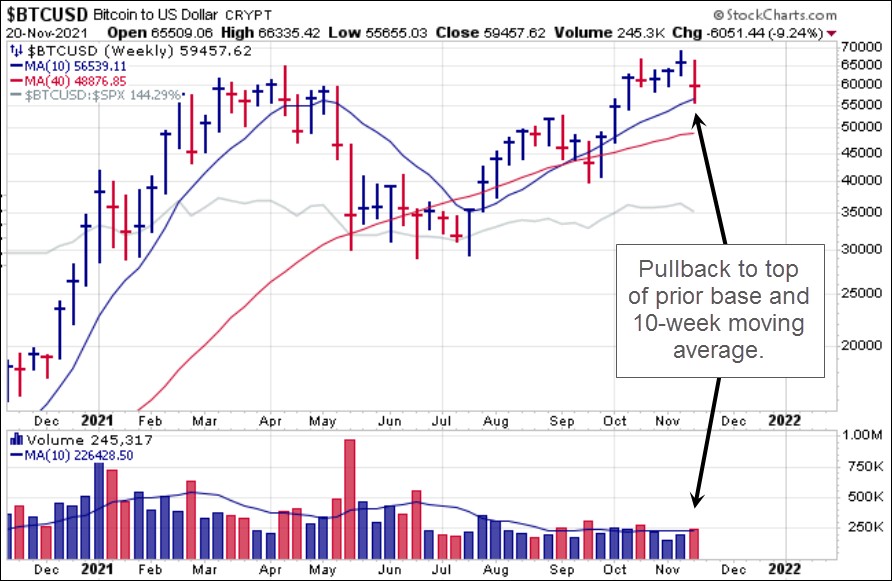 The weekly chart of Ethereum ($ETHUSD) also reveals a well-contained pullback to the top of its own prior base and 10-week moving average. It has posted a moving average U&R at the 50-day line which serves as a long entry using the 50-dma as a selling guide.
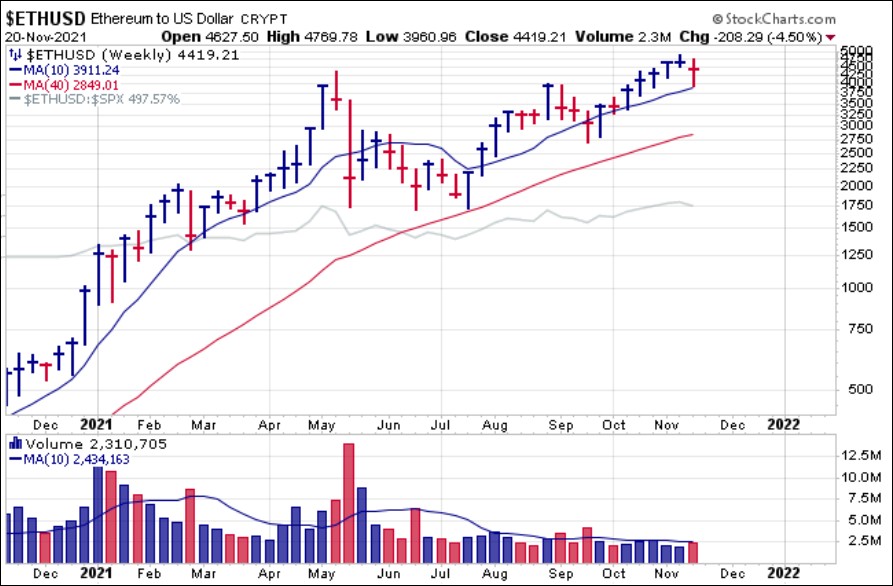 While Bitcoin miners like Marathon Technology (MARA) and Riot Blockchain (RIOT) have been hit hard over the past week, keep in mind that all miners correlate heavily to the price of bitcoin. They all tend to outperform bitcoin during uptrends and underperform during downtrends, so if you invest in any of these mining stocks, keep this in mind. We also note that non-miners that exist more in the De-Fi space are holding up much better, but they too correlate to the market value of the cryptospace. Coinbase Global (COIN) tends to correlate closely to the price of Bitcoin but COIN is entering various facets of crypto including NFTs and currently remains above its 20-day exponential moving average as volume declines. Volume dried up on Friday which puts this in a lower-risk entry/add position, although we would be very alert to any breaks below the 20-dema as a quick sell signal for any portion of a position purchased at these levels.
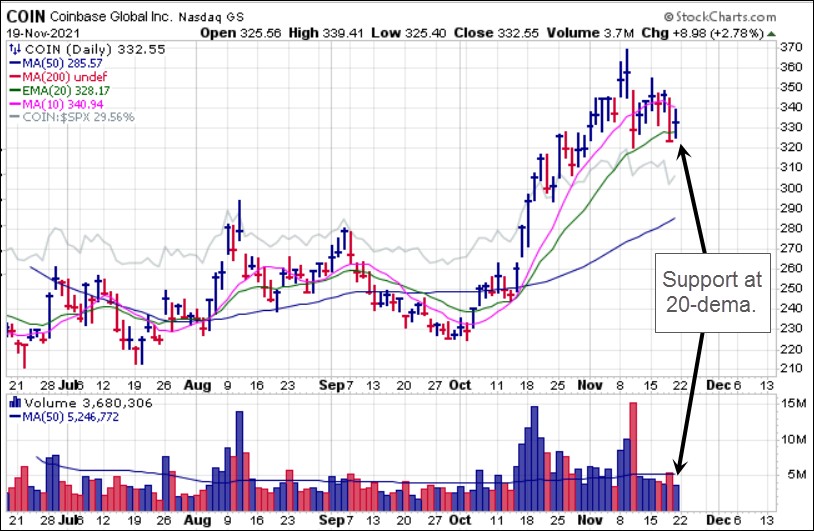 Silvergate Capital (SI) is another crypto-related De-FI name like COIN which is also holding up well as it pulled into its 20-dema on Thursday as volume dried up to -54.6% below average, essentially a voodoo pullback to the 20-day line. It then posted a strong-volume pocket pivot at the 20-dema on Friday and is now extended as it approaches its prior high above $230.
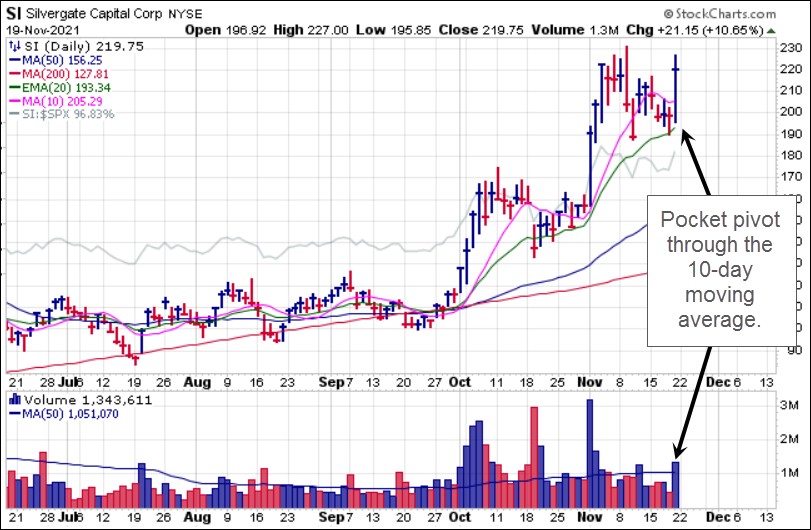 Uranium producer Cameco (CCJ) appeared to be in a potential long entry position on Thursday as it pulled into its 20-day exponential moving average as volume dried up to -53% below average. That voodoo pullback did not hold up on Friday, however, and CCJ triggered a short-sale entry at the 20-dema as it busted the line, which currently serves as a selling guide for CCJ shares purchases above the 20-day line. It appears to be headed for a test of the 50-day line.
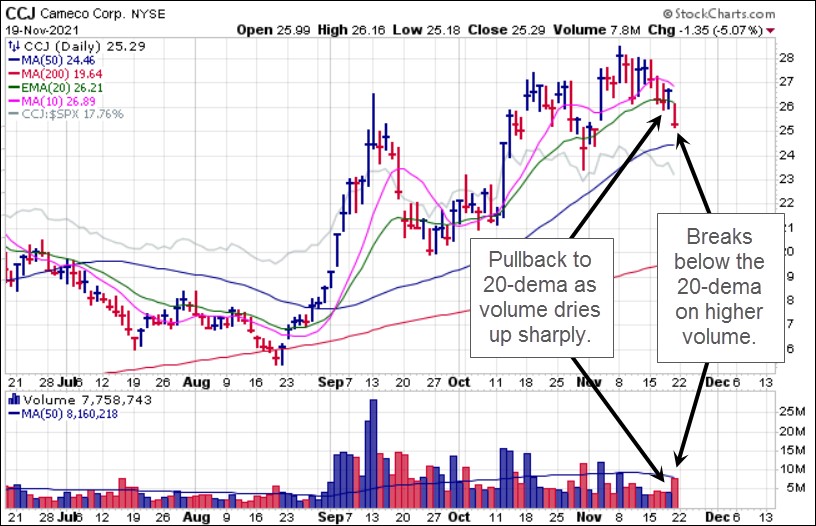 Current divergences in the market as the NASDAQ Composite and S&P 500 Indexes push up to or into new-high price territory while the broader market languishes may be flashing a cautionary sign. While this time of the year is often referred to as "seasonally favorable," the historical reality is that we have seen many sell-offs in late November/early December that then drift back to the upside as we head into New Year's Eve in typical Santa Claus Rally style. In fact, underneath the surface, we have seen a number of individual stocks and groups break down sharply this past week, including airlines, financials, energy, payments, industrials, etc., so it is clear that many areas of the market are not experiencing any "seasonally favorable" price action currently. For this reason, we would avoid making any assumptions as to how the final six weeks of 2021 will play out.