
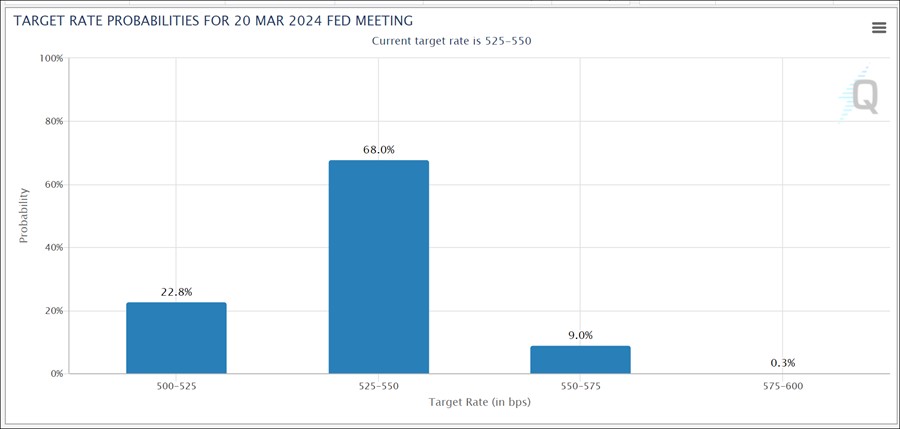
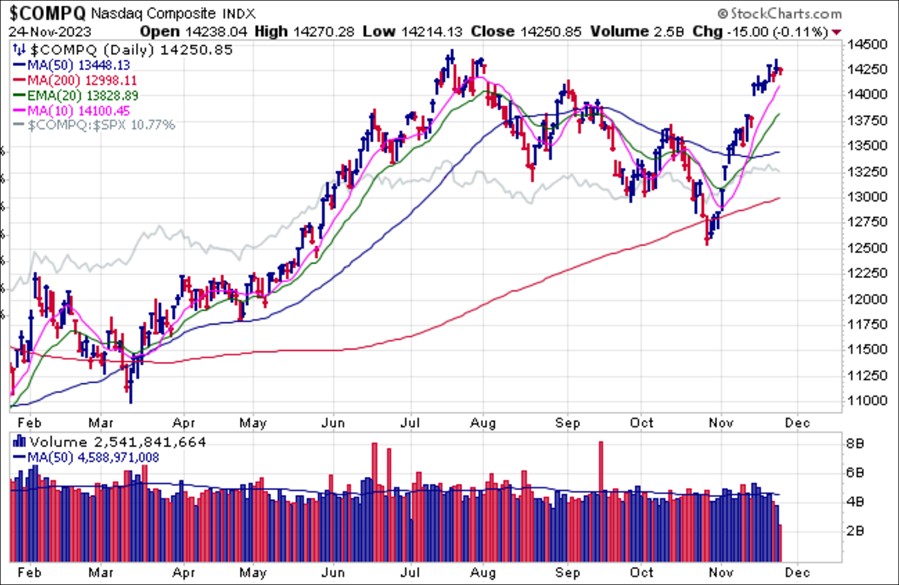
In just one month the NASDAQ Composite has mostly retraced the prior three-month, three-wave decline off the late July peak on what remain hopes that the Fed will soon be lowering rates in 2024. Currently, the CME FedWatch Tool shows a 22.8% probability of a quarter-point rate cut in March as a consensus of lower sooner begins to build. This is, however, lower than the 25% seen earlier in the week.
Meanwhile, the Chicago Fed's weekly National Financial Conditions Index (NFCI), which is based on 105 measures of financial activity to track conditions in money markets, debt markets, equity markets, the banking system, and the “shadow” banking system, showed further loosening for the week ending November 17th with the index value falling to -0.47, the lowest since February 2022 when rates were still hanging around the zero boundary, before the Fed began raising rates at the fastest rate in history.
As the NASDAQ now tests the prior 2023 highs of late July, up 16 out of the last 20 days in a row, it could be argued that the market is simply too far extended on the upside as everyone piles onto the bullish side of the boat. The latest National Association of Active Investment Managers (NAAIM) Exposure Survey now shows active managers with a net long exposure of 77.95% as they rapidly move into the market following a 24.82% net long exposure, the lowest in a year, just four short weeks ago. Otherwise, expect to hear the crowd call for a Santa Claus Rally as we move into December.
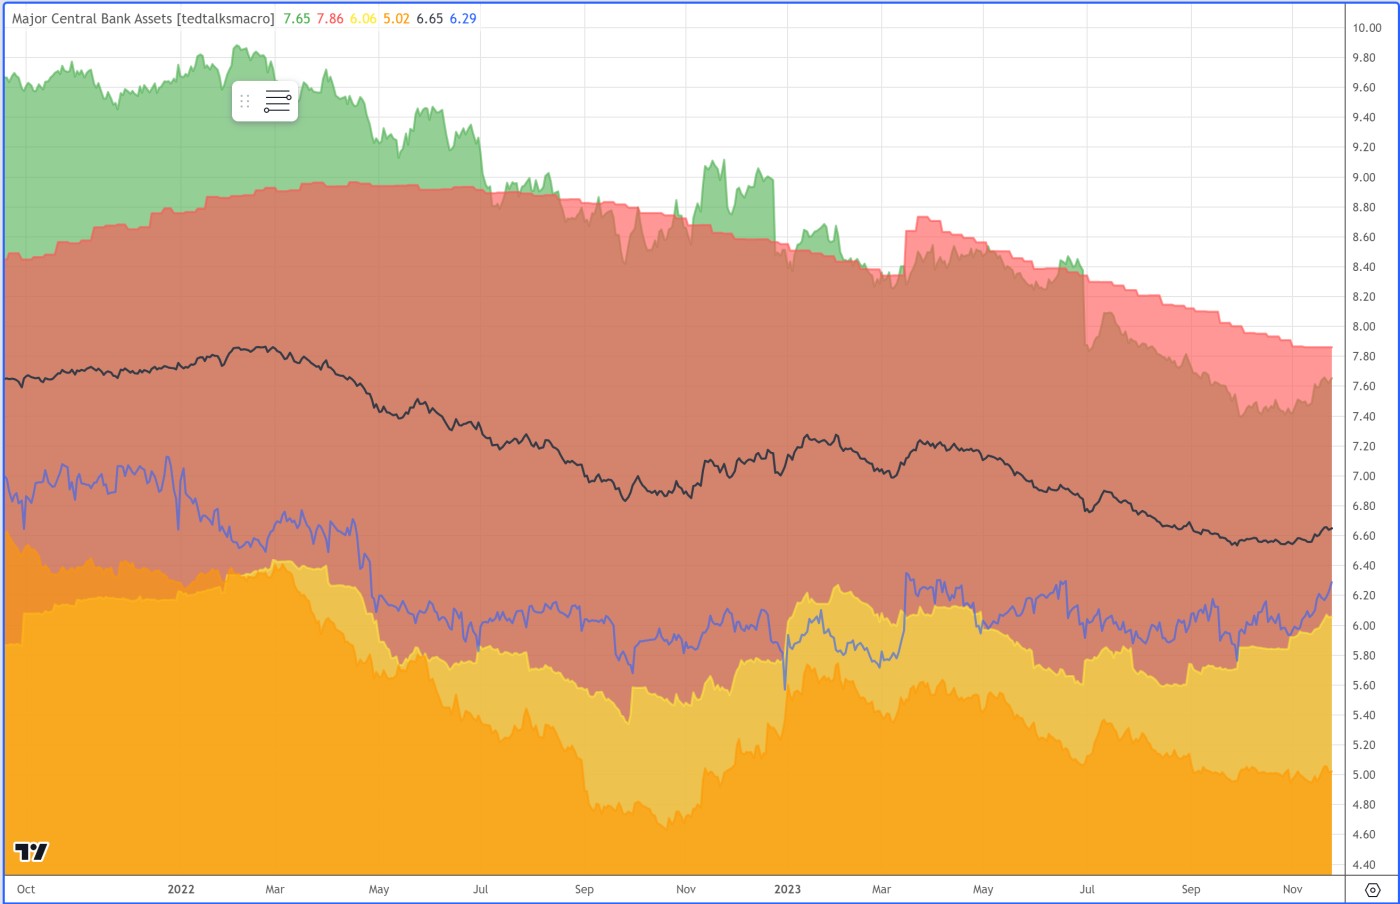
With financial conditions still loose, and in fact as the Chicago Fed measures them, even looser than they were before the Fed began raising rates in March of 2022, it is difficult to say whether the Fed may consider that higher-for-longer must remain its policy. But the market has made a game of fighting the Fed all year long, despite the old adage that one should never do exactly that. AI-meme stocks have been the main driving force which has created the most bifurcated market environment in decades where the broader market as measured by the NYSE Composite has stagnated all year while AI-heavier indices such as the NASDAQ Composite and S&P 500 have well outperformed. We also have as of late more stealth liquidity as measured by boosts observed in the US and abroad. The black line represents the collective total of liquidity from all major central banks. It was heading lower until October when it trended sideways then more recently has been in an uptrend. This also occurred from September 2022 to early 2023 which resulted in a major market rally at the start of 2023.
It is not difficult to see what the rapid one-month run-up in the major market indexes has been all about - the falling dollar. The daily chart of the Invesco DB US Dollar Index Bullish Fund (UUP) shows a sharp decline that began at the same time the market began to rally in late October.
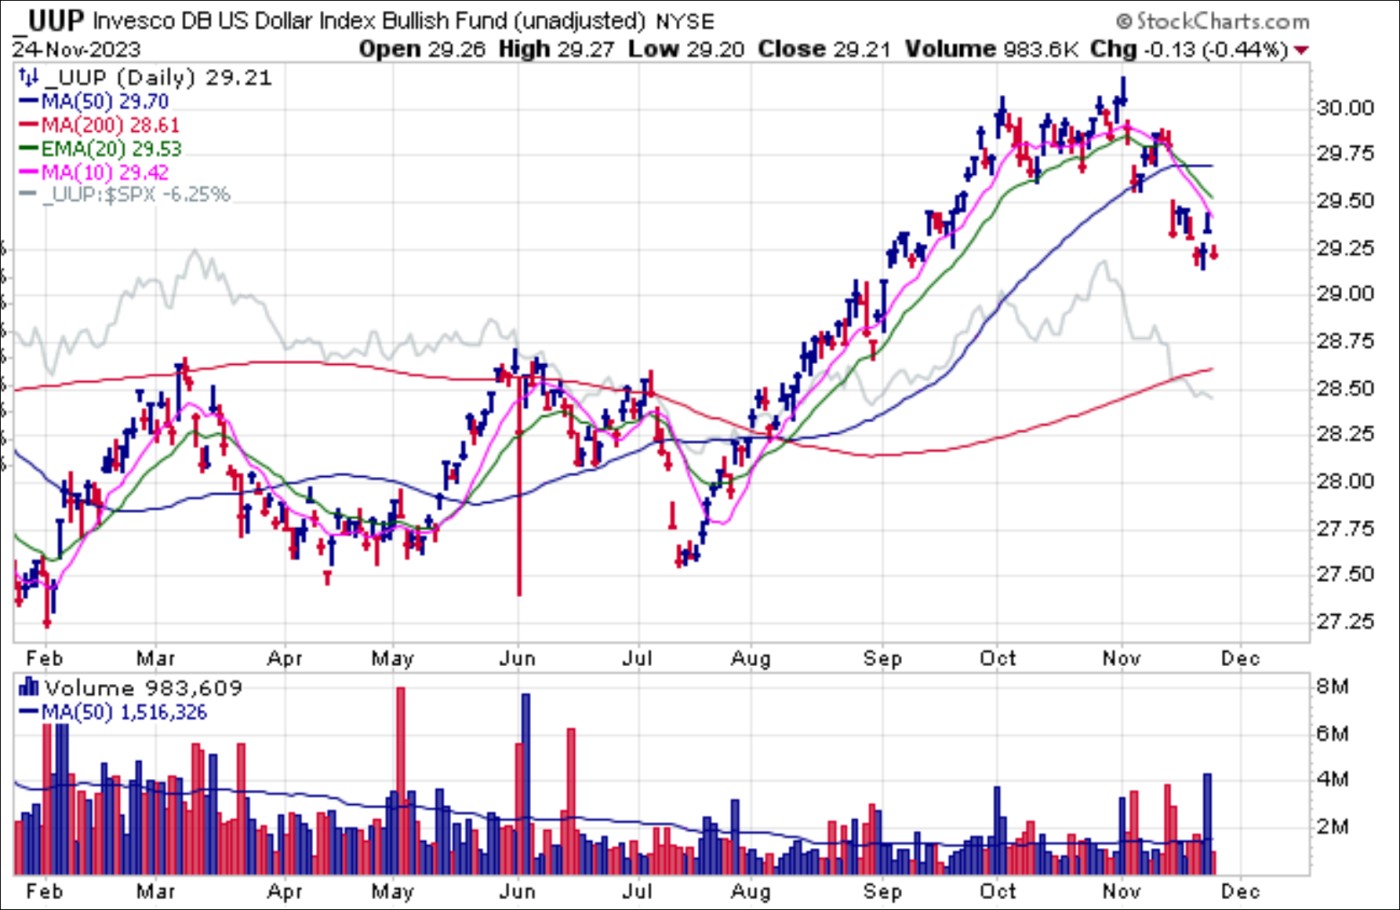
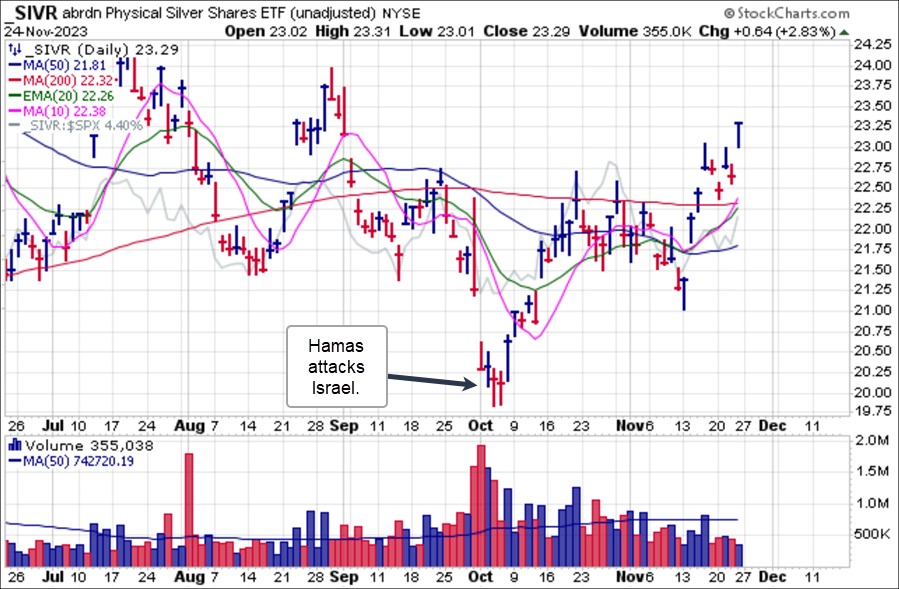
Precious metals have continued to rally as the dollar continues to fall. Silver has taken the lead by pushing to higher highs this past week, leading to a Friday gap-up move in the Aberdeen Silver Trust (SIVR). Note that the rally in precious metals, both gold and silver, began after the terrorist attacks in Israel and gathered further impetus from the dollar's steep decline in November. Silver appears set to test the late August highs at $24.00 which would likely coincide with the dollar as represented by the UUP above testing its 200-dma.
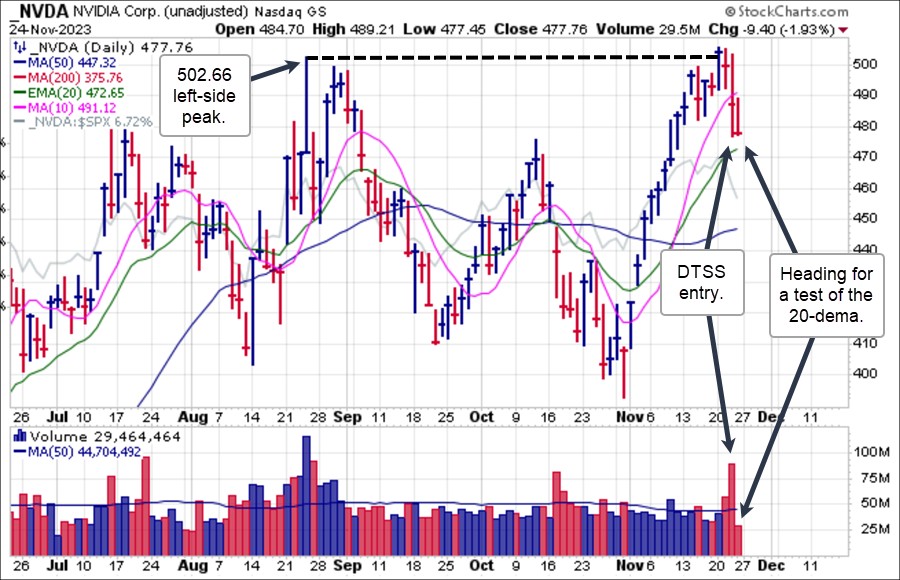
The major event of the week was earnings from Nvidia (NVDA) on Tuesday after the close. While the company blew out estimates it was quite obviously already priced in as the stock triggered both a Livermore Century Mark Short at the $500 level on Wednesday as well as a clean double-top short-sale (DTSS) entry at the $502.66 left-side peak in the pattern. NVDA now appears set for a test of the 20-dema where a break below the line would trigger a third short-sale entry. If the stock can hold support at the line then it could also present an interesting long entry spot using the 20-dema as a tight selling guide.
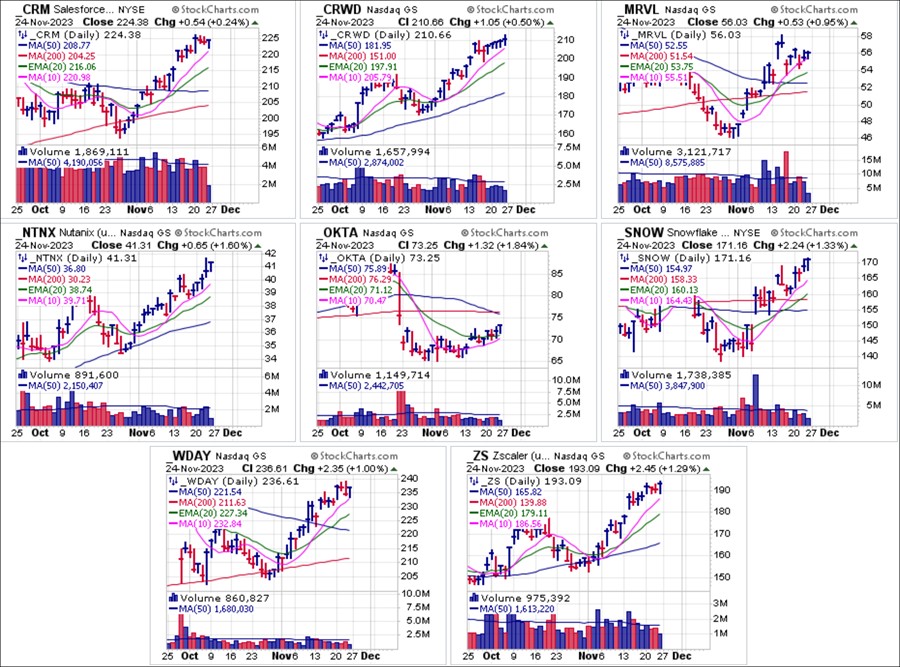
This week may be notable for a number of key earnings reports from tech and AI meme names that have led the market rally off the late October lows. On Monday after the close we are expecting earnings from cyber-security name ZScaler (ZS). CrowdStrike (CRWD) and Okta (OKTA) are both expected to report Tuesday after the close along with clouds Snowflake (SNOW) and Workday (WDAY). Marvell Technology (MRVL) will report on Thursday after the close. With most of these stocks in extended rallies off the late October lows, earnings may provide the proof in the pudding that justifies the rapidity and extent of those rallies, making for some potential high-velocity trading opportunities for alert and nimble traders.
The Market Direction Model (MDM) remains on a CASH/NEUTRAL signal.