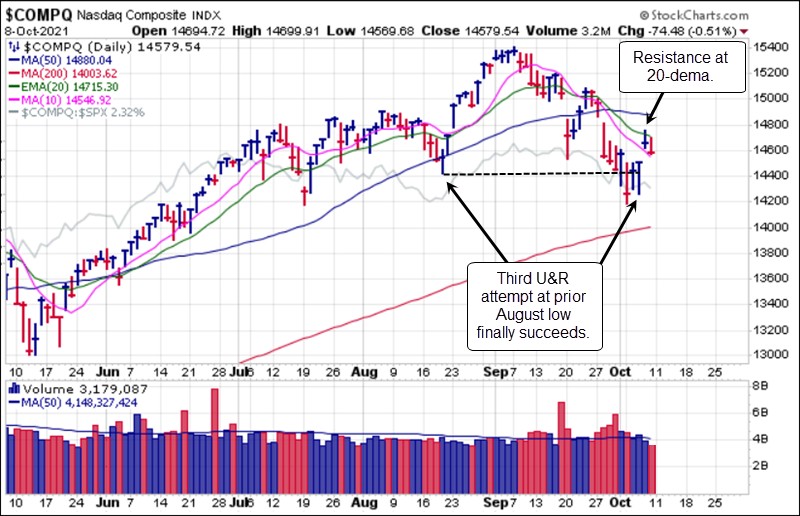
Major market averages started the week out with fresh lows in the NASDAQ Composite and S&P 500 Indexes as the NASDAQ's undercut & rally (U&R) attempt through its prior August low two Fridays ago quickly failed. After chopping back and forth for the next two days, the indexes gapped up on Thursday in response to news of a debt-ceiling agreement between Democrats and Republicans in Congress. That rally, however, took the NASDAQ up into resistance at its 20-day exponential moving average and the S&P up into resistance near the underside of its 50-day moving average. A weak Bureau of Labor Statistic jobs report on Friday, with 194,000 new jobs tallied in September vs. expectations of 450,000 and some whisper estimates of 750,000 or more send the market in a day-long spin-cycle as it tried to assess the implications of a Fed that may be on hold. The NASDAQ Composite ended the week on a negative note as an early rally faded into the close.
 Meanwhile, the S&P 500, which had reversed from a point near its 50-day line on Thursday, tried to hold up most of the day on Friday before rolling over into the close. The chart of the S&P 500 shows that the market has tended to correct each month at or right around monthly options expiration, which for October will be next Friday.
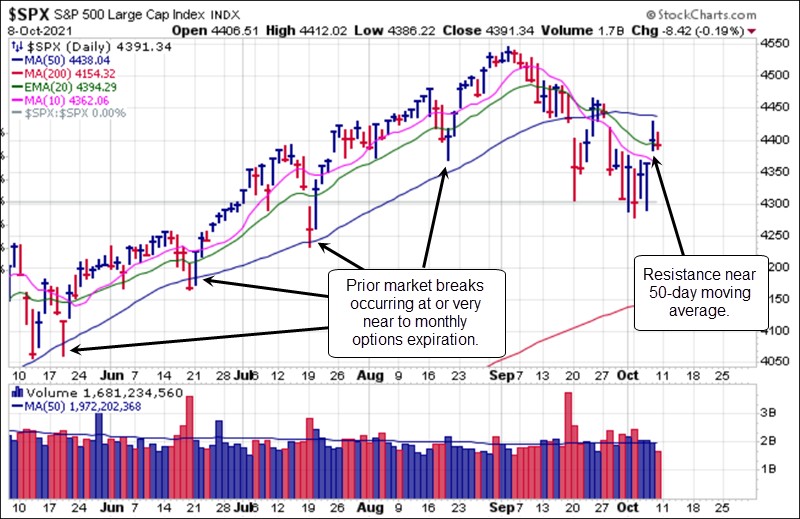 The Friday jobs report was initially seen as keeping the Fed on hold, but market rates as expressed by the 10-Year Treasury Yield ($TNX) in fact rallied early in the day as the market begins to assess whether a Fed that is on hold will fall behind the curve when it comes to addressing inflationary pressures. The $TNX ended the week at 1.605%, its highest levels since June and sixteen basis points (0.16%) below its prior 2021 high of 1.765%.
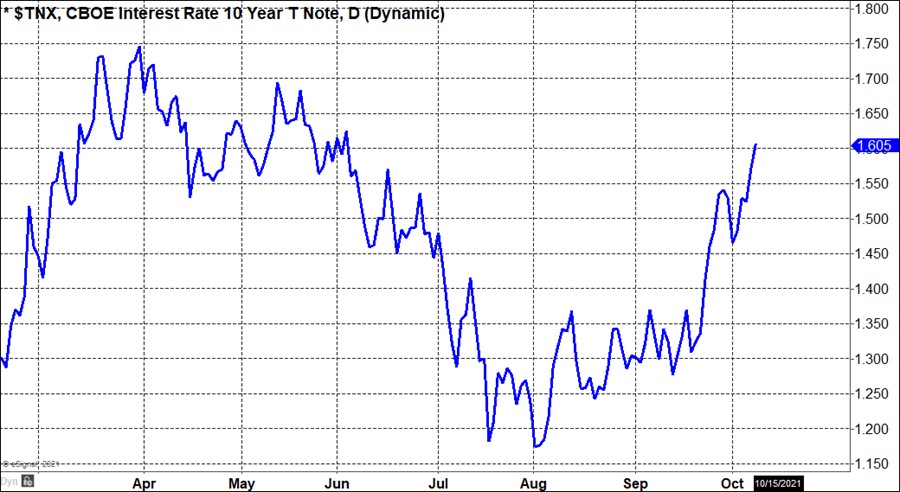
The Market Direction Model (MDM) remains on a CASH signal.
As we wrote in Short-Selling with the O'Neil Disciples: Turn to the Dark Side of Trading (John Wiley & Sons, 2015), the undercut & rally, or U&R, long set-up was originally implemented as a short-covering device. Once a short-sale target stock was down 10-20% or more from a prior short-sale entry point and undercutting key lows in the chart, an undercut and rally test of these lows would constitute a near-term short-sale cover signal. From there, the stock was allowed to rally up into moving average or price resistance where it might become shortable once again into the rally. In essence, the U&R was short-sale cover point, whereupon the "R" was allowed to bring the stock back up into a potentially re-shortable position. That's how U&Rs originally worked. In the QE market, however, given the contrarian, reversion-to-the-mean character that the market has as a result of the enormous influence of machine-driven algorithmic trading, U&Rs have worked as more permanent long entry signals.
One barometer of a potential bear market would be the reversion of U&Rs from contrarian buy signals in a perpetually rallying market back to the manner in which they were used as a short-sale covering signal (where the "U" occurs) at which point the "R" or the rally side of the equation presented a re-shorting opportunity into the price rise off the lows. With this latest round of U&Rs occurring two Fridays ago when the NASDAQ Composite had its own U&R at the prior August lows, we can get a sense as to whether these become merely shortable reflex rallies or are more in character with the way U&Rs have worked as long entry signals throughout most of the QE bull market. That in turn may provide some additional clues as to where this market is headed from here.
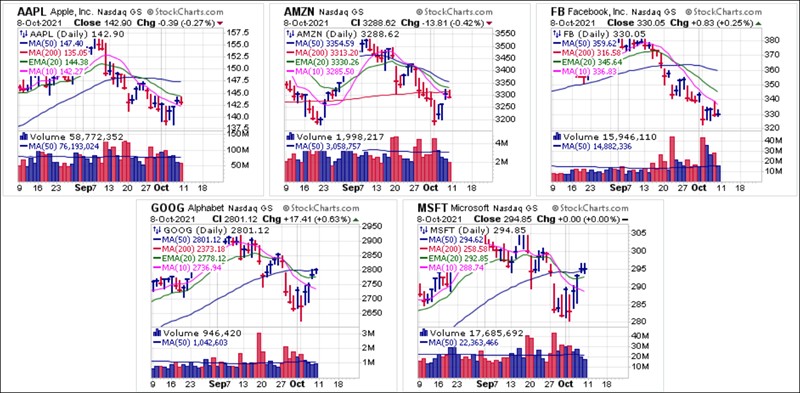
If we take the examples of Big-Stock NASDAQ stocks that we refer to as the S&P Five given their out-sized 22.8% weighting in the S&P 500 Index, we can see how this works. Apple (AAPL), Amazon.com (AMZN), Alphabet (GOOG), Facebook (FB), and Microsoft (MSFT) have all been trending lower with the market, which is no surprise, and all attempted to bounce off their lows earlier in the week following Monday's market sell-off. We see delayed U&Rs in AAPL, GOOG, and MSFT which are rallying into potential moving average resistance while FB suffers from a cascade of negative news and AMZN merely rallies up into its 200-day moving average where it may present a lower-risk short-sale entry point using the line as a covering guide. All five stocks appear to be in positions where they could roll over and back to the downside, and this will be interesting to watch for as we head into another options expiration this week where we have seen the market sell-off leading into or around options expiry every month for the past several months, like clockwork. Will it be different this time?
 Crypto-currencies have been on fire after Fed Chair Jerome Powell said that the Fed has no plans to ban crypto-currencies the week before and this past week SEC Chairman Gensler stated that the SEC has no plans to ban crypto-currencies either. This has likely sent shorts scurrying for cover, driving Bitcoin ($BTCUSD) back up towards its prior all-time highs in a very basic cup-with-handle breakout, albeit on light volume. Whether volume is necessary for the breakout to hold remains an open question but from a strictly price-oriented viewpoint support here would likely lie in the $50,000-$52500 range if one chooses to buy this breakout. As we noted in our recent live webinars, we viewed any move by Bitcoin back above the 50-day moving average as a potential long entry trigger eight Bitcoin trading days ago where the line becomes a simple selling guide if the trade fails.
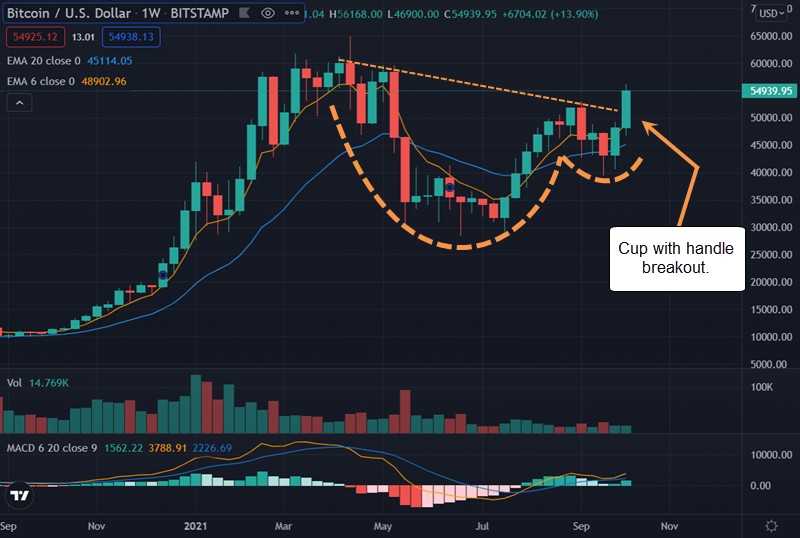
Other metrics showing bullish tendencies in bitcoin include the following.
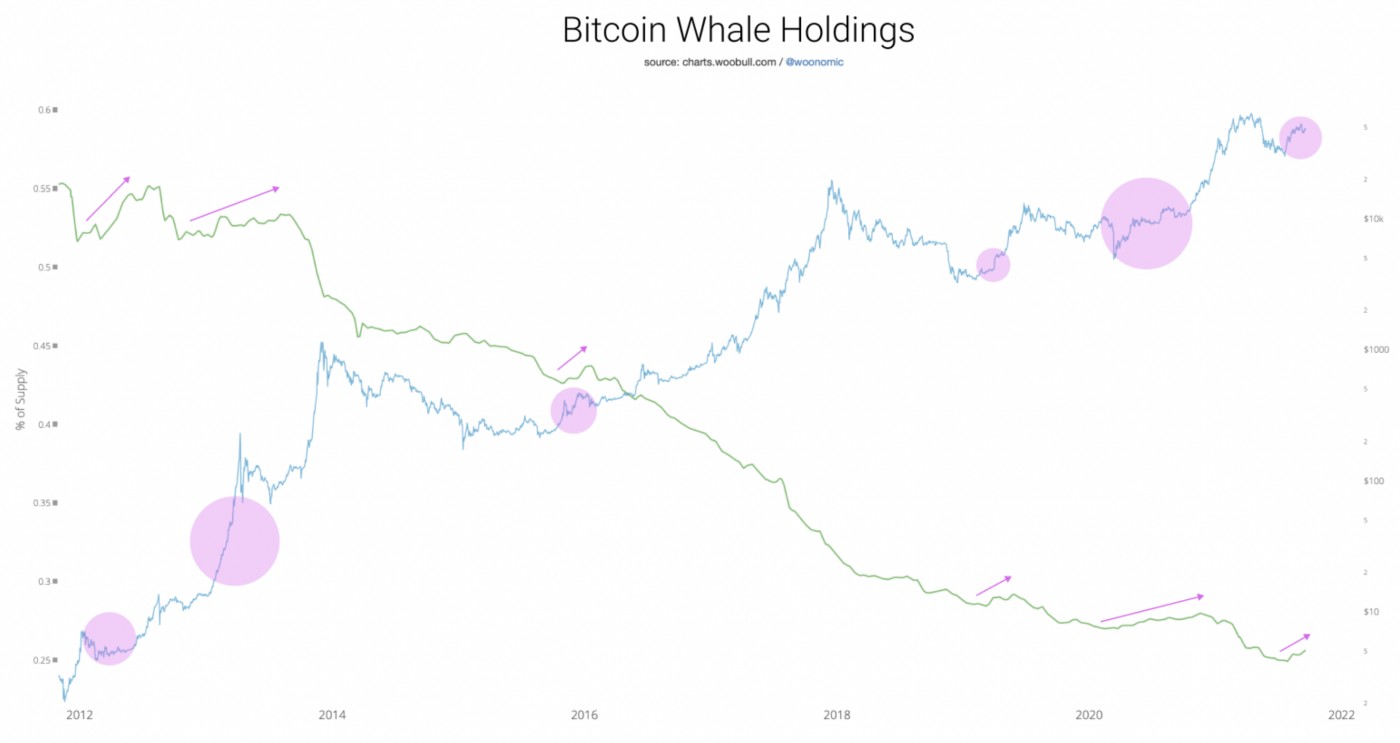
Whales over $10M have been buying bitcoin:
Each time the green line has moved into the yellow zone denoting supply shock, bitcoin has moved substantially higher:
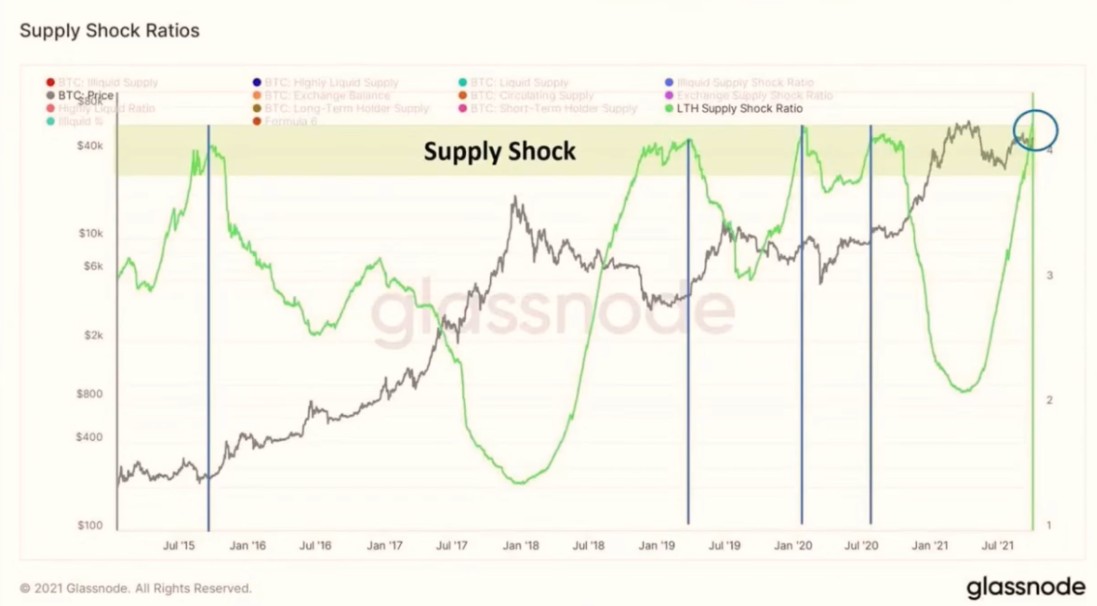
The percentage of Bitcoin supply held by whales (holders of more than 1000BTC) creates a predictable pattern. Whales tend to sell into every BTC bull market on the way to climax tops. As opportunists, they buy when they see a bullish situation. Their buying tends to cluster so push the price of bitcoin higher. Then before bitcoin peaks, they start to sell as they did in 2019 and earlier in 2021, and sometimes well before the top such as in 2016-2017. Whales are currently in one of these rare periods of accumulation.