
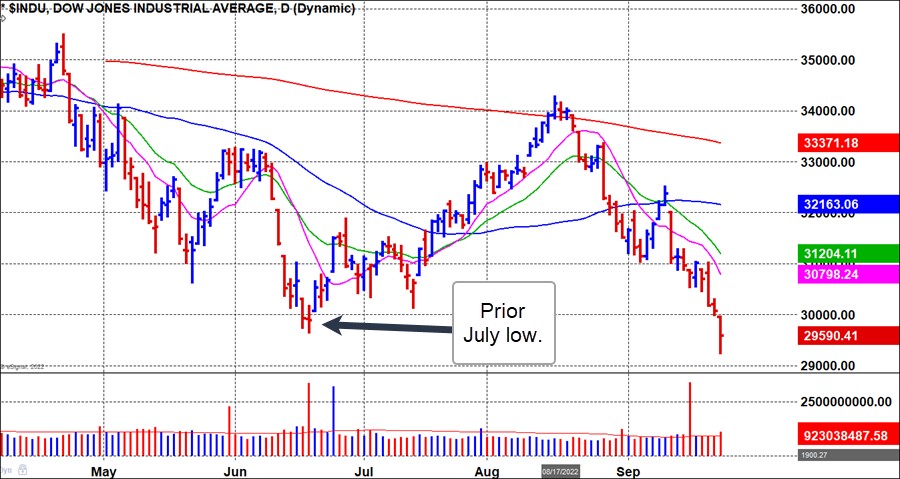
Major market indexes split wide open on Friday as the bear market rages on. The instigator of this latest break for the June lows was of course the Fed raising rates 75-basis points on Wednesday and indicating that they expected to continue raising rates meaningfully for the remainder of the year. At this stage the NASDAQ Composite and S&P 500 are approaching their June lows while the NYSE Composite, Dow, and small-cap Russell 2000 Indexes have all undercut and closed below prior June or July lows. The Dow closed Friday at 29,590.41, just below its June 17th low at 29,653.29. This puts it very close to a potential undercut & rally move back up through that low, as would also be the case for the NYSE Composite and Russell 2000.
 Short-sale target Celsius Holdings (CELH) again triggered a short-sale entry at the 20-dema on Wednesday and then at the 50-day moving average on Thursday. It continued lower on Friday and is now dangling in No-Man's Land. CELH is a typical Punchbowl of Death (POD) short-sale set-up in progress at this stage. Now, weak rallies back up into the 50-day line would be required to bring CELH back into short-sale range as close to the 50-dma as possible.
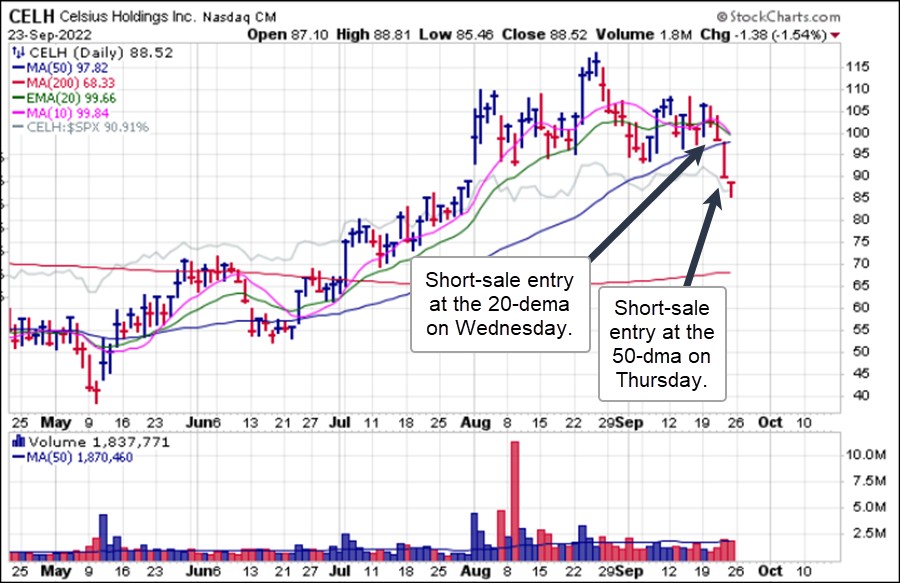 In our September 2nd Focus List Review report we showed examples of six stocks that were at or near new highs. Some had recently broken out. As we indicated at that time, several of these were in double-top breakout positions and should be watched for potential failures back through the left-side peaks of their bases or, as is discussed in Short-Selling with the O’Neil Disciples (John Wiley & Sons, 2015), typical late-stage breakout failures that occur when a stock breaks out and then fails by dropping below its 20-dema. Five of these six names have since failed with First Solar (FSLR) being the only holdout as it has pushed higher. It is now wavering along its 20-dema. Should the general market continue lower watch for any decisive breach of the 20-dema by FSLR as an aggressive short-sale entry.
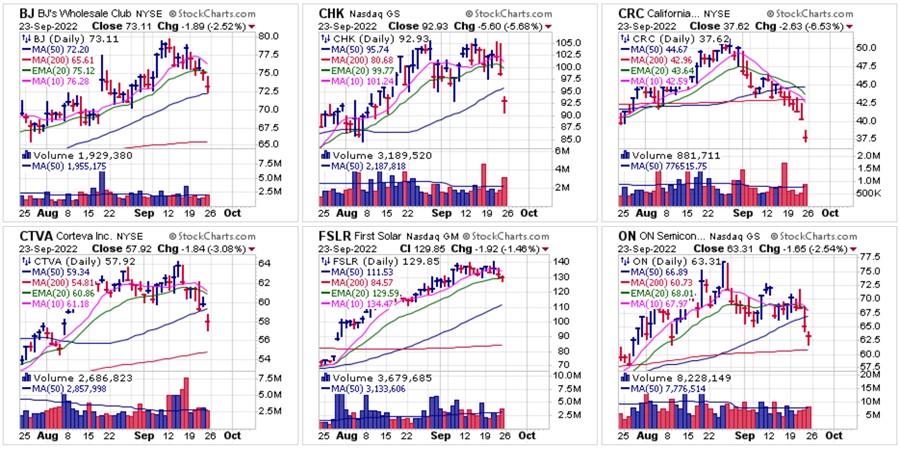
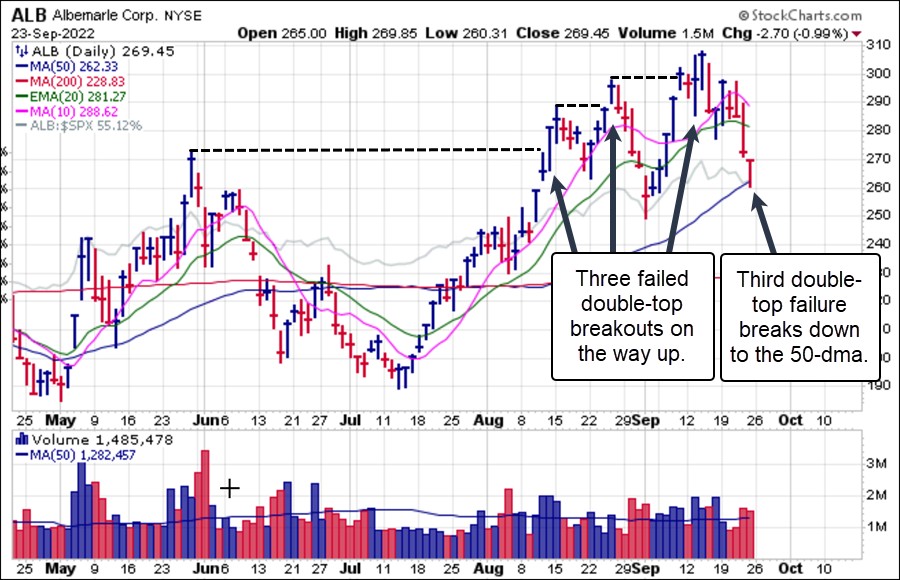
We also discussed lithium producer Albemarle (ALB) as one to watch in this regard, but it has acted quite sloppily with a series of double-top breakouts that have failed and then recovered each time. On Thursday of this past week the stock finally and more decisively broke below its 20-dema and continued lower on Friday before finding support at its 50-day moving average. A breach of the 50-day line would trigger a second short-sale entry from here, while any weak rally back up into the 20-dema could bring the stock back into optimal short-sale range as close to the line as possible. ALB and the examples above demonstrate that short-selling is not a simple affair, and requires persistence, patience, and proper timing as short-sale set-ups will tend to work best when the market begins to break down in a potential new bear leg.
 Note that the sharp break to the 50-day moving average in Albemarle (ALB) correlates very closely to similar breakdowns in other lithium-producing stocks, Lithium Americas (LAC), Livent Corp. (LTHM), Piedmont Lithium (PLL), and Sigma Lithium (SGML). All of these names triggered short-sale entries at their 20-dema on Wednesday and Thursday with LAC and PLL also closing the week below their 50-day moving averages. SGML is closest to a lower-risk short-sale entry as it closed just below its 20-dema on Friday, technically putting it in a short-sale position using the 20-day line as a covering guide.
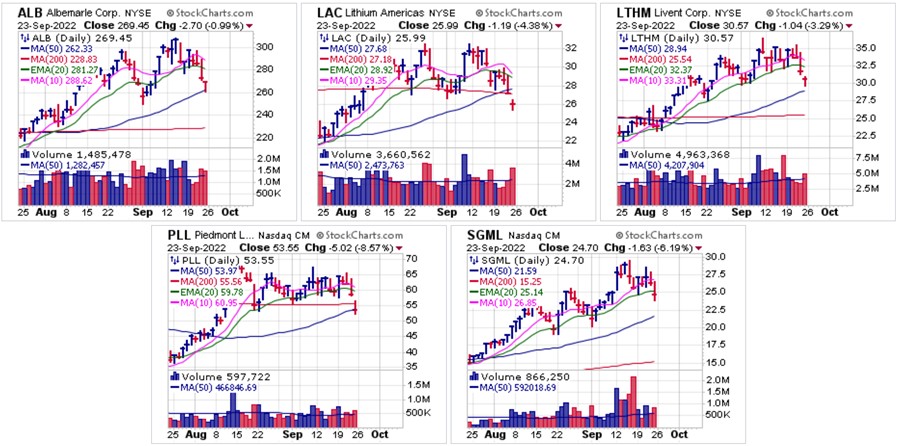 At this stage of the market decline since the mid-August bear market rally peak, the indexes are now in position where the risk of a natural snap-back type of reaction rally increases. Short-sellers should be on the lookout for any undercut & rally moves by the NYSE Composite, Dow, or Russell 2000 this coming weak for initial indications of a possible reaction rally. If the indexes continue lower into next week, then watch for the NASDAQ Composite and S&P 500 to potentially undercut their own June lows where U&R turns might also occur. With most stocks extended to the downside after sharp breaks this past week, such a oversold market rally could bring these back into short-sale range again.
With the Fed moving forward with aggressive rate increases into 2023, it is difficult to see how a new bull market would have a snowball’s chance in hell of occurring, while at the same time we recognize that short oversold reaction rallies are typical of even the most brutal bear market legs to the downside, as the daily chart of the NASDAQ Composite from 2008 illustrates below.
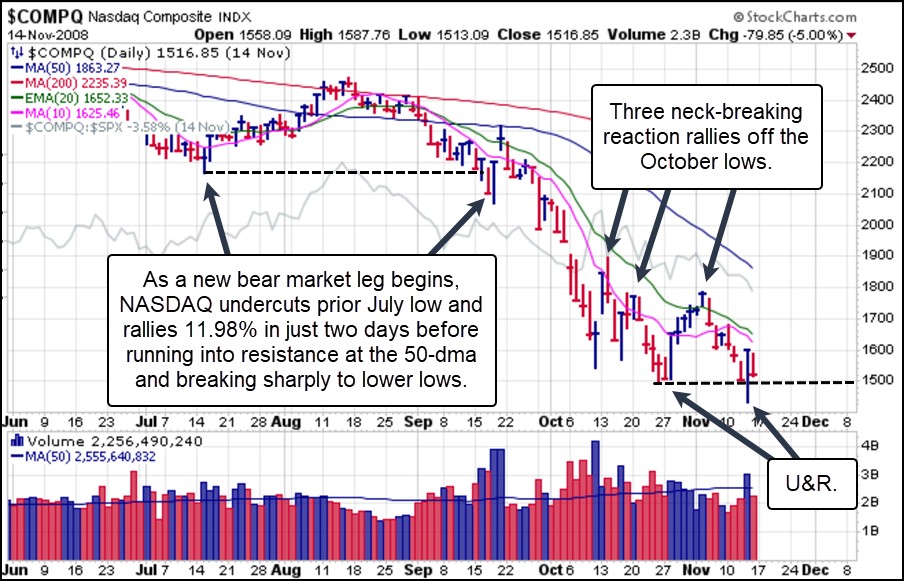
Note that while the final leg of the 2007-2008 bear market during the Great Financial Crisis was a very deep and sharp break to lower lows, it had one very sharp rally at the outset in mid-September which gave short-sellers fresh opportunities once the NASDAQ ran into solid resistance at the 50-day line. While it is not certain that such a rally would occur today, short-sellers must always adhere to a well thought-out plan for harvesting profits on the way down and avoiding such reaction rallies. More examples of such rallies are seen near the final lows as the index bounced around quite sharply in October 2008 before breaking to lower lows which were again tested in March 2009 before the market's final bottom and turn back to the upside. While history may not repeat precisely, it often rhymes, and we are relatively certain that no matter how deep this current market from the mid-August bear market rally peak goes, it will come with similar neck-snapping reaction rallies.
Meanwhile, the market trend remains to the downside, and for investors who are not oriented towards playing the short side, cash remains king.
The Market Direction Model (MDM) remains on a SELL signal.