Current Focus List
The VoSI Focus List is a compilation and reference list of stocks for which Pocket Pivot or Buyable Gap-Up Reports have been issued. It is not intended as a "buy list" or a list of immediately actionable recommendations. Stocks on the list may or may not be in proper buy positions, and investors should exercise discretion and proper judgement in determining when and where stocks on the Focus List can be purchased. The following notes are intended to assist in this process. Please note that members can enlarge the Focus List image by clicking on the body of the email and then holding the Control Key while pressing the "+" key until it is large enough to read.
General Observations:
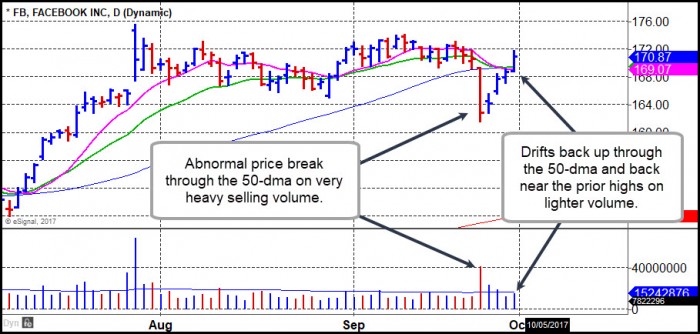
This is without question one of the most, if not the most, convoluted market environments either one of us has ever seen in our respective 26-year careers. Every pattern seems to be a contrarian set-up, where technical breakouts should be sold while technical breakdowns, even the most severe as in the case of Facebook (FB), below, should be bought. Any rational investor would have viewed Monday's severe price break on very heavy volume as a reason to sell at least part of any existing position. Yet the stock immediately finds its feet and then drifts back above the 50-dma and near the prior highs on volume that is less than impressive. The problem for most investors when faced with such sudden and abrupt price breakdowns is that at the time, one has no idea whether the breakdown is a "one-off" or the start of something more severe, such as we saw in October of 2014 or August of 2015. In a case like FB's, alert, risk-averse investors who take action get the shaft, while those "deer in headlights" who sit there in a dumbfounded stupor are saved. It is fascinating stuff to watch.
This makes operating in this market difficult, as the QE-distorted market defies standard technical descriptions. The old rules don't apply to this market in most cases, which presents an additional element of whip-saw risk in either direction.
In a similar manner, market timing the VIX with the VIX Volatility Model (VVM) had its worst performance starting in April of this year. Real-time and backtested trading showed fast recoveries after drawdowns and generally exceptionally strong performance in each year going back to 2009. That said, after achieving a return of +54.3% up through the end of May, performance reversed the strong gains starting with its buy signal on April 3 of this year. The S&P 500 has been baby stepping higher while reversing a couple weeks of gains in just a day, then trades choppy for a few weeks. Such a pattern has never been observed in this index for such an extended period. But the challenges revealed certain weaknesses in the new VVM as the old one was shelved at the end of March not due to weakness but due to backtested and real-time outperformance in the new VVM. Returns going forward look promising as the current signal is up just over +20%, but the model remains in a beta testing phase for the foreseeable future.
From an index point of view the situation remains rather recently calm, with the NASDAQ Composite Index, the S&P 500 Index, the NYSE Composite Index, and the small-cap Russell 2000 Index all posting new highs on higher trading volume. The movement is not surprising, however, given that Friday represented the final trading day of the last quarter, and may have been subject to some so-called "window-dressing." The true test will be what happens this week as we move into a new trading month. Given that the VIX is trading near all-time lows, expect a spike in the VIX sooner than later. So far this year, when the VIX has traded below 10, a minor correction of sorts occurs in short order. But this minor correction in the major averages typically translates into double-digit gains in the UVXY. Use the 620 MACD method to keep a close eye on the UVXY for entry points. Averages losses typically should be easily contained within 1-2% or less while gains often hit double digit percentages when the VIX is this low.
The daily chart of the NASDAQ Composite, below, illustrates the chop, chop, choppy action since early June that has at times looked like the start of a major market correction several times along the way. But each time, just as things looked their ugliest, the indexes found their feet and marched higher. In the meantime, various groups have out-performed and under-performed, depending on the rotational "flavor of the day." For example, earlier in the summer Chinese stocks like Momo (MOMO) and JD.com (JD) and optical names like Applied Optoelectronics (AAOI) and Lumentum Holdings (LITE) were strong performers, but more recently these have come apart in the worst possible way. Furious rotation out of one leading area and into beaten-down areas has been a trademark of this market.
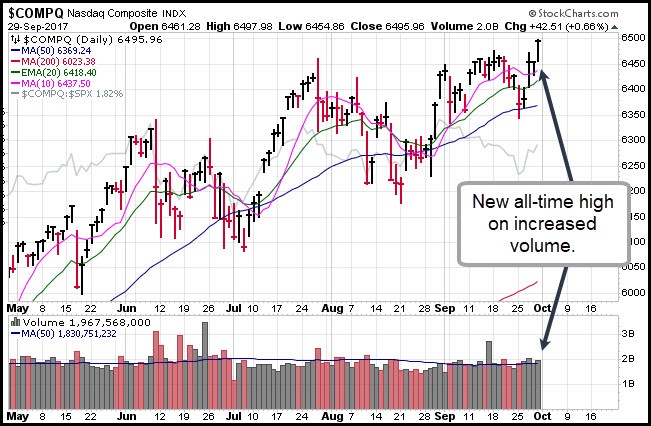
Despite the whip-saw action in some leading names like FB, we still believe it is prudent to maintain one's selling guides. In addition, the practice of selling into strength often sidesteps the issue of having to think about selling when the stock finally starts getting hit with heavy selling volume. Selling into strength is a much more proactive approach to securing profits that tends to work well in a market where investors can suddenly have the rug pulled out from underneath them, so to speak at a moment's notice, erasing 2-3 weeks' worth of prior gains. We shall see whether this latest move to all-time highs by the indexes, which looks very strong on its face, does not turn out like other such moves throughout the summer of 2017 that failed in short order.
The Market Direction Model (MDM) remains on a buy signal. The VIX Volatility Model (VVM) is currently on a provisional sell signal.
Removed from the List this Week: Electronic Arts (EA) and Facebook (FB).
Focus List Stocks Expected to Report Earnings this Week: None.
Notable Action:
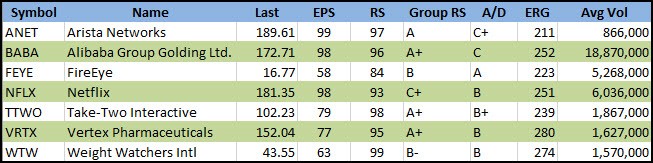
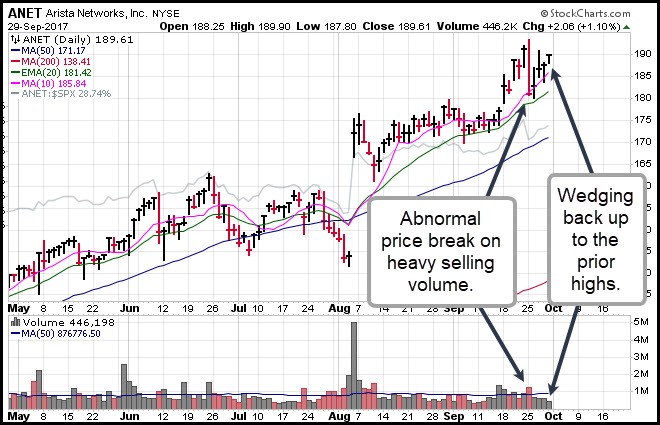
Arista Networks (ANET) was hit with an abnormal price break on Monday on heavy selling volume. Since then the stock has wedged back up to near its recent all-time highs on weak volume. As long as the stock continues to hold the top of the prior base structure and the 20-dema, it is okay. A severe breach of the 20-dema should be watched for as a bearish development.
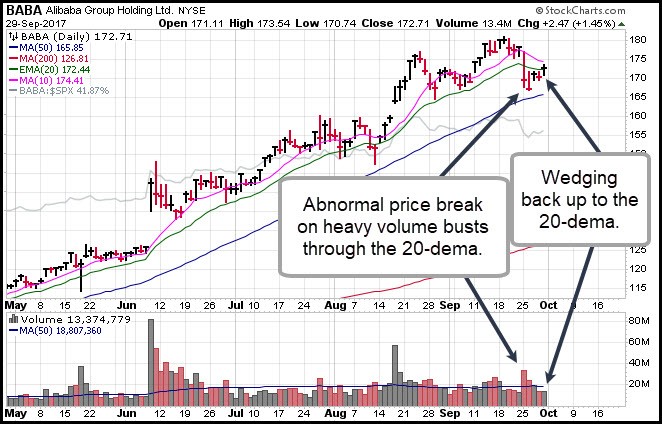
Alibaba (BABA) was also hit with an abnormal price break on Monday on heavy selling volume. It has since wedged back up to the 20-dema on tepid buying volume. Watch for the 20-dema as overhead resistance. If BABA cannot clear the 20-dema then a test of the 50-dma is quite possible.
FireEye (FEYE) is tracking just below its 10-dma, but we would remain opportunistic here and look for a pullback further to the downside and to the 20-dema as a lower-risk entry from here.
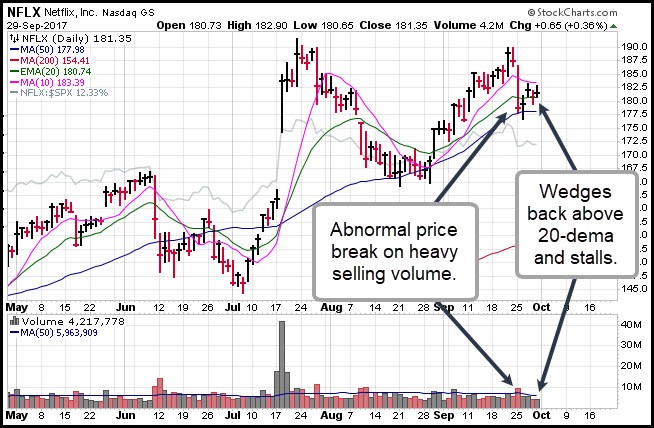
Netflix (NFLX) was another big-stock leader that was hit with an abnormal, high-volume price break on Monday. It has since wedged its way back above the 20-dema, and stalled on Friday on its second attempt at clearing the 10-dma. Earnings are expected in about two weeks' time, and the current technical action is quite sloppy. Currently the 50-dma would serve as a maximum downside selling guide if the stock gets into any further trouble ahead of earnings.
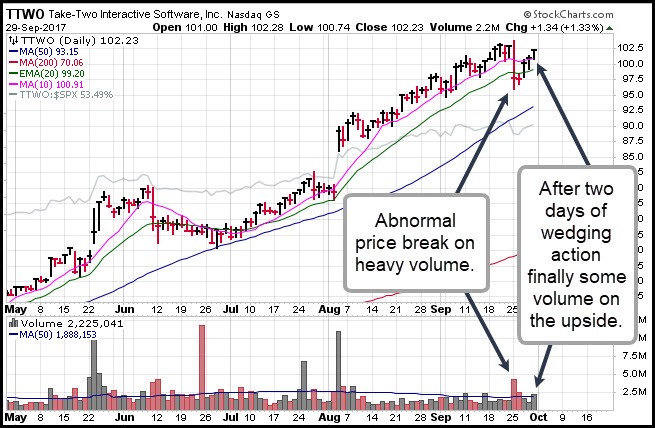
Take-Two Interactive (TTWO) also illustrates the strange and abrupt selling that hit a variety of leading stocks on Monday, creating abnormal price breaks in their previously bullish-looking chart formations. This sort of action is the essence of our issues with the current environment. Note that after the Monday price break, TTWO then wedged back to the upside on weak buying volume before picking up some stronger buying volume on Friday as it approached its prior highs. Based on the prior high-volume price break, we would expect that the stock has to engage in some degree of backing-and-filling, at best, to work this off.
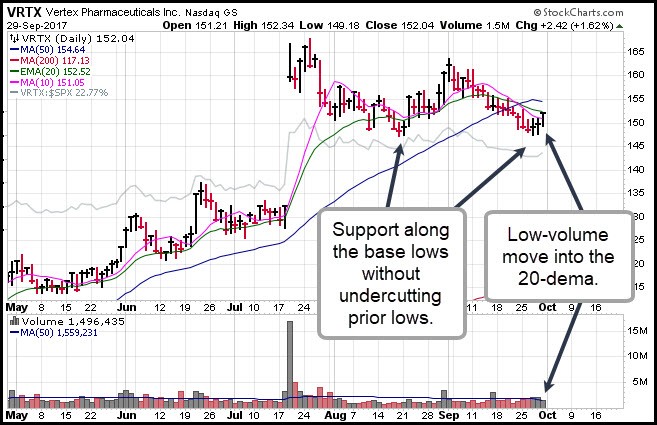
Vertex Pharmaceuticals (VRTX) remains on the Focus List for now, but it is in a severe "last stand" position here along the lows of its current 10-week base. Following the pocket pivots in late August, we would have expected the stock to show more upside spunk, but since then it has been in a steady downtrend that has subsequently lead to a 50-dma violation. However, VRTX has held along the lows of the base without undercutting these lows, so we would not be looking enter the stock on the long side until we see a more concrete, actionable set-up down here along the lows of the base.
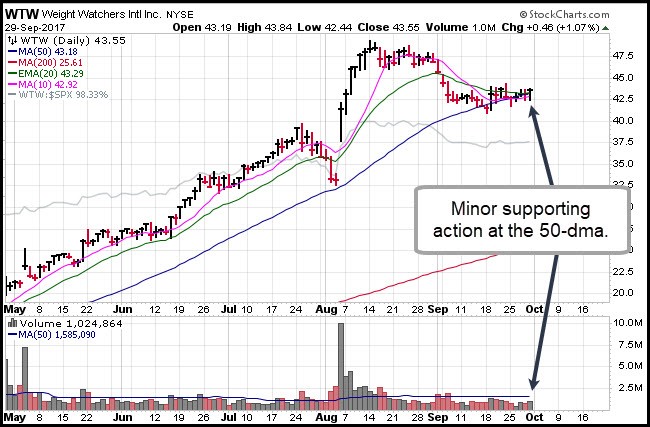
Weight Watchers International (WTW) is holding support along its 50-dma, and showed some minor supporting action at the line on Friday as volume picked up just slightly over the prior day. Volume was also -35% below-average on Friday, so this is also a bit of "voodoo" type action along the moving average. As we discussed in our Friday morning Focus List Notes, the stock is in a lower-risk entry position here along the 50-dma, using its as a tight selling guide.