
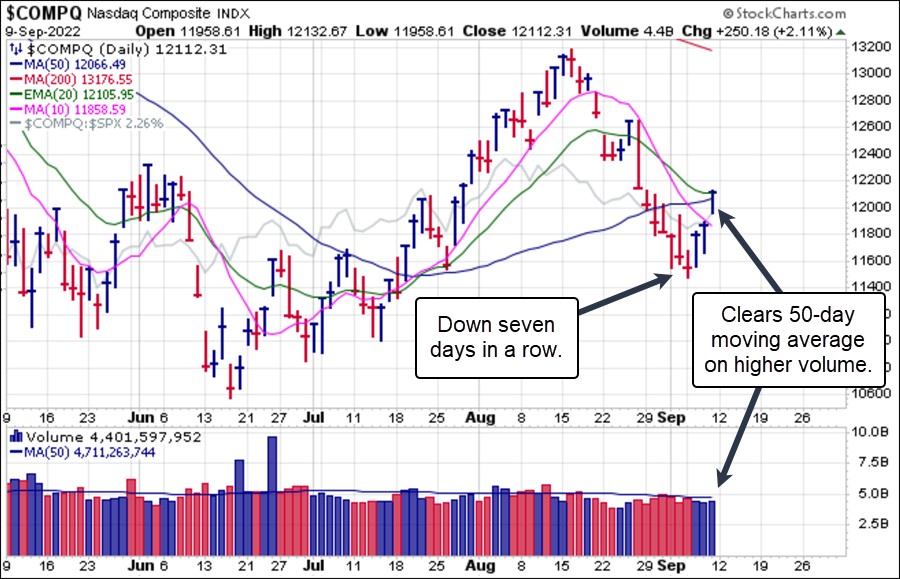
After declining seven straight days the NASDAQ Composite finally entered into an extremely oversold state as many busted former leaders have declined sharply since the mid-August near-term market peak. The NASDAQ just cleared its 50-day moving average on Friday in what is so far a three-day oversold bounce off the lows of Tuesday. Friday's move took the NASDAQ and the S&P 500 back above their 50-day moving averages. NASDAQ volume was higher while NYSE volume was lower vs. the prior day. So far, this has the look of a normal oversold reaction bounce after seven straight down days and ahead of this week's important Consumer Price and Producer Price Index reports.
 The weekly chart of the S&P 500 shows a one-week bounce after three straight down weeks after the index ran into resistance at its 40-week moving average in mid-August. Depending on how the market reacts to this week's inflation data, the rally could extend further, and it would certainly not be out of the question to see the index push back closer to the 40-week/200-day moving average.
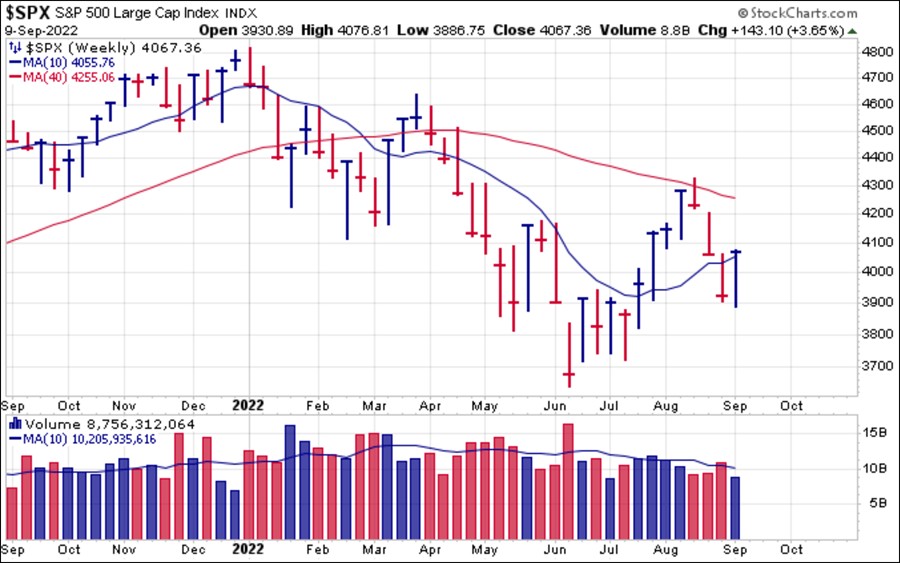 Sentiment has again become extreme. The American Association of Individual Investors (AAII) sentiment surveys show that the percentage of bullish investors has slashed back to the prior lows and below the lows seen in 2020 as bulls evaporate. Meanwhile, the percentage of bearish investors has again spiked up towards the highs of early 2022 and just past the highs seen in 2020. From a sentiment standpoint the market is poised for a continued reaction rally as the National Association of Active Investment Managers (NAAIM) Exposure Survey shows active managers with a net long exposure of 27.33% vs. a peak of 71.59% just four weeks ago at the mid-August market peak.
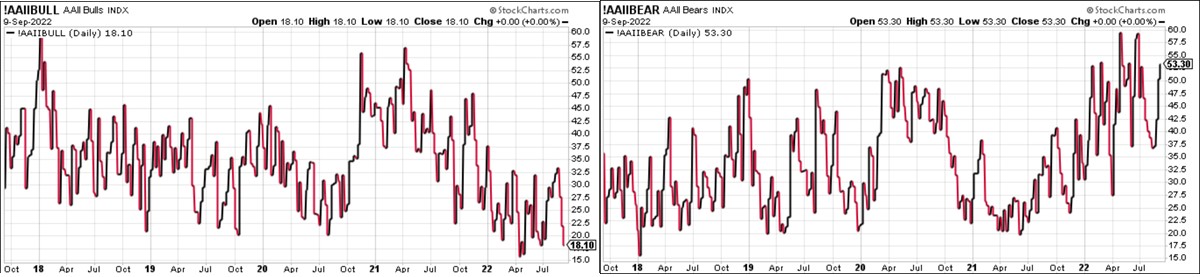 Market context will figure heavily in how stock set-ups both evolve and play out. Do not expect that short-sale set-ups will have a high probability of working during an oversold reaction rally as short-sale target stocks will simply push back up through prior moving average or price resistance.
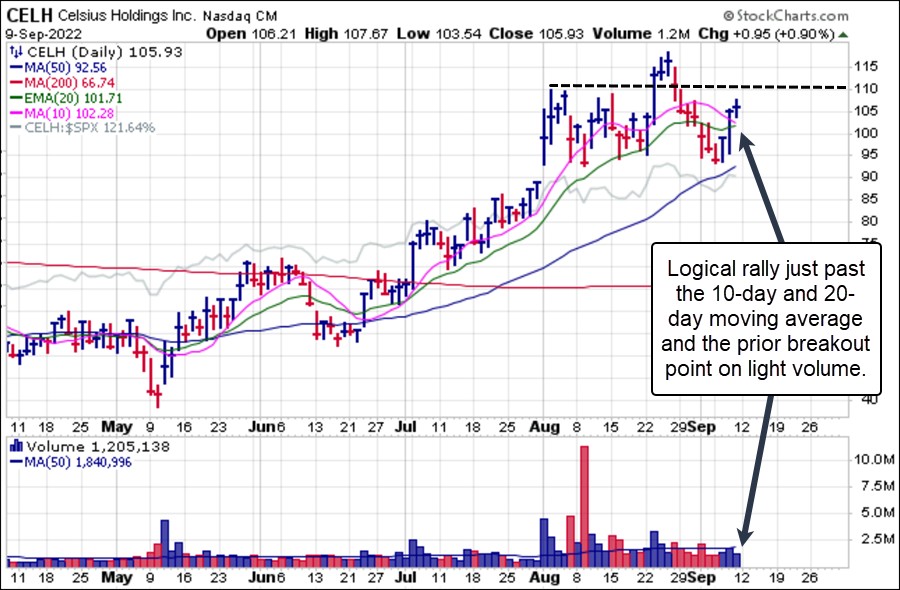
Short-sale set-ups may continue to evolve and then break down again if and when this current reaction rally ends. We could just as easily remain in a choppy range for a period of time following a sharp move lower over the prior month. Celsius Holdings (CELH) has played out as a double-top short-sale target and a potential Punchbowl of Death short-sale set up after breaking below its 20-dema last week.
Given that the break represented roughly a 15% profit from the original short-sale entry at the 110.22 left-side peak of the punchbowl that was a logical point at which to cover and take near-term profits. In Short-Selling with the O'Neil Disciple (John Wiley & Sons, 2015) we advise taking 15-20% profits when one has them, and when combined with a stock coming down into potential moving average support on the daily or weekly charts creates a compelling reason to take profits and wait for the stock to set up again.
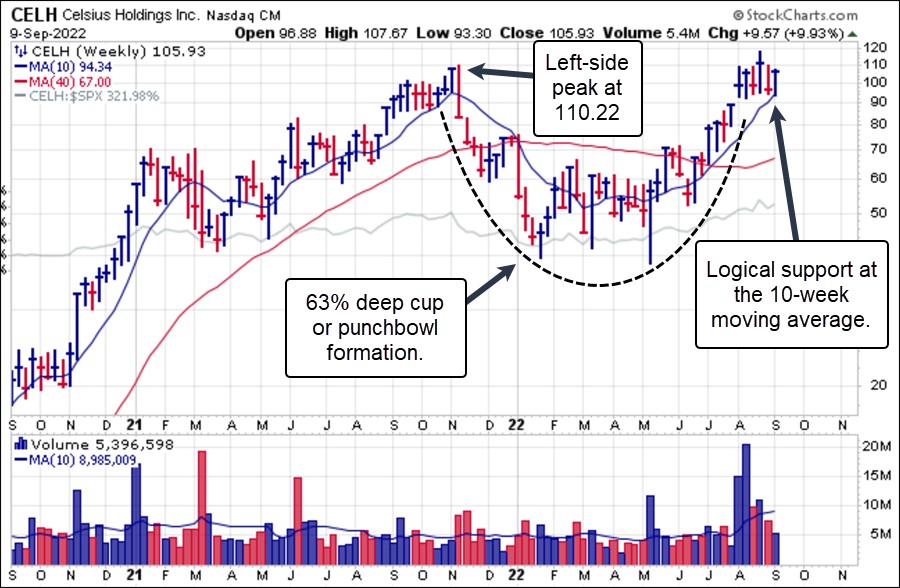
We can see how this played out on CELH's daily chart below as the bounce occurred along the lows of the prior three-week base without reaching the 50-day moving average on the daily chart. That led to a bounce off the 10-week moving average on the weekly chart - emphasizing the point we've made before that one must monitor the daily and weekly charts of any short-sale position to determine where potential, likely support might be found. Within the context of a three-day oversold bounce in the major market indexes, CELH found support at the 10-week moving average on the weekly chart coinciding with the lows of the prior three-week flag from which it broke out and failed. The stock is now moving back up towards the prior breakout point and just above the 10-day and 20-day moving averages. Reversals back below the two moving averages would trigger a fresh short-sale entry.
Again, keep in mind that market context will determine how this set-ups play out as CELH could potentially post a re-breakout and negate the current Punchbowl of Death short-sale set-up. The same would go for any stock that has been wavering along near-term support. Lithium producer Albemarle (ALB) is a perfect example. The prior week the stock failed on a recent double-top type of breakout as it slashed below the 20-dema and triggered a secondary short-sale entry coming on the heels of a double-top short-asle entry as it busted the left-side peak of the pattern at 273.25.
ALB again looked shortable on a rally back up into the 20-dema on Tuesday, but as the market began a three-day oversold bounce the very next day the stock simply streaked right back up to new highs in a deep V-shaped move. Again, an example of how market context shapes short-sale set-ups as they are initially active but then negated. This is typical action for the short side, and is why we advise that any member seeking to play the short side of this market at ANY time should first read Short-Selling with the O'Neil Disciples in order to have a reasonable grasp of short-selling techniques.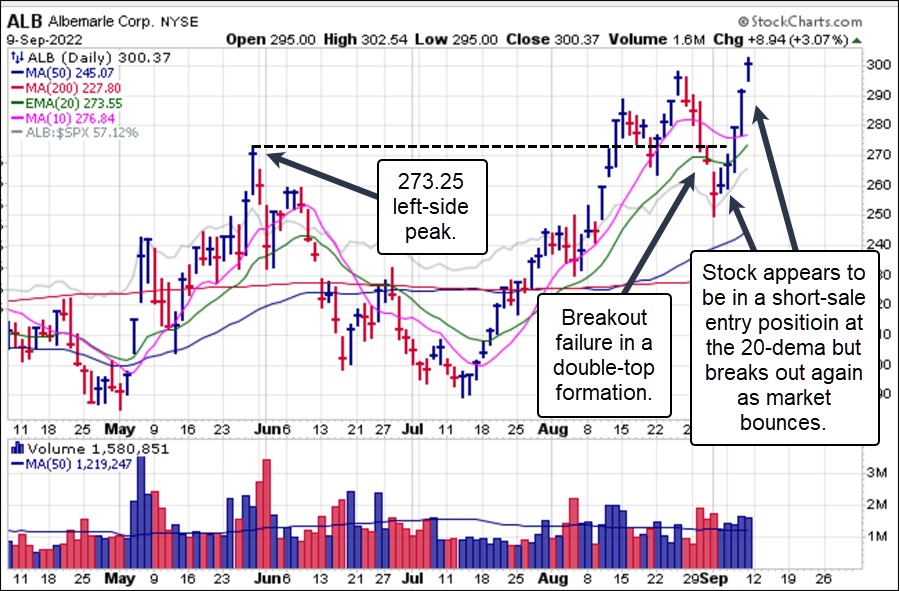 The Market Direction Model (MDM) remains on a SELL signal.