
Current Report Watch List
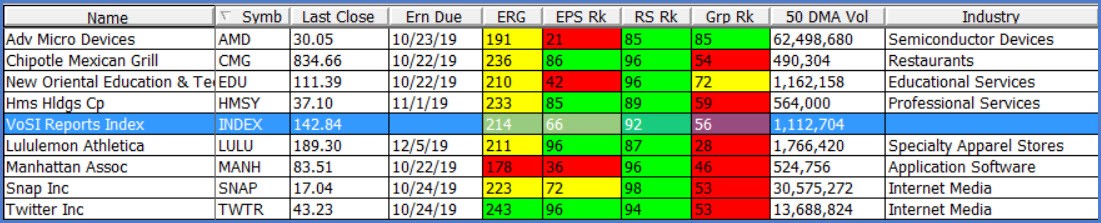
The VoSI Report Watch List is a compilation and reference list of stocks for which Pocket Pivot or Buyable Gap-Up Reports have been issued. It is not intended as a "buy list" or a list of immediately actionable recommendations. Stocks on the list may or may not be in proper buy positions, and investors should exercise discretion and proper judgement in determining when and where stocks on the List can be purchased. The following notes are intended to assist in this process. Please note that members can enlarge the List image by clicking on the body of the email and then holding the Control Key while pressing the "+" key until it is large enough to read.
General Observations:
Major indexes were hit with selling at the end of the week on news that a Chinese delegation had cancelled its planned meeting with U.S. farmers in Montana. In addition, the situation surrounding the alleged Iranian attack on a Saudi Arabian oil facility has added to the array of tensions and negative news that have come into play in this market on a frequent basis. Given that China is the world's largest importer of oil, the country is particularly sensitive to a rise in the price of oil.
Heavy selling volume on Friday was exacerbated by quadruple-witching options expiration, but on its face the chart of the NASDAQ Composite Index shows distribution off the peak on Friday following a period of stalling action along the highs of the past six trading days. All of the major market indexes are near all-time highs and all held support at their 50-day moving averages.
Breaches of the green 20-day exponential moving average marked the start of short-term corrections in early May and late August. Back then the 50-day line was far below the 20-day line, but currently the two lines are running near to each other. Therefore, we would view a breach of the 50-day line as an indication of just how bearish Friday's action was.
In the meantime, we note that there remains very few long ideas that we find compelling and capable of intermediate- to longer-term upside trends. At the same time, we are seeing leaders like Roku (ROKU) come completely apart this past week, while Microsoft (MSFT) and Apple (AAPL) falter at their latest breakout points. Thus, the action of individual stocks "under the hood" is questionable, at best.
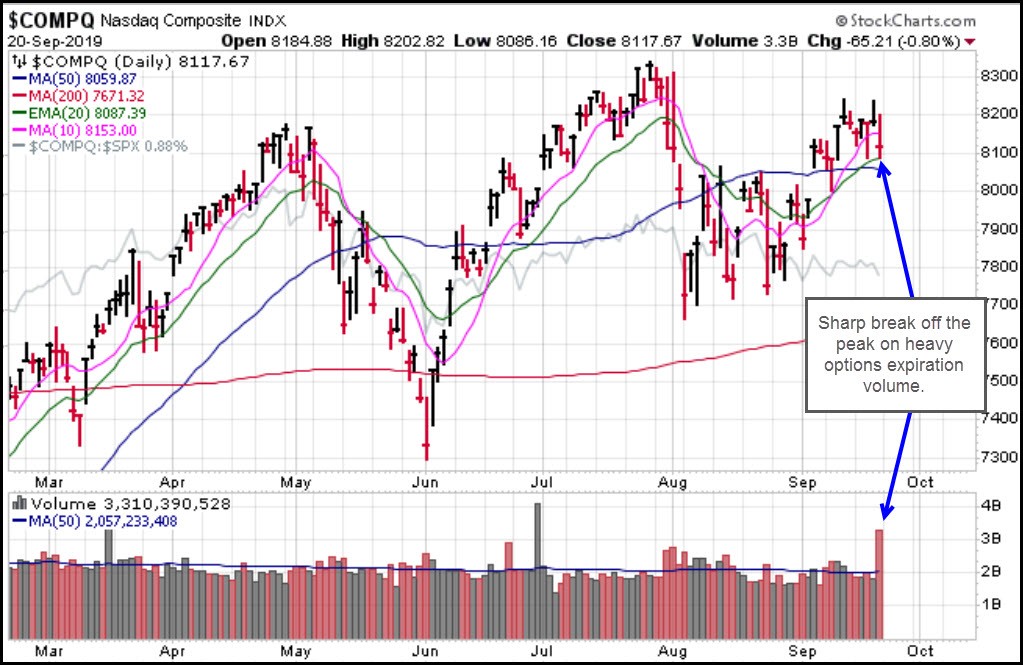
The Market Direction Model (MDM) remains on a buy signal. As has been discussed in prior reports, the bearish effects of the trade war against struggling economies can push markets lower but the overarching effects of quantitative easing tend to guide major U.S. stock market averages higher, albeit in a sloppy manner, as it remains the tallest standing midget, thus the biggest beneficiary of global central bank debt monetization.
Notable Action:
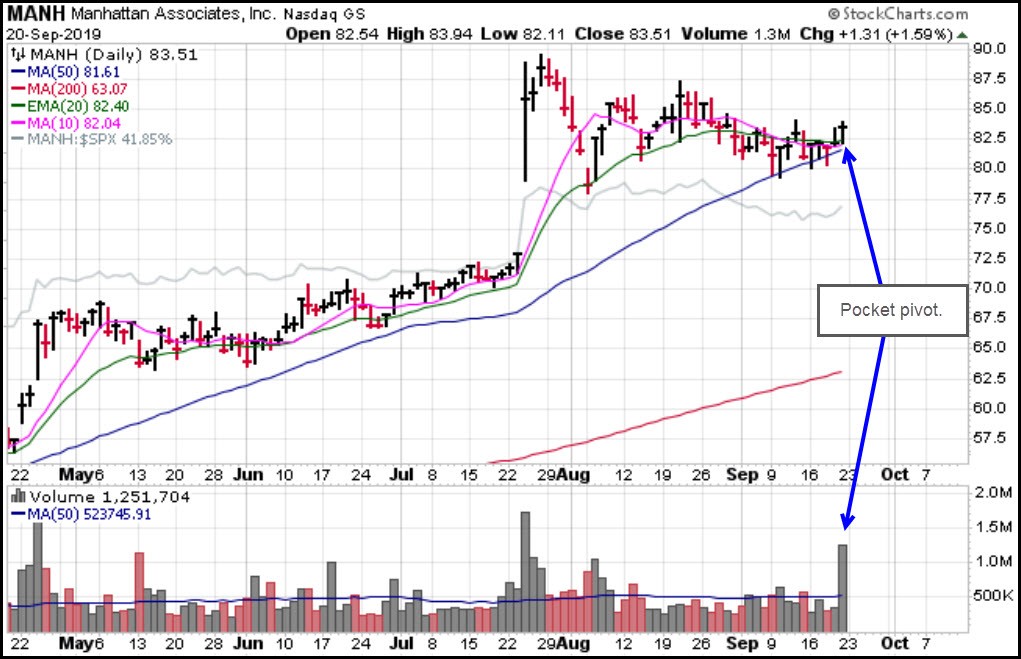
Quadruple-witching options expiration produced pocket pivots in two of the meager number of eight names left on the Report Watch List. HMS Holdings (HMSY) and Manhattan Associates (MANH) both posted pocket pivots, but volume was obviously skewed by options expiration. However, we have seen this occur in the past and often times the pocket pivots turn out to be valid. The more relevant question is whether these stocks can get anything going in a difficult general market environment.
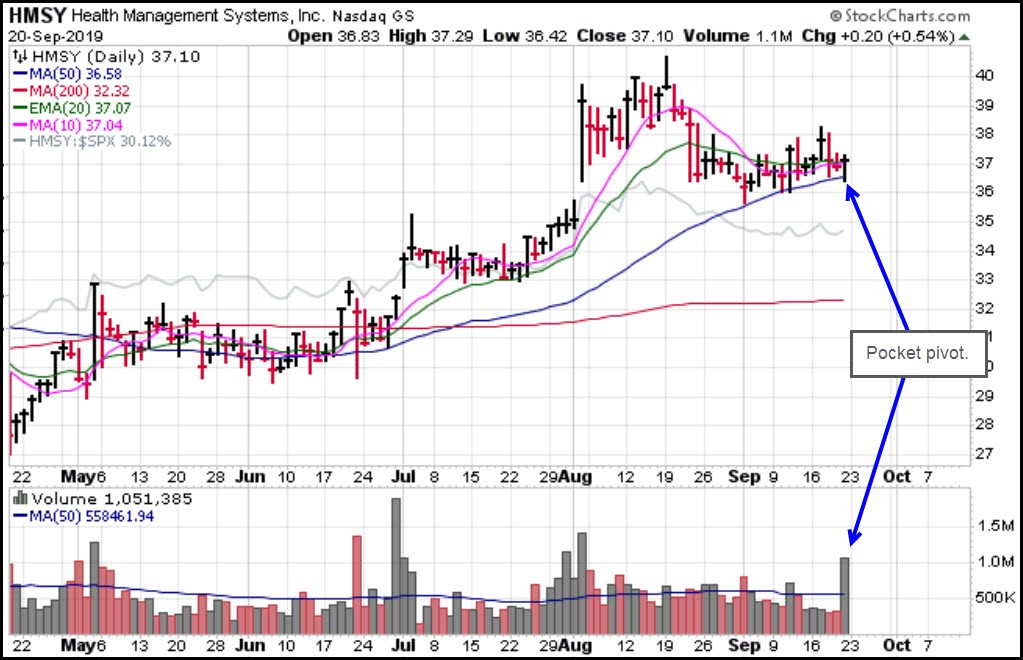
Note that HMSY and MANH are both attempting to hold support along their 10-dma, 20-dema, and 50-dma. While Friday's pocket pivots may be intriguing, breaches of the 50-dma could easily send these stocks into play as short-sale targets.
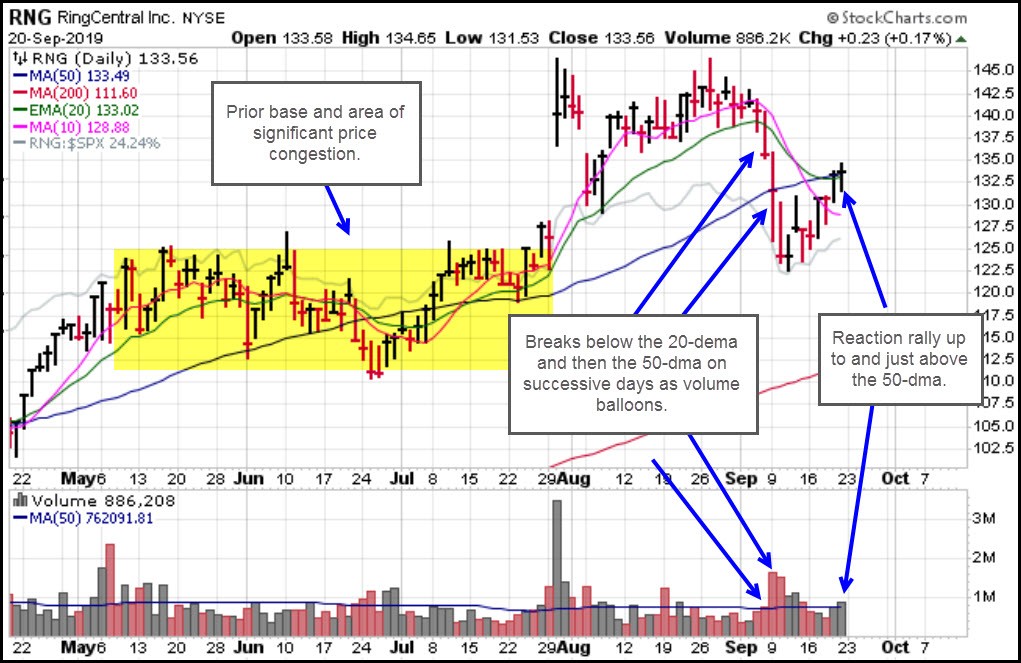
This past week we reported on potential short-sale set-ups in Brazilian payments processor Pagseguro (PAGS) and former cloud leader RingCentral (RNG). RNG was a big cloud-software leader that came apart very quickly two weeks ago when the entire group came under mass pressure. It busted both its 20-dema and 50-dma in succession as volume ballooned sharply over two days. After reaching an oversold position at the top of a prior base where price congestion helped produce a solid area of support.
This has led to a logical reaction rally that has now reached the 50-dma. With RNG closing just a few cents above the 50-dma, any reversal back through the line would trigger this as a short-sale entry at that point, using a tight stop of 1-3% on the upside or simply the 50-dma itself.
Payment stocks have been under pressure more recently, and we saw Paycom (PAYC), which was previously on the Report Watch List, blow apart in the process. The group, which includes names like GPN, V, and MA, for example, has come under pressure in uniform fashion. PAGS was hit along the group two weeks ago, sending it slashing through its 20-dema and 50-dma in a big-volume, two-day price break. It then found logical support along the lows of a short consolidation it formed in late July and early August. It has since rallied just beyond its 50-dma as it stalls around the slightly-higher 20-dema. In this position one can either a) short it here and use the 20-dema plus 1-3% as a guide for an upside stop or b) look for a break back below the 50-dma as a short-sale trigger, and then use the 50-dma as a guide for an upside stop.
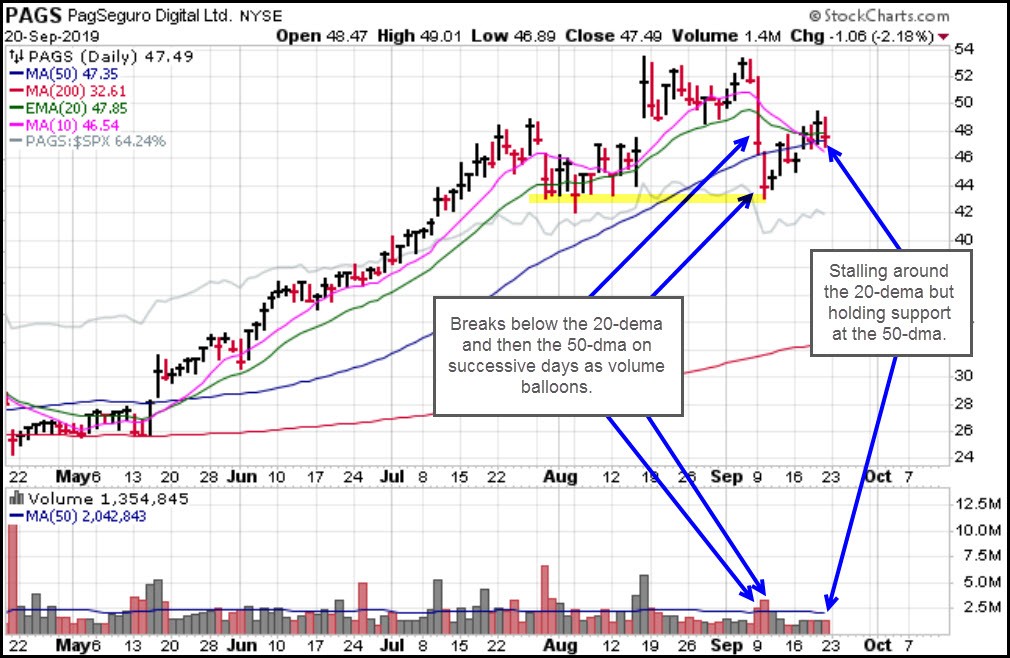
We can see in the examples of RNG and PAGS that the general market rally off the lows of late August has not produced any serious breakouts in leading stocks, but, more broadly, has produce more oversold reaction rallies into resistance as it has with these two stocks. It is always possible that RNG and PAGS could keep rallying if the general market keeps rallying, and we have seen many sharply v-shaped rallies off of chart lows occur in many stocks following the prior two corrections in May and August. Whether this pattern holds true again, or if stocks rallying into areas of resistance start to roll over at resistance in more textbook short-selling fashion, will likely provide us with meaningful clues as to where this market is headed next.