
Offbeat Ideas and Commentary from the Depths of Gil's Trading Notes
How I Trade the VIX in the Current Market Environment
One thing you won't get in VoSI is a "party line." Dr. K and I don't necessarily agree on everything all the time, but we both would agree that this is a good thing. One area where we do not necessarily see eye-to-eye is this business of using so-called "market-timing" models to trade the market using ETFs. This is particularly the case when it comes to the idea of trying to use a back-tested model to trade the VIX. My own view of models is that one can certainly come up with great back-tested results, but in real-time the game changes significantly. This is why almost all models fail miserably, and those that succeed don't necessarily produce stellar real-time results relative to other investment methods and vehicles one can use and which have greater time value and hence profit potential when employed during a market uptrend or downtrend.
First and foremost, I view the market as an optimization problem. I am interested in finding trades that have a high time value with the lowest risk possible. That's how triple-digit returns are achieved. The last time I made triple-digits in the market was in 2014, and that was achieved by being in high time-value trades at the right time. The NASDAQ was up 13.85% in 2014, so even using Dr. K's MDM with 3x index ETFs would not have come close to what I was able to achieve using the more optimal vehicles of individual stocks. That's why I am not a believer in, nor a user of, market-timing models. I think it's mostly back-tested baloney. I understand that this is an arguable point to make, and that a reasonable counter point could likely be made. I can only give my honest view, nothing more and nothing less, as a matter of full disclosure and honesty. I strive to abide by the axiom that Bill O'Neil once told me, which is, "Never let the truth become your enemy." So I speak the truth whenever I see it, as I see it.
As a quick aside, I would note that the Market Direction Model (MDM) is probably a good model for investors who want a slower, less-stressful approach to riding market trends, and it has proven itself reasonably well in 2017. According to Dr. K, had one used the TECL ETF to trade the signals in 2017. a 50% return could have been achieved, although I have not verified this. I would be curious to know whether any members reading this VooDoo Report have achieved those types of results with the MDM as well, and also feed back from any members who have used the VIX Volatility Model (VVM) - what has been your actual experience with these two models? I would love to hear it. But this is VooDoo Report is not intended to be a discussion of the MDM or the VVM, or even market-timing as a broader topic so I won't belabor the point, it is a discussion of a specific method I use in my trading in the current market environment.
Anyway, attempting to short the VIX via the signals issued by some model when the VIX is trading at or near all-time lows strikes me as suicidal at best since it exposes one to high risk (a massive upside jack in the VIX like we've seen a couple of times this past two weeks) while providing very little profit opportunity relative to other investment vehicles. When the VIX is declining, the profits one can make shorting it are not nearly as great as the profits one can make from simply being long stocks when the market is rising (and the VIX, correspondingly, is falling). After all, being short the VIX earlier in the year vs. being long a stock like AAOI, LITE, BABA, BZUN, MOMO, WB, FB, etc. etc. was a highly inefficient and slow way of playing the market's steady uptrend in 2017. So, from my perspective, shorting the VIX when it is at all or near all-time lows is the proverbial fool's errand.
Conversely, when the VIX is trading at historic lows, my observation is that it presents a unique and highly positive risk-reward scenario as a long trade based on the fact that its biggest moves tend to be sharp jacks to the upside. So while there is little to no efficacy or utility in trying to short slow, dribbling downside trends in the VIX whenever the market is trending higher, there is huge time value in trying to catch big upside jacks in the VIX just before they occur. This is what I'm trying to do with my specific approach to trading the VIX long only. It is not a model, it is not a trading system. It is a concrete method that incorporates the overlaying context of the general market and the position of the VIX for the purpose of catching brief, but extremely sharp upside moves in the VIX in a timely and profitable manner.
A strong word to the wise: Trading the VIX via its associated array of ETFs can be dangerous, and if you are undisciplined and screw things up by not keeping things tight according to what you see on the 620 chart you can get your head handed to you. Morons and sloppy traders need not apply! :-)
My method for doing this is quite simple, and involves using the context of the current positions of the market indexes on their charts in conjunction with the "620" five-minute intraday chart tool that I apply to a variety of trades, from buying pullbacks in stocks, shorting rallies in stocks, covering short positions as they undercut prior lows, and now when trading the VIX at potential inflection points back to the downside after the market has been rallying for a period of time.
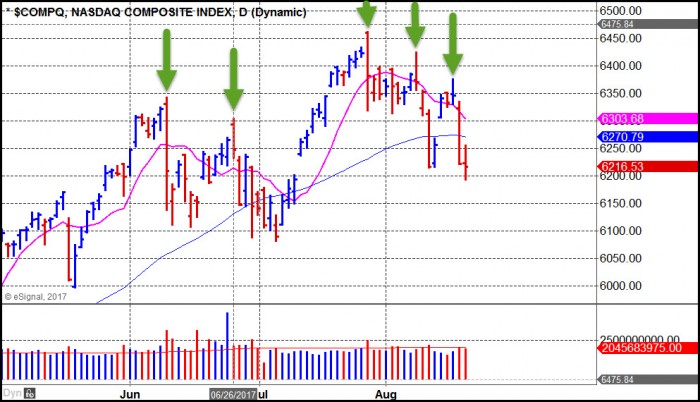
Let's start by looking at a daily chart of the NASDAQ Composite Index over the past three months below. Note that there are several peaks over the past couple of months or so, and all involve sharp reversals to the downside. These sorts of inflection points are exactly what I'm looking for when going long the VIX via the ProShares Ultra VIX Short-Term Futures ETF (UVXY), which is my vehicle of choice when seeking to go long the VIX. Each peak in the June-August time frame constituted an intraday market reversal that then led to a sharp break to the downside which in turn produces a sharp jack to the upside in the VIX.
Let me show you how this was played using the 620 chart on the most recent two peaks in the market, on August 17th and then again on August 8th. The trick is in being alert to points in the daily charts of the indexes where they may be vulnerable to downside reversals. The other important point is that one has to be willing to be very active in testing the UVXY long as certain points while using the 620 chart to time entries as well as control risk by backing away very quickly when the market doesn't reverse.
When the market reaches a new high, I am always monitoring my “620” five-minute intraday for turns that might coincide with inflection points in the major market indexes. An example is the buy signal that hit on Thursday, August 17th on the 620 chart of the ProShares Ultra VIX Short-Term Futures ETF (UVXY), below. Because the indexes had shown churning and stalling action on Wednesday after a sharp jack off of the prior week's lows, I was on high alert for a possible UVXY entry.
I use two signals on the 620 chart: a solitary MACD cross where the orange "fast" line crosses the blue "slow" line to the upside, and then a full 620 buy signal where the 6-period exponential moving average (6 times five-minutes = 30 minute e.m.a.) moves above the 20-period exponential moving average (20 times five-minutes = 60-minute or 1-hour e.m.a.).
What I find is that using the MACD cross first, particularly after the UVXY has been moving lower or trending sideways on an intraday basis, is the best way of entering the UVXY long. When this is followed by a clean moving average cross that generates a full 620 buy signal then this acts as confirmation of my initial entry, and I can then set my stop at the 20-period line or somewhere that at a bare minimum guarantees that I won't get out with a loss, or much of one.
Right at the open the MACD lines crossed, which I will take as a buy signal with a very tight stop of 10-20 cents. I don’t care if I get quickly stopped out and the UVXY turns back to the upside, as I will then look for secondary entries. The idea is to take tiny losses when the signals are wrong in exchange for catching a sharp upside move, particularly after the market indexes have gotten extended to the upside.
That initial MACD buy signal resulted in a rapid move to the upside, which got extended quickly as the MACD lines separated by a relatively wide margin, what I call a “MACD stretch. This occurred just after the market open around 7:00 a.m. my time here on the West Coast. This was a nice price move and one that I would look to sell into based on the MACD stretch.
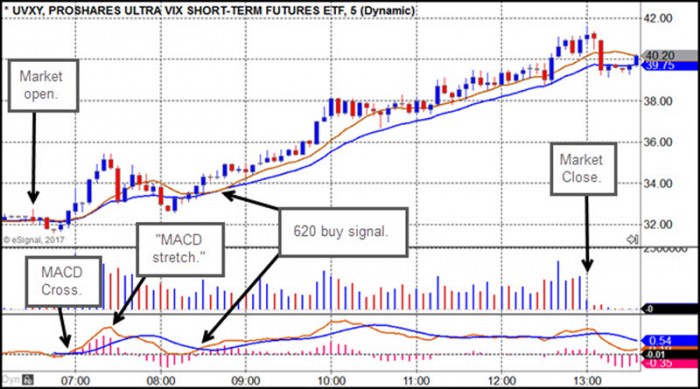
The UVXY then broke down from there, but later set up on what was a full “620 Buy Signal” where the MACD lines crossed in synch along with the 6-period exponential moving average crossing above the 20-period moving average. At around 8:30 a.m. that is exactly what happened, and the UVXY never looked back for the rest of the day, producing a 33.3% gain for the day. That is what I call a high time-value trade, and one that is very helpful to one's portfolio even if one only implements a 20-30% position in the UVXY.
To illustrate why I use MACD crosses as my initial entry signals we can look at the intraday UVXY action on this past Wednesday, August 16th. Here we see a quicky upside move right at the open that was preceded by a MACD cross to the upside. The MACD lines quickly reached a "stretched" position where the fast line moves significantly above the slow line and then crossed back to the downside shortly after the moving averages had confirmed the initial buy signal right at the market open (second green arrow from the left. In this case I likely would have sold at least part of my UVXY position into the MACD stretch despite the associated 620 moving average cross. Once the MACD lines cross to the downside just before 7:00 a.m. I would have been completely out of the position.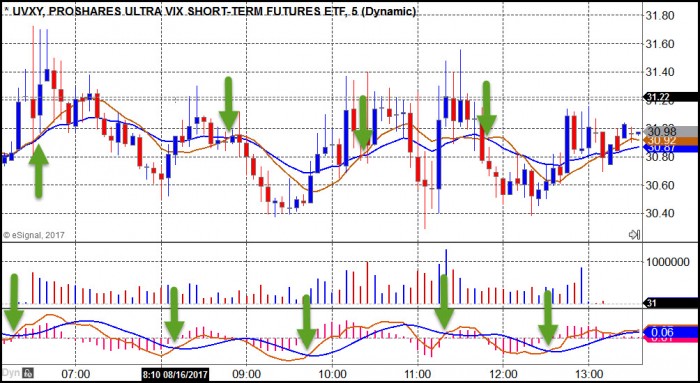
At the third green arrow from the left we get another MACD cross, which is another entry signal. That results in a slight upside move that is briefly confirmed by the moving averages just before 9:00 a.m. at the fourth green arrow from the left. By studying all the other signals that occurred throughout the day, you can see that by using the MACD crosses as your initial entries risk is kept to a minimum. In fact, in many cases you can get out with a small profit.Note also on the chart that sometimes the moving averages will cross in bullish fashion but the MACD lines cross to the downside shortly thereafter. That is often an exit signal that tells you to back away and wait for the next MACD cross to the upside. Another thing to notice is that one can also use MACD "stretches" to the downside as possible entries as well, and this is one of my favorite techniques, although it is tricky. When the orange "fast" line moves a fair amount below the blue "slow" line that can also present an entry opportunity IF it is also associated with the general market indexes running into potential intraday resistance at the highs. If the indexes blow through the highs, then one would simply back away from the UVXY very quickly.
It is important to emphasize that what happens on the UVXY 620 chart must always be interpreted in conjunction with what I’m seeing on the market indexes on their daily charts as well, and perhaps more importantly from the perspective of timing entries, their intraday charts. If the indexes have been rallying for several days, and the VIX is plumbing what have been historical lows recently, then that is the time to start watching the UVXY 620 chart for a potential high time-value entry on the long side of the UVXY.
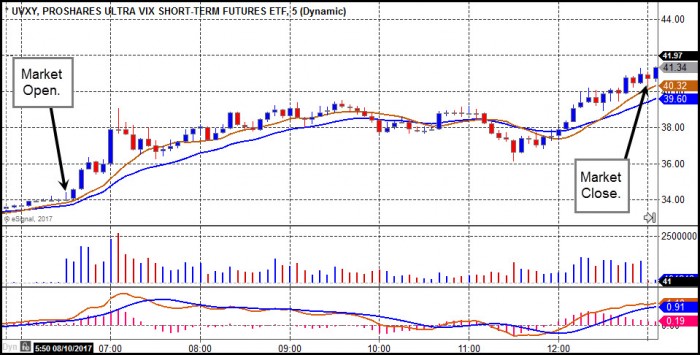
Below we see a very clean move in the UVXY on August 8th as the NASDAQ was pushing to new highs. This would show up as the second arrow from the right on the NASDAQ Composite Index daily chart above. As the market churned around near the highs for most of the morning, the UVXY 620 chart actually flashed a MACD cross and long entry just after 8:00 am my time. The UVXY then bounced around for a while, but never dropped much, if at all, below my entry at that point. Two hours later, the 620 confirmation occurred when the moving averages cross and held up all day.
There was one MACD cross to the downside at around 10:40 a.m. which would have caused me to take profits, but another MACD cross to the upside occured near noon, triggering another long entry. Right into the close the UVXY then spiked producing a 7-8% gain for the day. Of course, this was just a precusor to the 26% move the UVXY had on Thursday, August 10th, and for those who are interested, I would suggest studying the 620 chart for the UVXY on that day.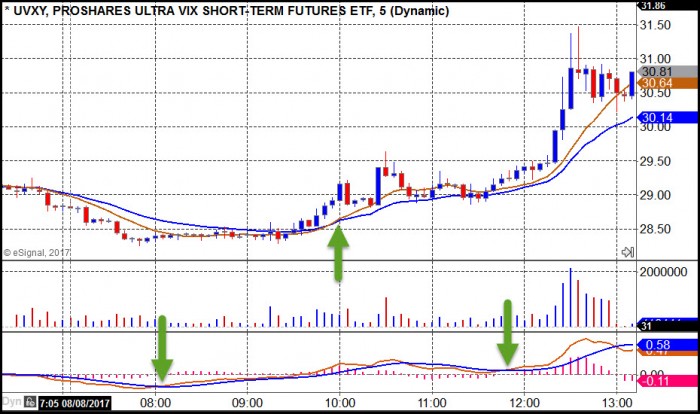
You can study this chart below in conjunction with an index daily chart and five-minute 620 chart to see how this played out in real-time back on August 10th. Note that movements following an intraday long-entry signal tend to be sharp and fast. In this volatile market, I have also noticed that there are usually at least 2-3 entries during the day, often preceded by exit signals. Yes, in case you haven't figure it out already, this is a day-trading method!
This is a very active method that I use to trade the VIX, and requires some courage as well as the ability to put several puzzle pieces together since the 620 chart alone is not intended as a mechanical trading system or "market model." It is a concrete approach that can be effective for disciplined, active traders. Getting carried away with greed when the VIX has a big upside move and chasing it is dangerous! Also, holding the UVXY overnight can be a gamble, much like playing "earnings roulette," so caution is advised. A few times I've been tagged pretty good holding it overnight, while a few times I've benefitted from a morning gap-down, but in this market that is often hard to predict. Meanwhile, I do notice that there are plenty of opportunities to enter a long position in the UVXY during the day.
Keep firmly in mind as you study this that essence of this approach is in finding the lower-risk inflection points that occur when the VIX is near its all-time lows and the general market is making higher highs, not reacting to existing upside jacks. My advice to anyone who finds this of interest, and if they are an experienced trader, is to first paper trade the UVXY using the 620 chart to get a feel for how it works. The 620 chart is very simple to set up. Also, in our live VoSI Market Webinars I frequently discuss how the 620 chart can be used in a variety of ways, including using it to find entry points on the long side when a stock is pulling back to support, or entry points on the short side when a stock is rallying weakly into potential resistance. Members interested in learning more about the 620 chart and its application can subscribe to that webinar service
To review how to set up a 620 chart: it is a five-minute intraday candlestick chart with a 6-period exponential moving average (orange) and a 20-period exponential moving average (blue) on the price data portion of the chart, and below that a MACD with a 6-period "fast" line (orange) and a 20-period "slow" line (blue). The settings that I use on my eSignal charts for the MACD indicator is (6,20,10,C) and also shows a MACD histogram so I can get a better sense of when things are getting "stretched" to the upside. Note that on August 8th one could have extracted a better gain by selling into the MACD upside stretch that occurred about 1/2-hour before the close as the MACD historgram lines became little "skyscrapers."
I would also caution that this might work well in this environment simply because of the historically (some might say ridiculously) low VIX levels seen during what is basically a perpetual motion robo-market rally. In my view, the extremely low VIX puts your risk at a minimum, while the tendency for the VIX to “decompress” and rocket to the upside makes the risk-reward equation for this type of trade very favorable. My work trading the VIX via the UVXY illustrates how one can adapt to a specific market environment to find opportunities and methods of capitalizing on these potential opportunities. It may not work forever, but all I know for certain is that it has worked very well in the current choppy, news-oriented, and volatile market environment that we've seen during the UVXY's 2017 "Summer of Love."Adapt or die!