
Offbeat Ideas and Commentary from the Depths of Gil's Trading Notes
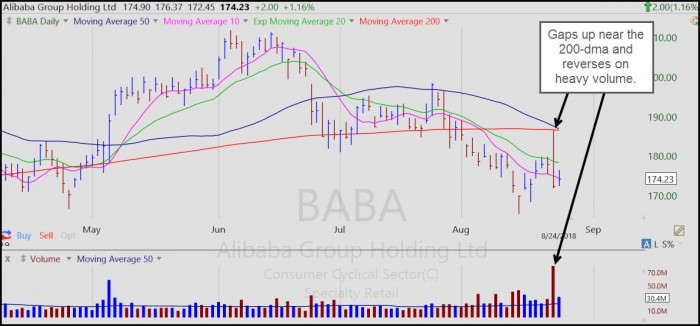
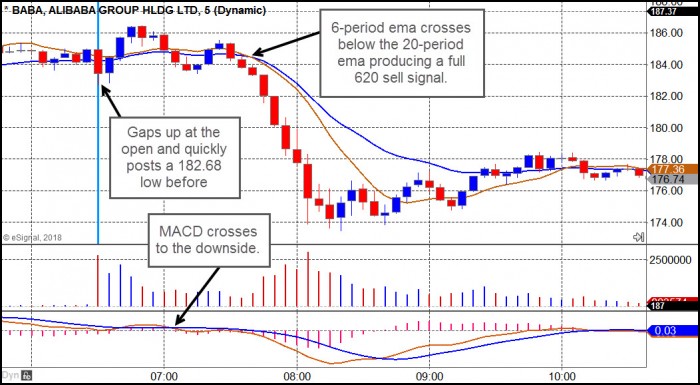
On Thursday morning I sent out a report commenting on Alibaba's (BABA) potential bottom-fishing buyable gap-up (BFBGU) after it reported earnings that morning. The stock opened at 185, and then pulled down right after the bell to post a low at 182.68 over two points lower. The rules for playing any buyable gap-up, whether normal or of the bottom-fishing variety, are simple. Once the stock attempts to post a firm intraday low, one can take a position. However, if the stock breaks below that low, perhaps allowing for another 1-2% below that low, one should exit the position. The stock may set another low later in the day, so it is necessary sometimes to be prepared to enter, exit, and possibly enter again. BGUs are not clear-cut situations, and one should never mindlessly buy a gap-up move without allowing the stock to form what is at least a temporary low. Doing so leaves no reference point for a quick exit if the BGU turns into a shortable gap-up, or SGU, as I like to call them. BABA ran right into resistance at its 200-dma, reaching an intraday high of 186.50, before turning tail and reversing back to the downside.
The is of course begs the question, how does one know when a gap-up move is a BGU or an SGU? The answer is that you cannot know beforehand. You can only monitor the stock in real-time and act accordingly based on the evidence on the screen. I use the five-minute 620 chart, something I discuss frequently in our live webinars, as a tool in helping to determine this. Note that once BABA set the 182.68 low right after the opening bell, it then rallied, and both the MACD and the moving averages (orange 6-period exponential above the 20-period exponential) were in a bullish configuration. About 30 minutes later, the MACD began to cross to the downside, indicating that the stock was wavering, although at that point it was still holding above the initial 182.68 low and the 6-period line was still above the 20-period line. Another 25-30 minutes later, the 6-period e.m.a. crossed below the 20-period e.m.a., producing a full 620 sell signal, even before the stock dropped below the initial 182.68 low. At that point, I am quite willing to reverse my long position to a short position, with the idea that a new, firm intraday low in the stock could have me flip back to the long side in a hurry. Flexibility, and plenty of intraday buying power, is key. Once the full 620 sell signal set in, however, BABA just plummeted lower.
One other key factor to take note of here on the daily chart is that BABA opened just below the 200-dma, and then rallied right into. When it could not clear the line and instead reversed back down from it, "peeling" away from the moving average, that was another clue that the BGU may be questionable. Now, had BABA been able to quickly clear the 200-dma, one could have then used the 200-dma as a reference for an even tighter downside stop (abandoning the prior 182.68 low as a selling guide). So, there was a lot going on here on the 620 and daily charts, and traders need to be aware of how all of these can play out as they attempt to put clues together in real-time. It's not necessarily easy, and anyone who thinks that a gap-up move is an automatic buy does not understand the basic rules for handling a BGU. Overall, I think BABA is a great example to study as a BGU that morphed into an SGU, and very profitably so for those who are alert, knowledgeable, and able to exercise flexibility in their entries and exits as necessary.
This past week we saw Netflix (NFLX) pull some interesting Ugly Duckling action as it posted three, count 'em three, undercut & rally (U&R) moves through three prior lows in the pattern. We discussed that possibility in last weekend's Focus List Review before it occurred, and so members should have been attuned to that possibility this week. Not only did NFLX post three U&R long entries, it also posted two bottom-fishing types of pocket pivots, one at the 10-dma and one at the 20-dema.
So if a broken-down big-stock market leader like NFLX can rise up from the ashes of a post-earnings gap-down blow-up, can another busted big-stock leader like Facebook (FB) do the same? I mentioned this in Thursdays short report as a possibility to be on the lookout for. I should emphasize that I don't bring this up as a way of throwing darts at something without some sort of rationale. There is a method to my madness, and we can break this down on the daily and weekly charts to get an idea of just what I'm thinking here. As always, there are no guarantees, but the fact is that in this market Ugly Duckling/VooDoo type set-ups work, especially when stocks seem hopelessly shattered.
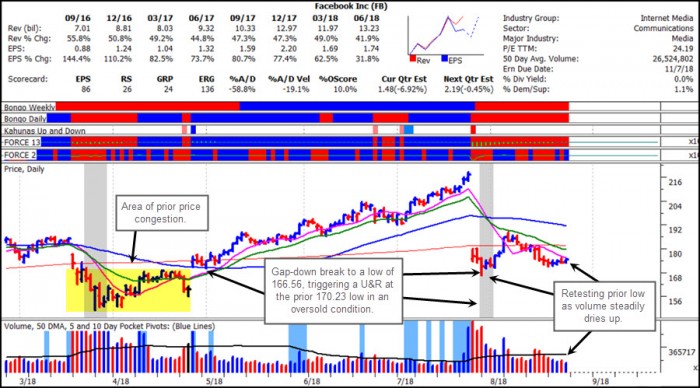
What we should note on FB's daily chart is that the post-earnings gap-down took the stock below a 170.23 low from early May and right on top of a prior area of price congestion. This area of price congestion likely served as at least a minor area of support, and in fact it helped to trigger a U&R move back up through the 170.23 May low. That led to a rally up into the 20-dema, where FB morphed back into a tactical short at the 20-dema. It then dropped back down near the 170 price level. Now here's the trick: on that descent from the 20-dema, FB got as low as 170.93, so it never broke below the prior 170.23 May low. Hence, that U&R long set-up remains in force on a technical basis, using 170.23 as a tight selling guide. Now, should the stock drop below 170.23, then we would be on the lookout for a possible move below the 165.56 low of late July after earnings. That could trigger another U&R, so should be watched for. Note that we are working though various scenarios here, but at this precise moment in time the primary actionable set-up exists just above the 170.23 May low.
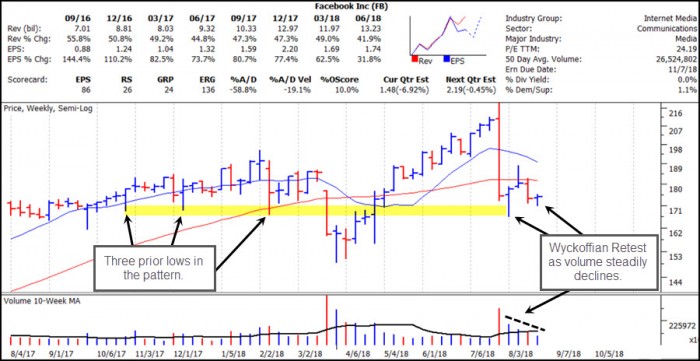
If we drop back to a longer-term view on the weekly chart, we also note that the breakdown after earnings found support along three major lows in the pattern from late 2017 and early 2018. The ensuing rally reversed at the 40-week moving average (red moving average), and the stock has drifted back towards the low of four weeks ago. This pullback towards the prior low has occurred as volume steadily declines, creating a Wyckoffian Retest type of set-up. When combined with the 170.23 May low as a U&R trigger point, this is actionable right here, using the 170.23 price point as a selling guide. If it fails, then we would turn our attention to the 166.56 low of four weeks ago on the weekly chart as the next potential U&R trigger point for FB.
This is how I work through potential scenarios for Ugly Duckling set-ups in busted leaders that look as if they've reached a point of no return. My analysis of NFLX in last week's Focus List Review turned out to be spot on. The question now is whether I can go 2 for 2 with FB. This example might also help you understand the salient points of analyzing a big pullback in a former big-stock market leader and institutional favorite, so can be applied to other names you might be interested in currently as similar situations.