Offbeat Ideas and Commentary from the Depths of Gil's Trading Notes
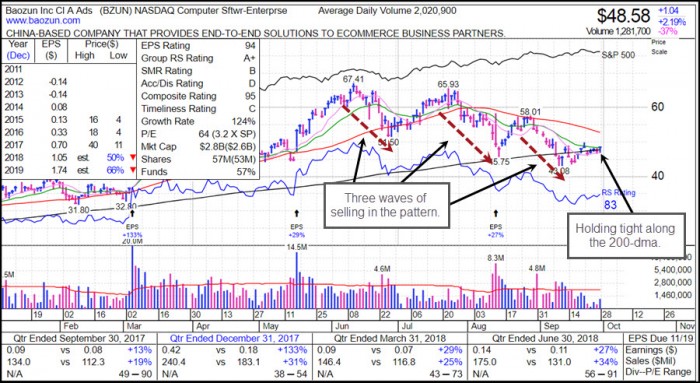
A couple of weeks ago I discussed Baozun (BZUN) as a "three-waves-down" type of set-up as it plumbs the lows in its pattern. We can also see that it has executed a U&R long set-up as it pushed abobve the prior 45.75 low in the pattern from roughly mid-August. It is now hanging tight along the 200-dma and therefore in a low-risk entry position here using the 200-dma as a tight selling guide. One can also give the stock a little more room by implementing the 45.75 prior low as a wider selling guide, although this is about 6% lower. I would prefer the tighter of the two selling guides, but that's just my own risk-preference.
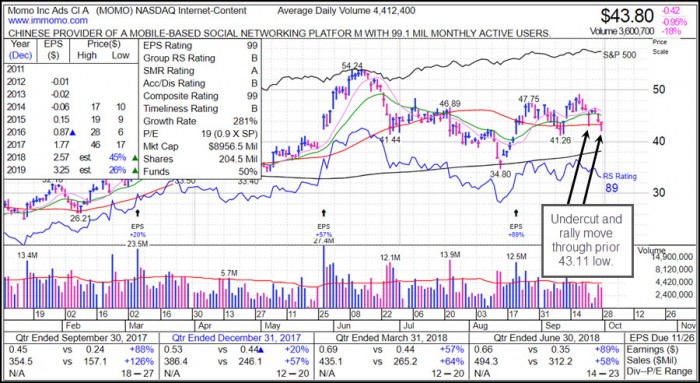
Chinese names like BZUN have been eaten to a pulp, but Momo (MOMO) has been holding up relatively better than most. If BZUN can recover from its current "Ugly Duckling" state than its cousin, MOMO, may also have a shot at doing so as well. At the very least, despite the volatility in the stock over the pastsix weeks, MOMO issued a concrete and actionable long entry signal on Friday on a U&R trigger. That occurred on an undercut of the 43.11 low of tis past Monday and a subsequent rally and close on Friday at 43.80. Thus, risk here is minimal, less than 2%. There is always the outside chance of a test of the prior 41.26 low of over two weeks ago which could trigger another U&R if this current U&R fails.
Since we're traveling in the realm of the Ugly Duckling, let me show you one of the ugliest of the butt-ugly chart patterns on my radar screen. I keep a special watch list of what I call "Ugly Ducklings" since this market often shows a tendency to rally some of the ugliest patterns right when it appears that all is lost. In this spirit, I would refer you to the U&R long set-ups we saw in many names this past Monday, when it looked like the market was going to get into serious trouble, but the NASDAQ and the NASDAQ 100 Index, which were leading on the downside early in the day, reversed to close up on the day. Such is the way of the Ugly Duckling in this market.
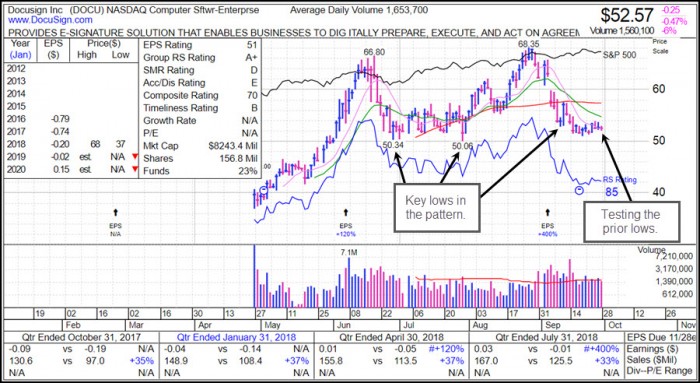
Here we see the daily chart of Docusign (DOCU) as it plumbs the lows of its last cup base formation. The nearest lows is the 52.83 of September 11th. The stock closed 26 cents below that low on Friday, and has already logged a couple of failed attempts at retaking that low. The other two lows that may be more important are the 50.34 low of June 28th and the 50.06 low of July 30th. The stock has tended to be quite volatile but notice how the more current price action over the past two weeks has tightened considerably relative to the rest of the pattern. While there is nothing actionable here with DOCU right now, it is something to watch. Also, it serves as an example of how one can assess and evaluate the Ugly Duckling potential of other formerly hot, but now broken-down stocks that might be trying to find their feet again.
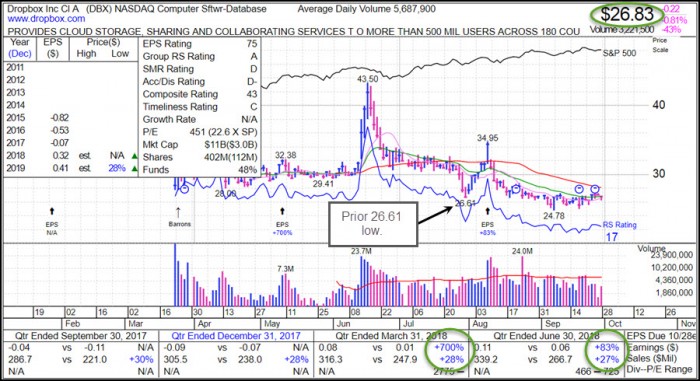
A couple of other names to look at within this Ugly Duckling context are Zuora (ZUO) and DropBox (DBX). The daily chart of DBX is shown below, and you can see that it is attempting a U&R back up through the prior 26.61 low. The stock is also showing strong earnings and sales growth, which in and of itself is nothing to get excited about, since its the technicals that determine whether you're making money or not. DBX has had some fits and starts off its lows over the past couple of months but no sustainable trends have developed. The longer it spends down here, however, without breaking down, then the higher the odds that it may be building the lows of a new base. The critical test will be whether this current U&R entry is confirmed by a strong move back up through the red 50-day moving average.