Offbeat Ideas and Commentary from the Depths of Gil's Trading Notes
"Lions and Tigers and Bears, Bulls, and Ducks, Oh My!" - Dorothy in the Wizard of Oz, if she were an investor in 2017.
The Summer of 2017 has been an extremely volatile period for the market that has frustrated and teased both the so-called "bulls and bears." Speaking for myself, I never fall into one camp or the other, no matter what the market is doing. As an OWL(TM) Trader (O'Neil-Wyckoff-Livermore) I subscribe to the Livermorian Ethic whereby one does not consider themselves to be on the bull side or the bear side, but the right side. The long, hot summer of 2017 has been one period where adopting a rigidly bullish or bearish view might not work so well, and in my view has required a balanced, objective approach that can take advantage of the volatility rather than succumb to it.
The NASDAQ Composite chart below illustrates this volatility. The market environment during the Summer of 2017 has been characterized by two, grinding rallies to the upside, each of which was followed by a period of wild chop 'n slop. During each of these "Chop Zones," the heavy volume selling off the peaks looked quite bearish, and it was true that for certain leading stocks they were death knells.
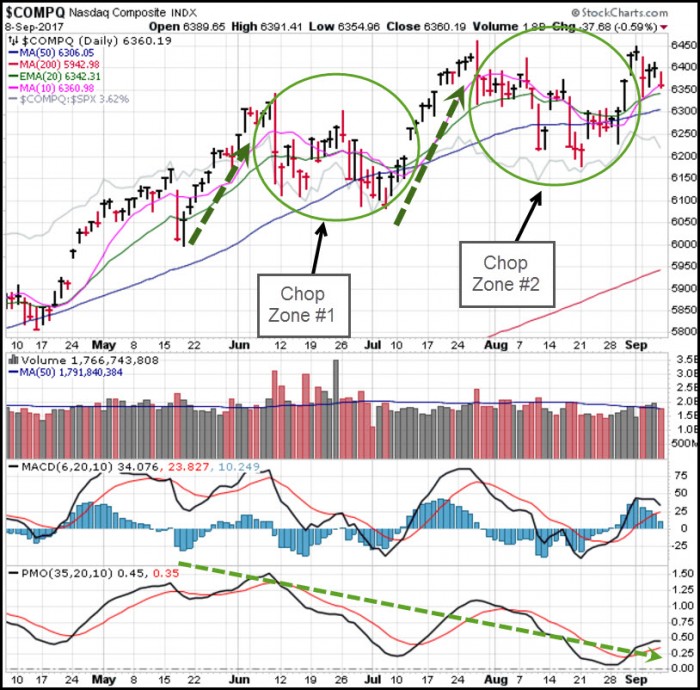
We can see also that there was an initial sharp, downside break in the market in mid-May, after which the first grinding rally began. Now the indexes look like they are in position for another grinding rally like we saw in late May/early June and again in July. This would be the third such grinding rally, should it occur. One oddity here, that may be a cautionary sign here is that as the NASDAQ has chopped its way to another all-time closing high, the Price Momentum Oscillator (PMO) has diverged by making lower lows and lower highs all summer long.
But wait a minute, this is a QE-infused market environment. So as the PMO gets "uglier" and "diverges" from the NASDAQ Composite in allegedly bearish fashion, maybe its not even a matter of being bearish, or even bullish. Perhaps it is just "duckish" in the sense that such bearish divergences just mean that the Ugly Duckling is about to appear. Will the Ugly Duckling join forces with the Rule of Three this time, such that the third summer breakout to new highs actually leads to higher highs? Or does this latest move to new highs just become another shorting opportunity? We shall see.
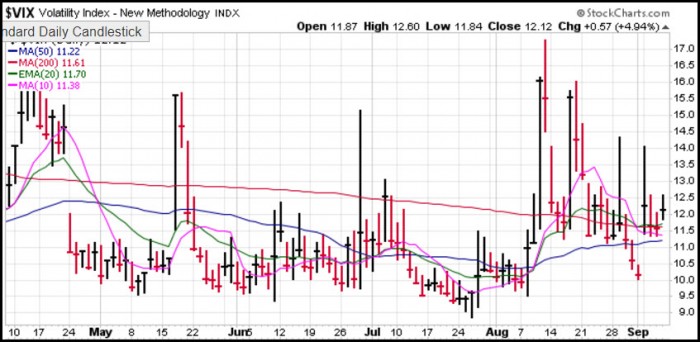
The volatile summer period has certainly lent itself to trading the VIX using my 620 Method for surfing the market with the Pro-Shares Ultra VIX Short-Term Futures ETF (UVXY). I discussed this method in detail about three weeks ago in a prior VooDoo Report, so I won't waste any time explaining it here, but instead refer the reader to that report which is available in the report archives. We can see that with the VIX near historical lows all summer long, nimble traders were presented with several very favorable risk-reward plays in the UVXY every time the VIX spiked to the upside.
When I look at this daily chart a couple of things are quite obvious to me. The first is that with the VIX near all-time lows, risk-reward is highly skewed is towards trying to catch the sharp upside spikes. I don't think it takes a genius to see that the biggest and fastest moves (hence the highest time-value moves) in the VIX occur on the upside off the lows, and then again on the downside right after a big spike when the VIX often plummets back to earth in a just a couple of days, maybe a little more. At least that is how it has worked for the past few months.
Therefore, as I see it, shorting the VIX near all-time lows is a high-risk proposition that exposes one to getting hit badly when the VIX has spiked each time during the summer. The high time-value play is looking for inflection points to the upside and then trying to catch those using the 620 intraday chart as your guide. In the Summer of 2017 this has worked well, and we can see that the month of August in particular gave nimble UVXY traders four strong long opportunities at the rate of about one per week. For anybody who has been using the 620 method to trade the UVXY, your next task is to figure out how to use the 620 method to short the VIX when it plummets to the downside after a big upside spike.
All of this volatility has had varying effects on individual stocks, with some acting as if the market is in a smoothly-trending upside jaunt, while others display symptoms of severe onset schizophrenia. An example of more smoothly-trending names would be Facebook (FB), Alibaba (BABA), or Weibo (WB). Both FB and WB, for example, never violated their 50-dmas all summer long, while BABA almost violated its 20-dema on an intraday basis on August 11th, but quickly found its feet. Of course, I use the term "smoothly" very loosely here, as we can see on FB's daily chart that the stock has certainly had its ominous moments. Note how in June alone the stock had two failed moves to new highs that dipped below the 50-dma but never technically violated the 50-dma. Remember that in order for a technical violation to occur, the stock must close below the low of the first day it closes below the line. So back in early July, the second time FB dipped below the line, FB closed below the 50-dma but never moved below the intraday low of that July 3rd price bar.
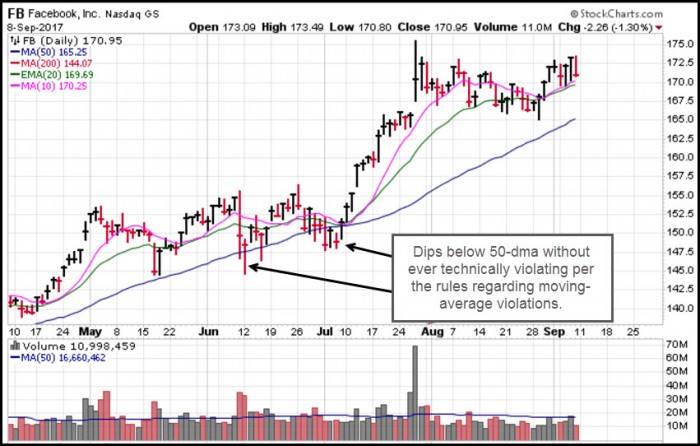
Anyone who was in the market in June and watching FB's failed moves to new highs could have easily taken this as a signal for perma-bears to come out of hibernation and prepared to play a longer-term market correction or even bear market. After all, you had other big leaders busting hard at the time, providing "confirmation" to the general market weakness. But, as has often been the case in this QE-infused market, FB found its feet each time and eventually broke out to new highs after doing its best to shake out any weak and even not-so-weak hands in the mid-May thru early July period.
Another market leader Apple (AAPL), which is often cited by the media as a mainstay of the current market rally given its most recent move to all-time highs, hasn't had such an even ride, however. Even though AAPL has made new highs over the last month or so, it was hit hard in early June with the market. At the time, as with FB, AAPL's demise in sync with the market breakdown in early June had all the makings of a market top. But no such luck. The stock simply built an "L" pattern and then turned back up to new highs to complete the classic "LUie" formation so typical of this QE market.
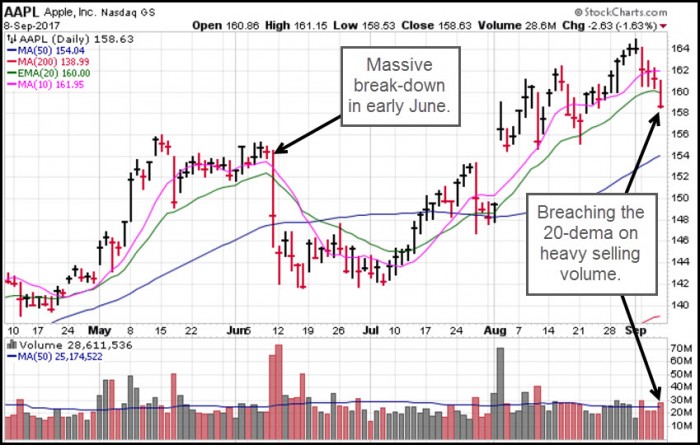
Now AAPL is breaching its 20-dema again as volume picked up on Friday and came in at above-average. This might put the stock into play here as a short using the 20-dema as your upside stop, in anticipation of more downside to the 50-dma. In this market it has proven better to anticipate moves from possible inflection points rather than to become comfortable placing a trade once a move is "confirmed." Often, by that time, the stock is ready to rally, and this phenomenon has given rise to the use of the "LUie" and "U&R" long set-ups in this market, which are decidedly anti-O'Neil, but very much a part of the methods of both Wyckoff and Livermore.
Perma-bulls in Momo (MOMO) have suffered badly if they didn't heed the warning signs evident in its charts before it gapped down after earnings in the latter part of August. That gap-down took the stock down to the 200-dma where it bounced hard, and then moved sideways four four days into Thursday of this past week, when volume dried up sharply. I wrote in Thursday's VooDoo Report that this could set up an Ugly Duckling type move higher from there, and in fact that did turn out to be the case on Friday as the stock moved up a buck or so early in he day. But at that point it just ran into the 20-dema and turned tail, closing down for the day and near the lows of its intraday range on higher volume. So while MOMO was a nice one-day wonder trade as a buy on Thursday, one could have sold into the Friday morning move to the upside right at the 20-dema and flipped to the short side.
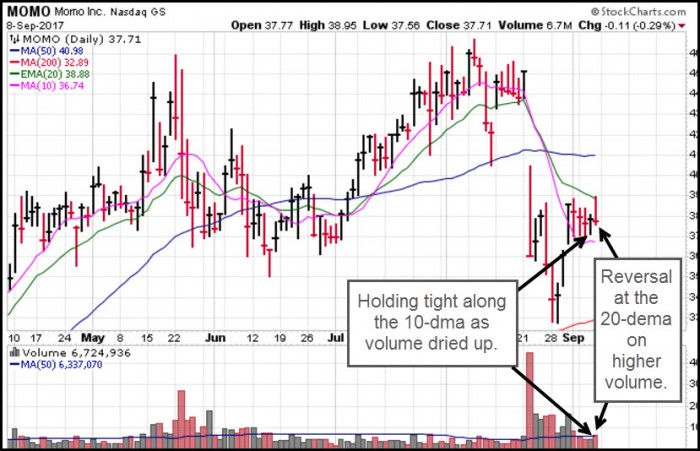
It's hard to say where MOMO will go from here, but objectively it has now set up over the prior two trading days as a long and then a short within the time span of less than two entire trading days. JD and VEEV, a couple of other Ugly Duckling situations I discussed in Thursday's VooDoo Report didn't pan out at all to the upside as I was looking for them to when I wrote that report. JD moved back below its 10-dma instead of continuing to hold tight along the line on Friday, and VEEV broke below the 57.21 intraday low of Thursday on the potential Wyckoffian Retest that wasn't.
Another stock that looked like it might try to go higher after Thursday, in this case after posting a subtle pocket pivot at the 50-dma on Thursday, was Tesla (TSLA). But look what happened here. All the pocket pivot did was take the stock off the 50-dma and just above the 20-dema on Thursday. On Friday, the stock gapped down slightly at the open and then proceeded lower as buyers stepped aside. By the close it was back near the 50-dma, where it started the day before.
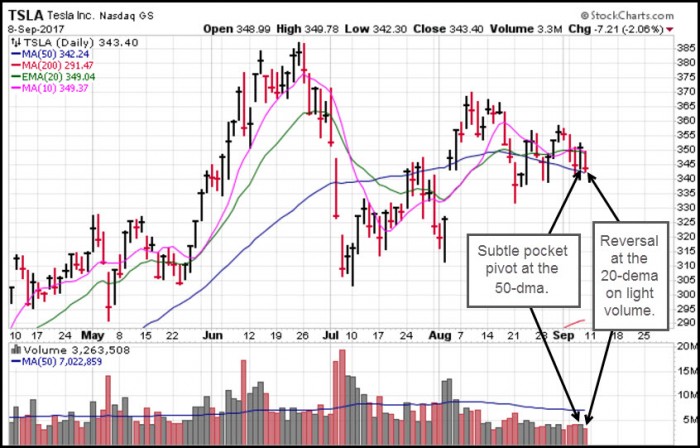
This could be buyable here on the basis of Friday's light volume pullback to the 50-dma, or it could end up busting the 50-dma altogether, triggering the stock as a short-sale at that point. The reality for TSLA, however, is that the stock has just been chopping around like the market for most of August, and remains in an unresolved state on its chart.
Trading the UVXY using my 620 method has been one way to work the chop in this market, but it is a volatile beast that requires nimble feet if one is going to trade it effectively. A slower way to use the 620 method is with the index ETFs, including inverse ETFs when the market might be inflecting to the downside on an intraday basis. I end this report by suggesting to those who have looked or actually have traded the UVXY using the 620 method to investigate how this works and might work applying 620 five-minute chart tool to trading leveraged index ETFs like the TQQQ or SQQQ.
2017 might look like a great rally phase for the general market, even with gold out-performing the S&P 500 all year long, but it has been tough on a real-time basis. That's mainly because there are times when the market and leading stocks look so ugly that one has a hard time thinking anything but the worst is coming, and there are times when things are so good you think the market is ready for a parabolic rocket-ride to the upside. But as it turns out, when the ducks have been quacking, its time to feed the ducks and sell into extreme strength. Conversely, when they start shooting the ducks right out of the sky and they begin falling back into the swamp with loud splashes, it has been time to look for signs of the Ugly Duckling emerging from the general market swamp. So its not really a bull or a bear market, but a duck market! Quack, quack.