
The VoSI VooDoo Report
Offbeat Ideas and Commentary from the Depths of Gil's Trading Notes
I've spent a good part of my weekend pouring over charts, trying to get a handle on where this market is headed next. On its face, much of the action looks cautionary, but hasn't quite gotten there in terms of looking downright "ugly." For that reason, it may be too early to invoke the Ugly Duckling, although that did work well on Thursday morning with some of the nice, clean U&R set-ups that worked so well, if only for one- to two-day swing trades. Cycling through my watch lists, I will look at different chart types and formats, including candlestick charts, which are actually my favorite. I noticed that some of the patterns are noticeably cautionary, such as that of Nvidia (NVDA).
A number of you have asked how I could tell that Tuesday was getting a bit frothy on the upside and that it was time to put out some shorts, including a long UVXY position. NVDA's candlestick chart is one of them, given its very current status as a leader that has been on fire since the prior week's post-earnings buyable gap-up and breakout. Notice that on Tuesday the stock formed a doji pattern, with a nearly non-existent candle body, combined with a long lower shadow or wick, depending on your preference of terminology. Together, these form a "hanging man," which is considered a bearish formation if it occurs after a sharp prior uptrend or upside move. In this case, that's exactly what was happening with NVDA on Tuesday. On Wednesday the stock gapped down at the open and proceeded lower all day, resulting in a long red (in this case I've color-coded my charts blue for up and red for down) or down candle with volume heavy.
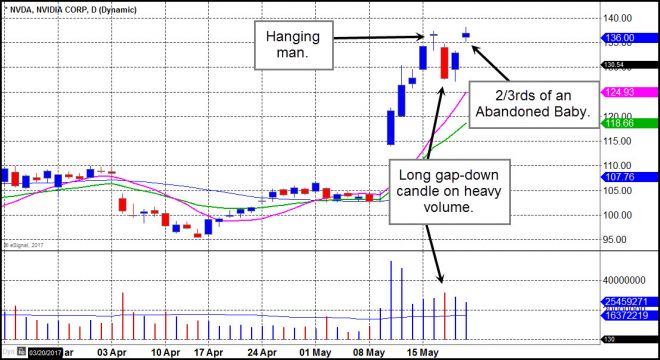
NVDA bounced with the rest of the market, and gapped back up to Tuesday's highs on Friday morning as the market indexes rocketed higher. While NVDA did gap higher at the open, it just churned around all day, creating another doji-like formation, but with short shadows on either end. This now looks like 2/3rds of an "Abandoned Baby" or "Evening Star" formation, which would be completed IF we saw the stock gap down tomorrow. Whatever it does, you can see that it is running into stiff resistance along these near-term highs, which might indicate that the stock needs to back-and-fill a bit more. For that reason, while I don't necessarily consider this a short-sale signal, if I'm looking to buy the stock I'm sure as heck not going to do it up here. I will wait for a pullback.
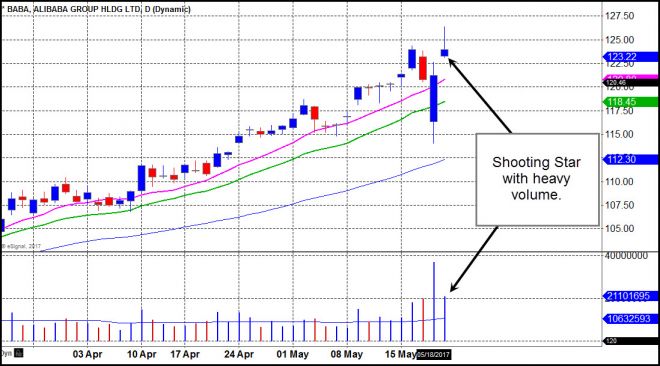
Alibaba (BABA) was a very nice undercut & rally trade, as I first tweeted on Thursday morning and also discussed in the Friday morning Focus List Notes. That U&R set-up took the stock to new highs on Friday, but notice how the stock gapped up, moved higher during the day, but reversed course to close near its opening price. This forms a small candle body with a long upper wick, which is a Shooting Star formation, on heavy, above-average volume. At the very least, this is a "do not buy" signal.
Candlestick charts can sometimes provide meaningful clues, particularly when combined with other factors. Wednesday's sharp price break erased the past 2-3 weeks of profits in a large number of leaders, but many were able to claw back those losses and then some by Friday's close. But is the action unequivocally bullish? The candlesticks say no, in my view, but they are just one piece of the puzzle. If you're a chart junkie like me, run through candlestick charts of every stock on every one of your watch lists, and see what you see.
If you're unfamiliar with candlestick charts and wish to learn more, this is the best source for a complete primer on the topic in my view:
http://stockcharts.com/school/doku.php?id=chart_school:chart_analysis:introduction_to_candlesticks
Given the current turbulent state of the market over the past few days, if I'm looking for things to buy I'm probably going to stick to stocks that are holding in tight formations and which are not extended within their patterns. This brings my attention to anything that is showing "VooDoo" type stillness and serenity, or which may be an Ugly Duckling type of situation.
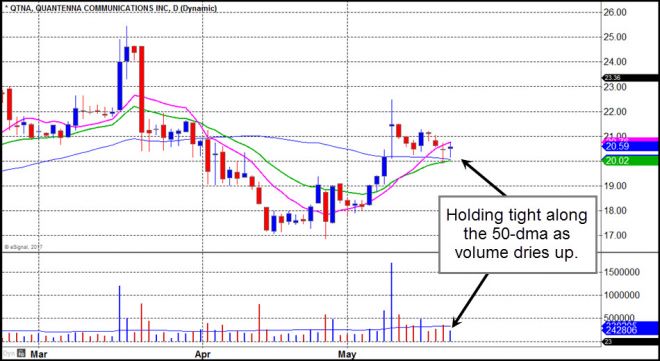
Quantenna Communications (QTNA) is still holding along its 10-day moving average with volume drying up. I mentioned this in a VooDoo Report earlier this past week, and its still hanging tight despite all of the crazy index and leading stock action. Still looks good to me, using the 50-dma as a tight selling guide.
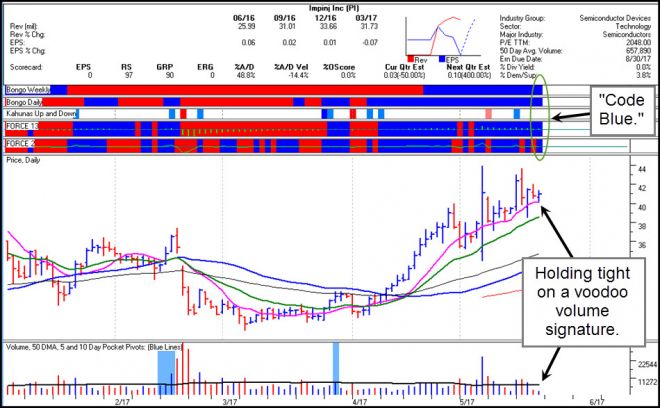
Impinj (PI) was good for a 10%-plus move on Monday after I discussed it in a VooDoo Report that morning. Personally, I treated that as a swing-trade, bagging the profits as it jacked higher and got extended with the market on Tuesday. Since then its been bouncing around in volatile fashion, which is its typical nature, but is now quieting down along the 10-dma with volume drying up to -59% below average. That's what we call "voodoo" territory.
The oil patch is filled with Ugly Ducklings, and market ornithologists know that the Ugly Duckling is one of the few fowl that are capable of swimming in viscous liquids like, well, oil.
Smart Sand (SND) has a distinctly "Ugly Duckling" look to it currently. This is one I discussed about three weeks ago as an Undercut & Rally (U&R) type of set-up. That was actually good for a quick trade on the upside, but not much more than a 1/2 point or so before the stock rolled over again. That's where your tight stop at the prior low comes into play in order to limit risk when playing a U&R set-up. That is in fact the beauty of this type of set-up - risk can be tightly controlled. Now we see SND trying to pull another U&R move, which is currently working, and has more of a "macro" feel to it.
SND was able to get back above the 12.51 low earlier this past week after a failed U&R attempt back in late April. This one is a bit more developed, and there are a couple of differences that may be significant. The first is that this time SND is back above at least two of its moving averages, the 10-dma, and the 20-dema, and the indicator bars at the top of my chart are showing much more blue color, which is positive.
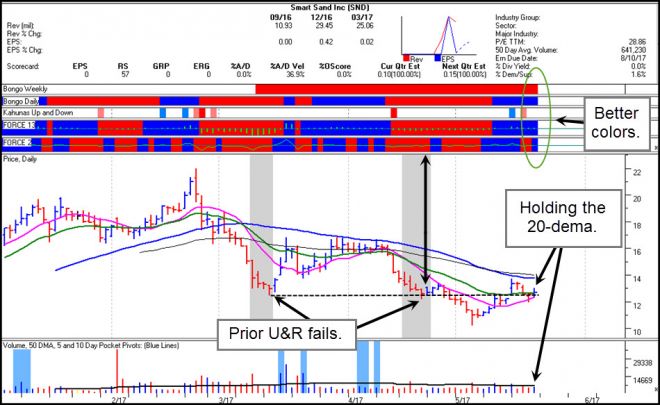
SND, like other oils, has been rallying off of its lows as crude oil prices do the same. If oil can sustain its uptrend, and money is looking for beaten-down merchandise, then SND might work. SND is a fracking sand producer, so it may track along with oil, names like Silica Holdings (SLCA), another fracking sand supplier, and oils like Parsley Energy (PE) Diamondback Energy (FANG), both of which have strong earnings growth and big estimates. SLCA, PE, and FANG also have been names that I've worked on the short side during their declines, but they could be reaching oversold, "Ugly Duckling" positions within their patterns. I don't show charts of any of these here, which I shall leave to you as part of your Sunday "homework."
When it comes to trying to catch profitable U&R moves, the old saying, "If at first you don't succeed, try, try again" is a useful one to keep mind. Mulesoft (MULE) was first discussed back when I first discussed SND in the latter part of April. Back then it was trying to pull a U&R move which did lead to a short upside move. But that didn't blossom into anything significant. So the stock rolled over and undercut two prior lows in the pattern, triggering a nice rally back to the upside. What was different about this second one is that it occurred a bit later in the pattern, so the whole base probably had more time to "ripen" along the lows. After all, MULE only came public very recently back on March 17th.

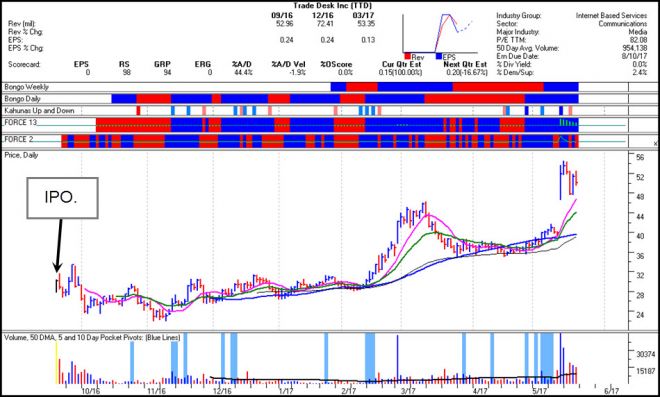
So we can learn a lesson here, which is to remain persistent in tracking these U&R set-ups. I am always interested in monitoring stocks as they form their first base after coming public. Note how TTD, a mainstay of the VoSI Focus List throughout all of 2017 was one such IPO that took a long time to ripen within its base before going nuts to the upside, and it did it twice!
Have a great trading week.