
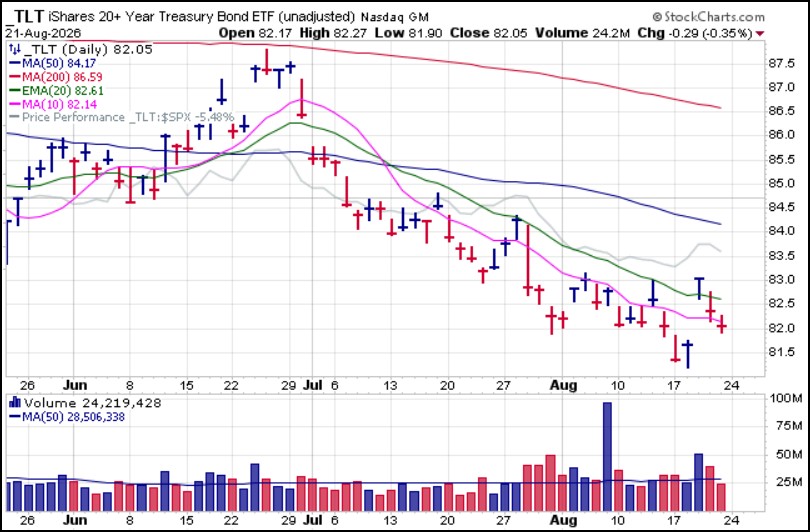
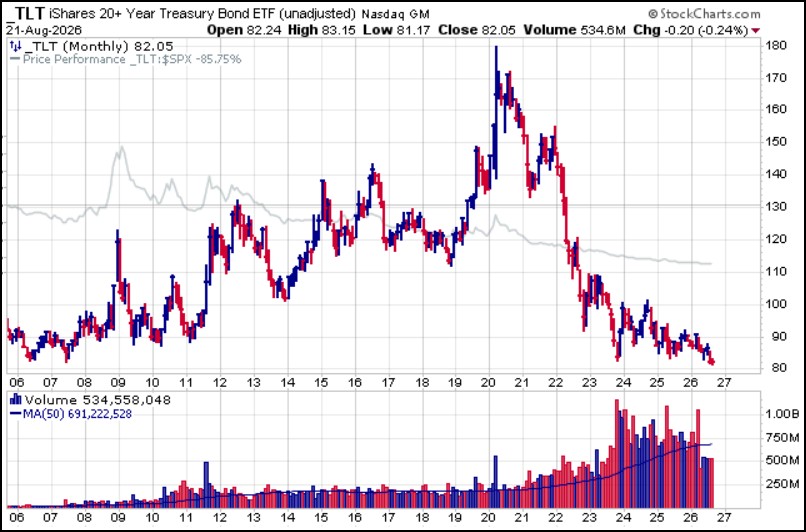
 With the 30-Year Treasury Yield ($TYX) sitting at 20-year highs, Treasury decided to take action in an attempt to suppress yields. This move is likely motivated by the fact that the U.S. National Debt cleared the $40 trillion level this past week with $9 trillion of it set to roll over by year-end. Interest paid on the debt is now annualizing at over $1 trillion. Meanwhile, the government continues to run $2 trillion deficits. The Treasury bond purchases are miniscule relative to these numbers. Thus we would think that unless Bessent and company are able to use such purchases as a type of psy-op to cause a panic rush into Treasury bonds the monthly chart of the TLT may not improve and Treasury may need to ante up.
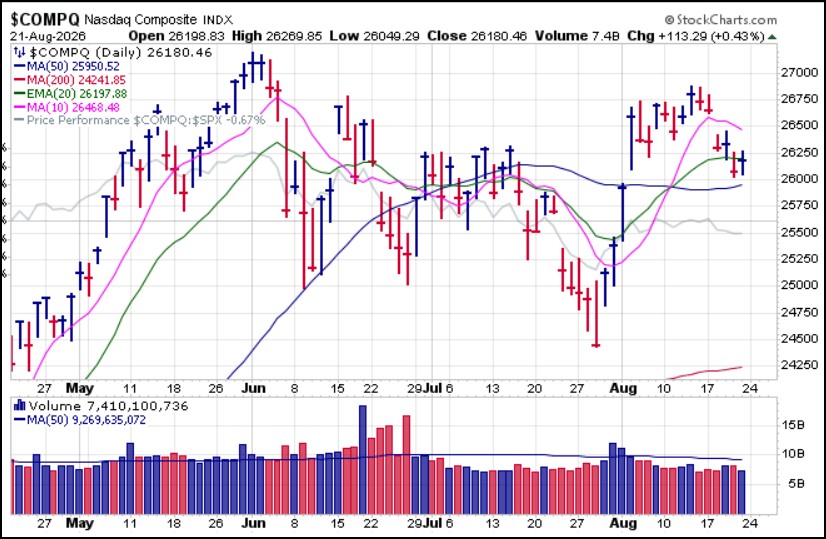
 The reaction from stocks was muted as the U.S. Treasury Dept. announcement was not bald-faced QE, although certainly a variation on the theme of government and/or the Fed intervening in the name of maintaining "orderly" markets. They are, however, not maintaining orderly markets as much as they are attempting to counteract what is in fact market distortion caused by nearly two decades of fiscal and monetary mismanagement. After gapping lower on Monday, the NASDAQ Composite, like the other market indexes, attempted to rally on Wednesday but the rally was just a big stalling and churning affair. A small rally on Friday still left the NASDAQ below 20-dema resistance.
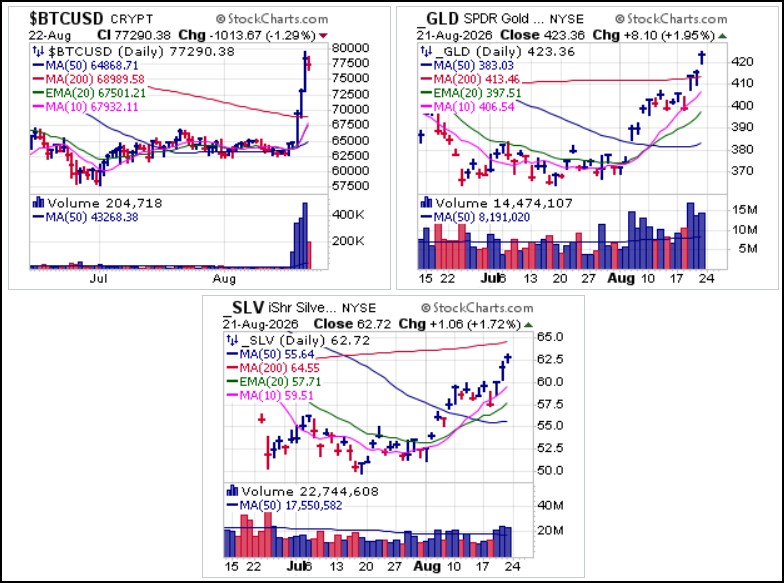
 While Treasuries and stocks failed to respond robustly to the U.S. Treasury Dept. announcement, it did send precious metals gold and silver as well as Bitcoin ($BTCUSD) shooting higher as alternative-currencies in your basic ABD (anything but the dollar) trade. Interestingly, while precious metals started rally three weeks ago, $BTCUSD only got going earlier this week as it posted pocket pivots along the 50-dma. We in fact discussed the possibility of a bottom in $BTCUSD two weeks ago during our live market webinar of August 6rh. The catalyst from Treasury finally kicked King Crypto into gear as natural buyers coming in on the ABD trade combined with a massive short squeeze to produce a big 23% move in $BTCUSD this past week. All of these are now extended and it is a matter of monitoring the first pullbacks to gauge how these trends might play out and determine fresh new long entries.
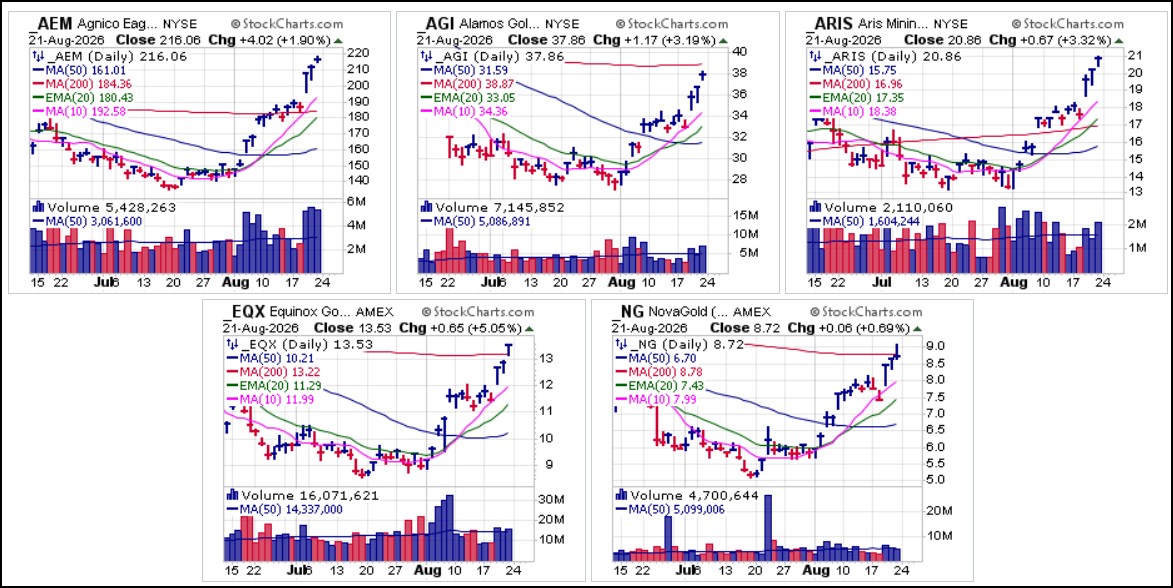
 Gold miners that we reported on two weeks ago as they were posting bottom-fishing buyable gap-up (BFBGU) did respond quite positively to the Treasury announcement, but these were merely continuations of very strong rallies off the late July lows that started three weeks ago. These are all tremendously extended, like the metals, and so monitoring pullbacks from here is required to determine where fresh long entries on constructive pullbacks or constructive basing action come into play again.
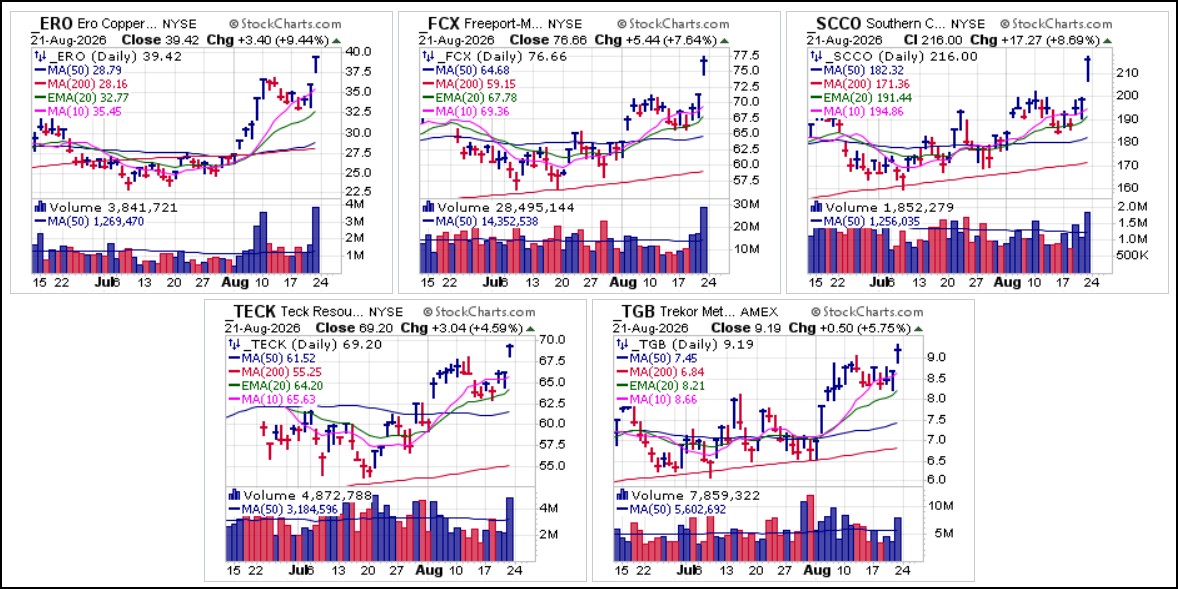
 Copper miners posted very bullish buyable gap-ups (BGUs) and gap-up pocket pivots (GUPPs) on Friday as they all broke out of long price bases extending as far back as April to June. Among the five shown below, Ero Copper (ERO), Freeport-McMoRan (FCX), Southern Copper Corp. (SCCO) and Teck Resources (TECK) posted BGUs while Trekor Metals (TGB), formerly known as Taseko Mines Ltd., posted a GUPP.
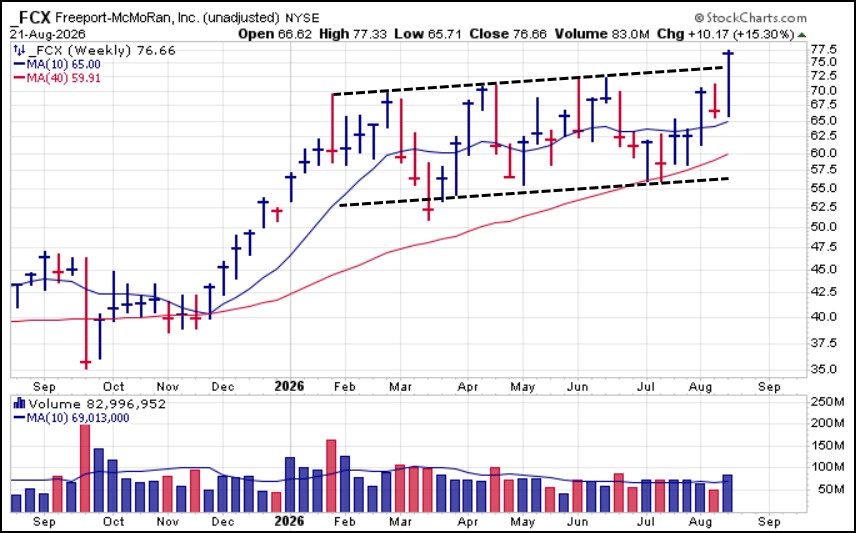
 The Freeport-McMoRan (FCX) weekly chart shows the breakout from a gently rising 27-week base on heavy weekly volume.
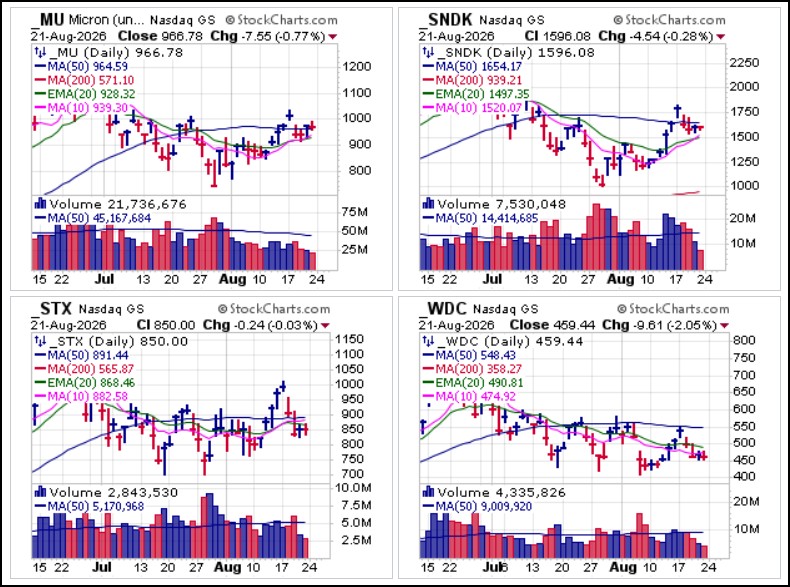
 Semiconductor memory names that we have reported on several times since early April reflected the lack of excitement over the Treasury Dept.'s announcement. In fact, when the news hit Wednesday morning, initial rallies in Micron Technology (MU), SanDisk (SNDK), Seagate Technology (STX) and Western Digital Corp. (WDC) as each stock closed in the red for the day. We note that SNDK may be in a shortable position just below 50-dma resistance while WDC is in a short-sale entry position just below 10-dma resistance. MU is holding above 50-dma support but any break below the line would trigger a short-sale entry at that point. STX may be in a short-sale entry position just below 20-dema resistance.
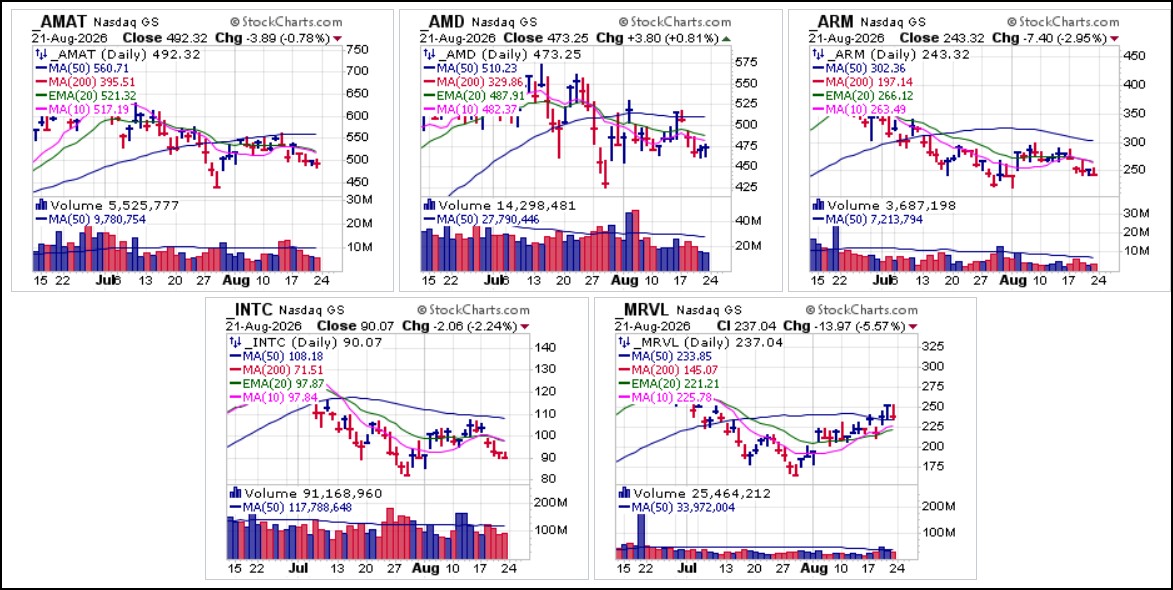
 Other formerly leading but now broken semiconductors we have reported on over the past five months remain in moribund chart positions. Rallies on Wednesday after the Treasury Dept. news turned into short-sale entries at 10-dma resistance for Advanced Micro Devices (AMD), Arm Holdings (ARM) and Intel (INTC) as all three stocks reversed at the line and closed negative. Applied Materials (AMAT) remains well below any moving average resistance while Marvell Technology (MRVL) is holding 50-dma support following a gap-up pocket pivot through the line on Wednesday. Technically that could be treated as a long entry using the 50-day as a selling guide and a flip-point to the short side if it fails to hold the 50-dma.
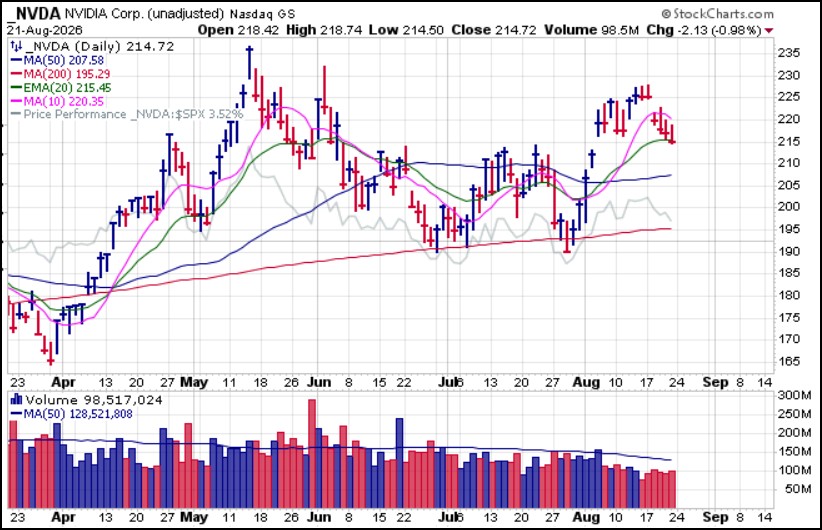
 Nvidia (NVDA) earnings on Wednesday after the close may have its influence on the current complexion of semiconductor group price action. As far as its own price action goes, the stock gapped through the 10-dma on Tuesday, and then reversed at the line on Wednesday before closing below its 20-dema on Friday. Not necessarily propitious price/volume action ahead of earnings, to be frank, but we will see how things play out once earnings are out and whether any high-velocity, high time-value set-ups, long or short, materialize at that time.
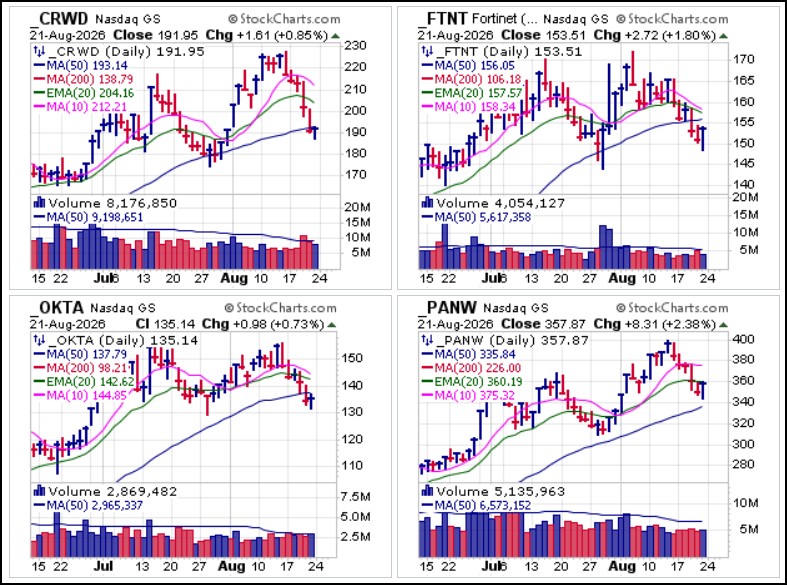
 This remains a difficult market for technology names. Big-stock cybersecurity names which were breaking out two weeks ago have now broken down. On Wednesday, CrowdStrike (CRWD) triggered a short as it busted 20-dema support. Fortinet (FTNT) busted 20-dema for a short entry on Monday and then again at 20-dema resistance on Wednesday as it reversed at the line before triggering a second short entry as it broke below the 50-dma. Okta (OKTA) triggered a short entry at the 20-dema on Monday while Palo Alto Networks (PANW) triggered a short at the 20-dema on Wednesday.
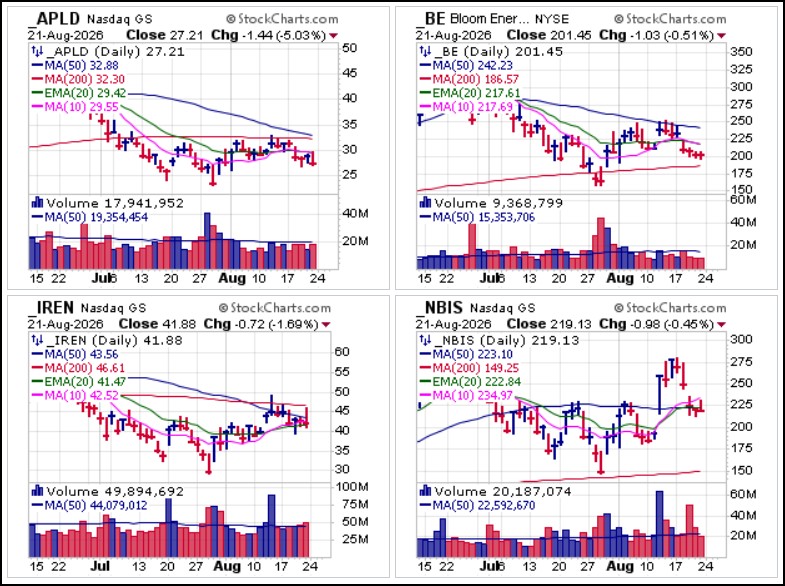
 AI Data Center Power & Infrastructure names we have reported since April also continue to deteriorate. BGUs in Bloom Energy (BE) and Nebius Group (NBIS) that we reported on (in vain, as it turned out) last week have failed, with BE doing nothing more than rallying into 50-dma resistance where it was a short-sale entry on Monday. NBIS began to reverse on Tuesday and then gapped down on Wednesday amid the Treasury Dept. news before triggering another short-sale entry as it reversed at the 50-dma on Friday. Applied Digital (APLD) was a short at the 50-dma on Monday and then again at the 10-dma on Friday, while IREN Ltd. (IREN) gapped up to 200-dma resistance on Friday where it became a short entry before reversing to close below the lower 50-dma and 10-dma.
 Unless one was long gold, silver, or Bitcoin, in combination with gold, silver, or copper miners there was little money to be made. If one was long these areas of the market then it was quite a weekly bonanza on the upside. More testimony to just how random and mixed this market is.
The Market Direction Model (MDM) remains on a BUY signal.