
 Bright spots were seen in gold and silver, however. We reported on a pocket pivot cup-with-handle breakout in the SPDR Gold Trust (GLD) on Thursday, and gold then moved higher again on Friday. Spot Gold hit a peak on Friday morning at $4,352.26 an ounce, just $29.32 away from its $4,381.58 October all-time high before ending the week at $4,297.29 an ounce.
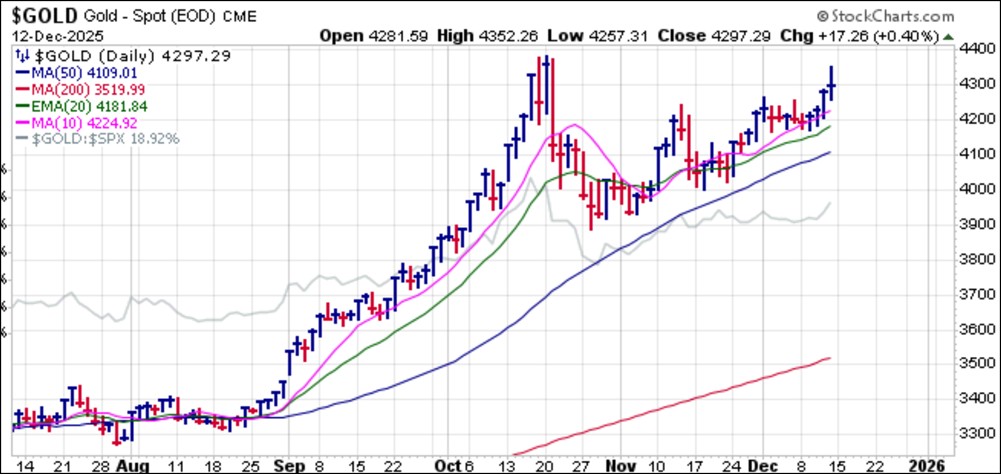 COMEX Silver Futures peaked at $65.08 on Friday morning before silver backed down to close at $62.05 an ounce with Spot Silver ending the week at $62.02. Within the context of the prior two-week move that saw the iShares Silver Trust (SLV) rally over 20% from a cup-with-handle breakout three Thursdays ago, the pullback looks normal. The 10-dma now serves as a reference for near-term support.
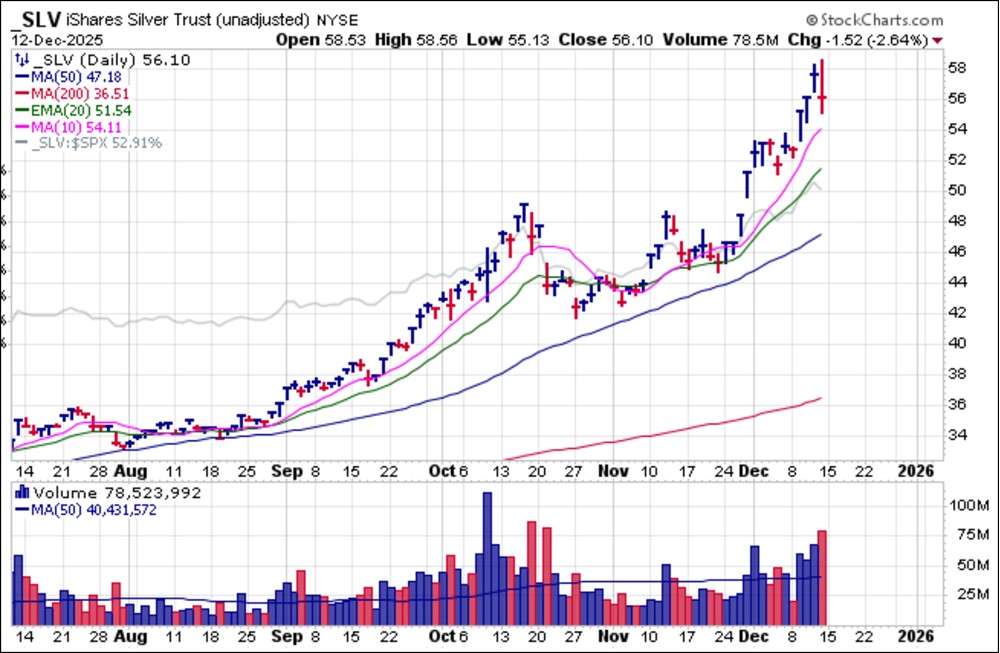 Miners also rallied sharply into the end of the week before running into forced selling on Friday. The VanEck Gold Miners (GDX) and Global X Silver Miners (SIL) both broke out from short flags on Thursday and Wednesday, respectively, before pulling in on Friday. The breakouts, however, remain intact, and may present long entry opportunities depending on how the general market plays out this week.
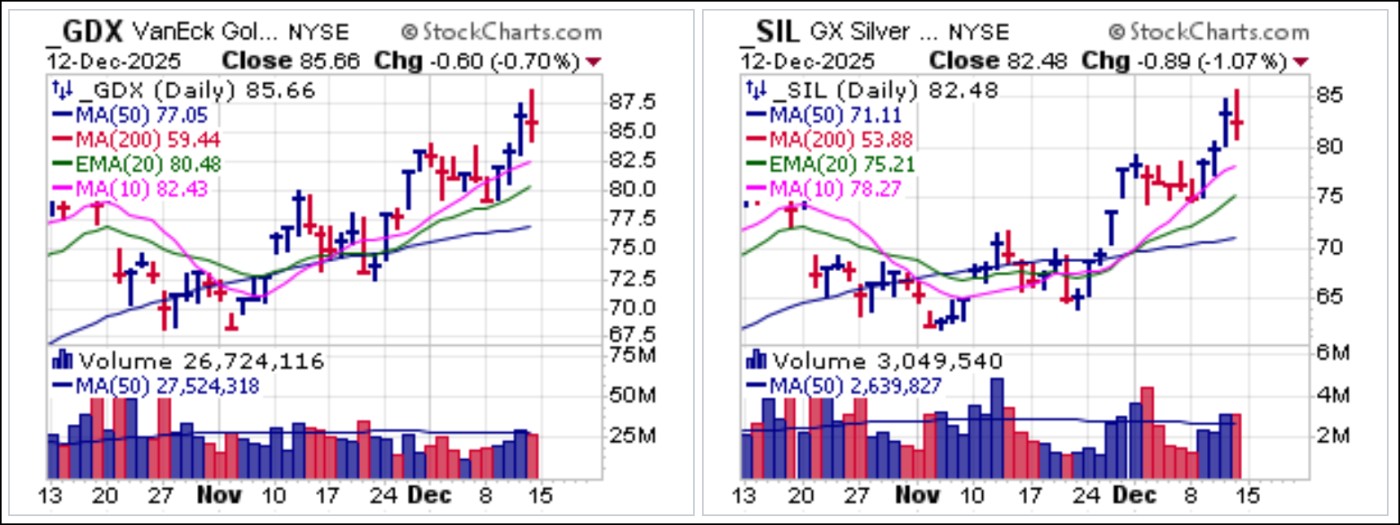 While investors can waste their time insisting that AI is or is not in a bubble, the charts ultimately tell the only truth that is relevant. One by one, we have seen previous AI darlings come apart, and this past week added another one, Broadcom (AVGO) after it reported earnings on Wednesday after the close and then blew up on Friday, triggering a variety of short entries on the way down before closing below 50-dma support. On Tuesday, Oracle (ORCL), which gapped higher after a fluffed-up earnings report back in early September and then promptly topped, reported earnings and gapped lower to test the late November lows. The stock is now down 45% from its September all-time highs. Thus, while the AI Bubble is perhaps not popping outright, it is certainly deflating.
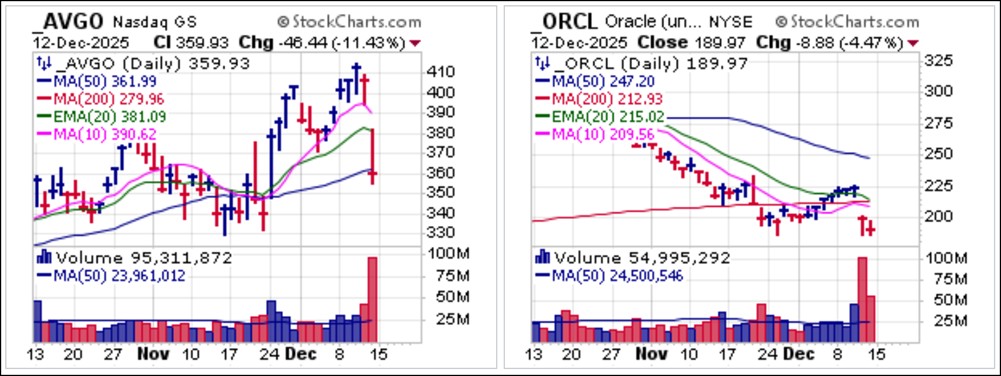 AI darlings Advanced Micro Devices (AMD) and Nvidia (NVDA) also illustrate the severe underperformance of many of the previous AI leaders. Both stocks look quite similar as they sit in bear flags, triggering short-sale entries as they reversed along 10-dma and 20-dema resistance.
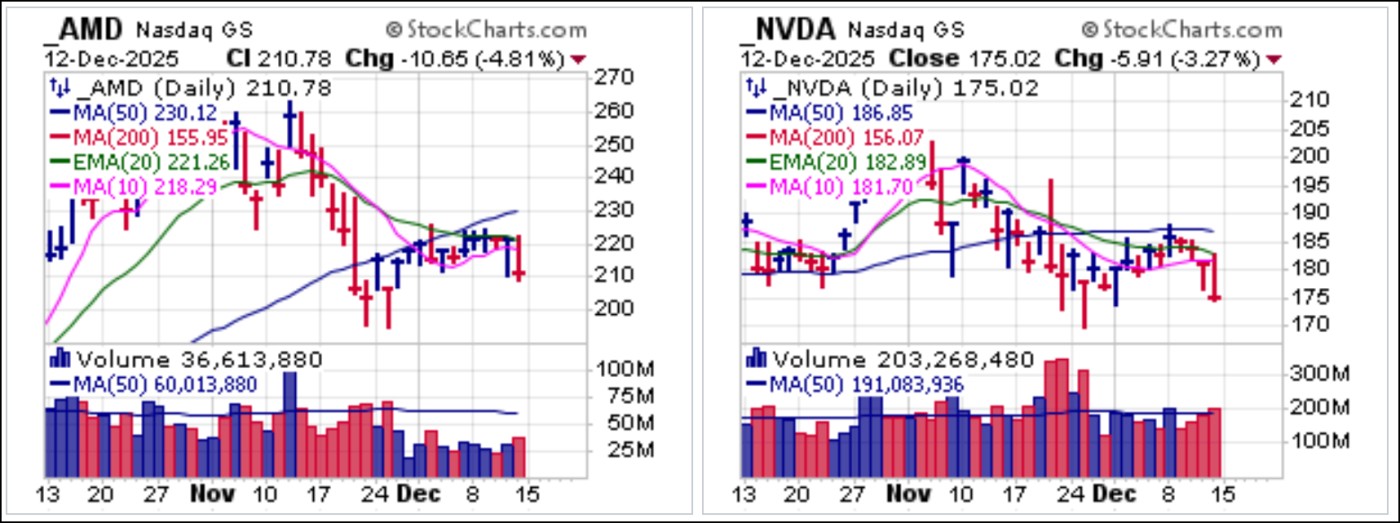 Air continues to come out of Bitcoin $BTCUSD which failed to find any reason to rally following the Fed's 1/4% rate cut on Wednesday, It now looks primed to break out to the downside of its current bear pennant formation as tt has followed the 10-dma and 20-dema lower since late October. Apparently, the "Bitcoin President" that many thought would boost King Crypto to the moon has played out more like the Trumpkin Curse. It may be that Bitcoin, originally intended to serve as a measure of exchange free from debasement outside the purview and corruption of government fiat-printing policies, was itself corrupted once its fate became dependent on the involvement of those same corrupt governments.
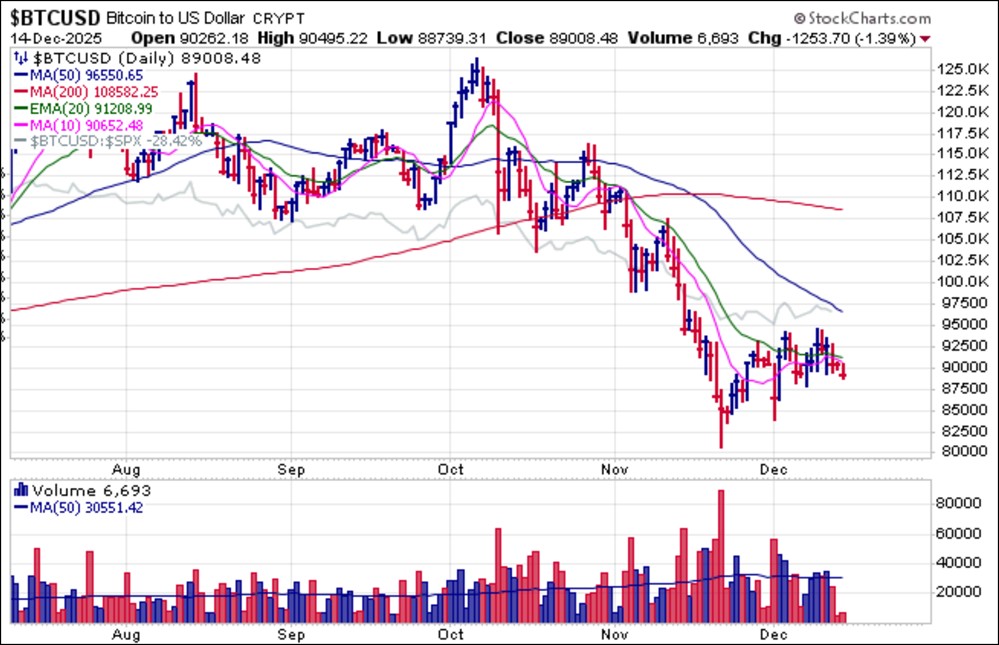 Most long set-ups that we have reported on, outside of the precious metals and certain industrial metals like the coppers, have failed. If the general market continues to sell off this coming week amid a flood of economic data, including the first relatively current Bureau of Labor Statistics jobs report on Tuesday, even those could get dragged down if and as forced selling overcomes the market. Stay tuned.
The Market Direction Model (MDM) remains on a BUY signal but is near a tipping point.