
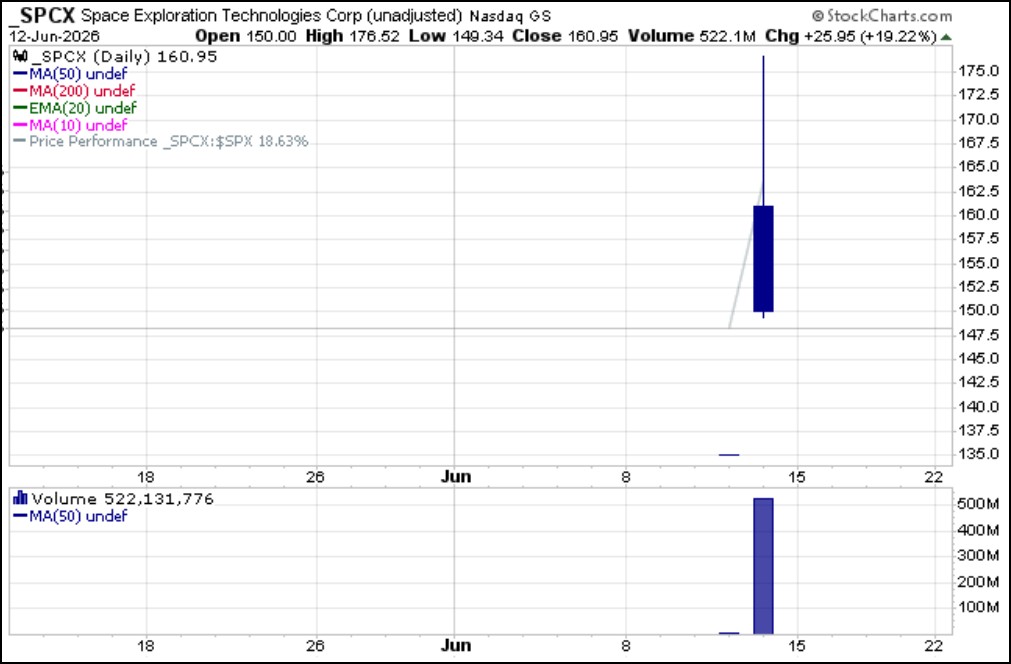
 The big event of the week was the Initial Public Offering of what is now the biggest of the big-stock space names, SpaceX (SPCX). It is now part of an elite group of trillion-dollar market cap companies on the planet, and is even more unique in this regard as the biggest company on the planet that has not even bothered to turn a profit. This first day of trade daily chart below can be considered SPCX's baby picture with a long upper tail giving the action the look of a shooting star.
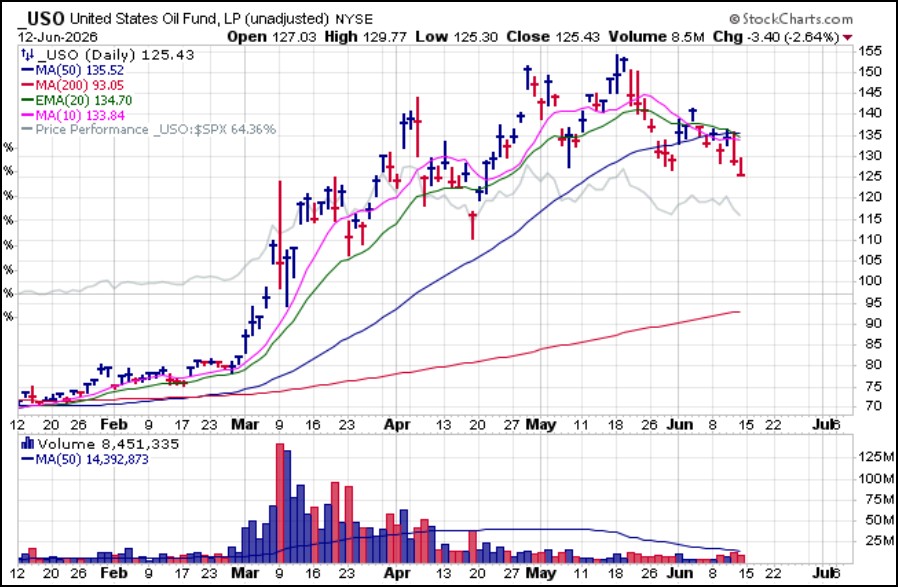
 New Fed Chair Kevin Warsh will preside over his first Fed Open Market Committee meeting this week. While there has been much tough talk about raising rates to counter inflationary pressure from higher oil prices, we note that oil prices have continued to come down. The United States Oil Fund (USO), which tracks West Intermediate Texas Crude, finished the week at its lowest lows since the last week of April. This may keep the Fed on hold, and the market could subsequently read this as a positive for stocks..
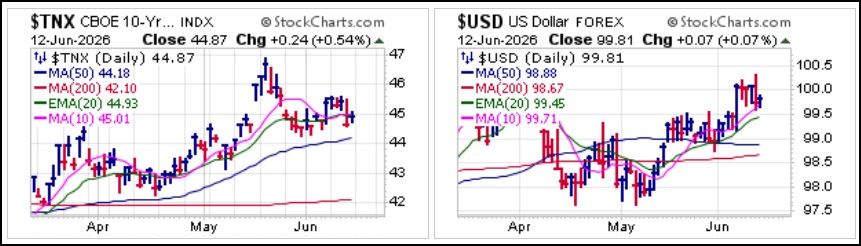
 Interest Rates via the 10-Year Treasury Yield ($TNX) and U.S. Dollar ($USD) also faded on Thursday while holding tight on Friday. Rates have come about 20 basis points since peaking in mid-May while the $USD runs into well-established resistance along the 100.00 level.
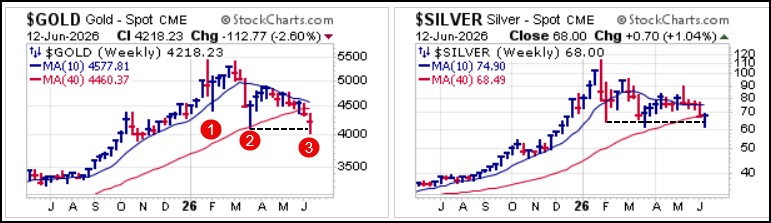
 Gold and silver both undercut prior 2026 lows and rallied to generate U&R long entries. In particular, the weekly chart of Spot Gold ($GOLD) shows three waves of selling with the third wave hitting bottom at 4023.86 on Thursday before rallying to close the week at 4218.23 as it posted a U&R at the prior late March low at 4098.73. Spot Silver ($SILVER) held support at the 60.94 March 23rd low but posted a U&R at the 63.99 February 7th low. However, the IShares Silver Trust (SLV) did in fact post a U&R at its March 23rd low. Like gold, silver shows three waves of selling in what are now 20-week long basing formations following parabolic run-ups in January This all represents a potential turnaround point for the metals and should be watched closely as it develops.
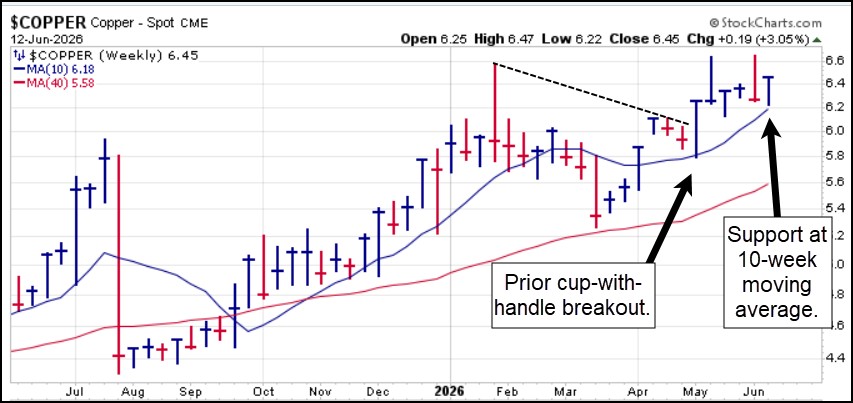
 Throughout much of the market turmoil copper has held steady as it holds a prior cup-with-handle breakout of six weeks ago on the weekly chart below. Spot Copper ($COPPER) ended Friday at a new weekly closing high at prices remain in the mid-$6 range and within two-bits of the 6.652 all-time high.
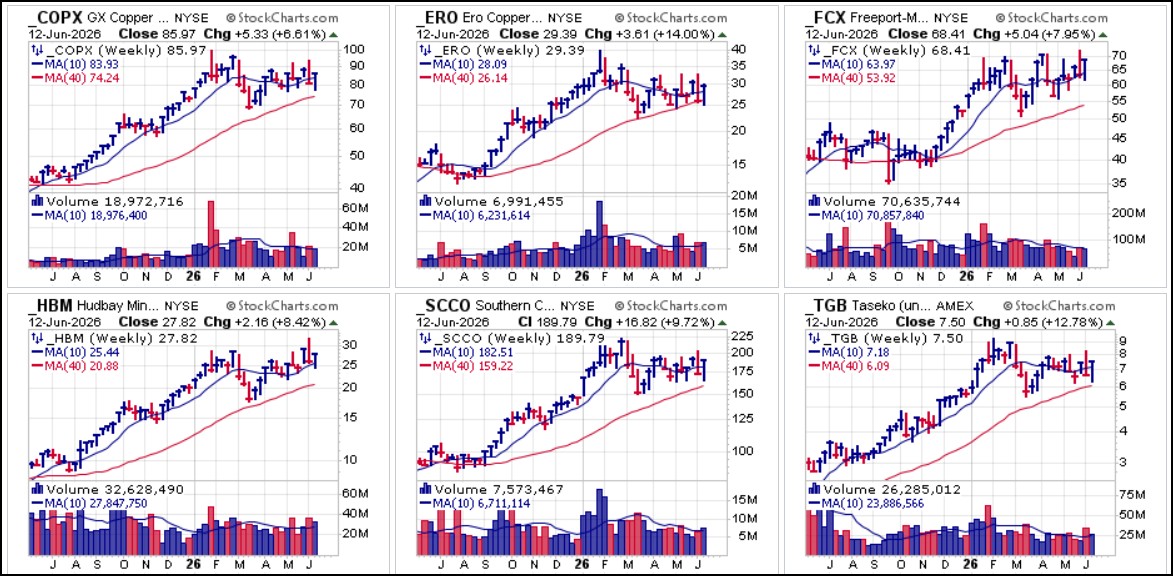
 As copper holds near all-time highs copper miners, including the Global X Copper Miners (COPX) ETF continue to build bases. These names have been buffeted about by the general market action and the Iran War but rather than top outright they have continued to build long bases following strong prior uptrends that extended from late August 2025 into late January 2026 before correcting. This flag this area of the market as one to watch if and as copper prices remain near all-time highs and above $6.00/lb. or even continue to rally higher. Look for pocket pivots as well as price and moving average U&Rs within these bases as potential long entry spots.
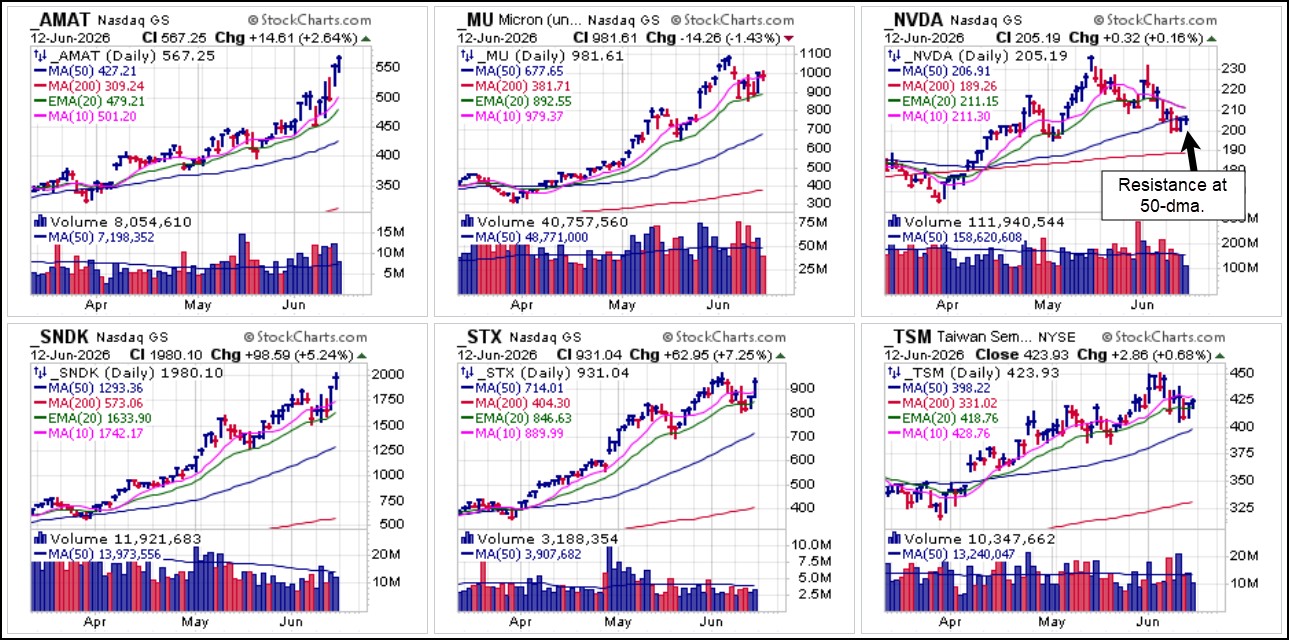
 Tech mostly rebounded this past week from oversold levels but among names we have reported on over the past two months or so we see that Applied Materials (AMAT), along with other semiconductor equipment makers not shown, and SanDisk (SNDK) both posted all-time highs on Friday. Otherwise, AI-related semiconductors are attempting to stabilize and form new bases. Nvidia (NVDA) is a notable exception here as the only big-stock semiconductor leader now living below 50-dma resistance. On Friday, a weak rally into the line brings the stock into short-sale range with the proviso that any meaningful move back above the line could trigger an MAU&R long entry so play it as it lies.
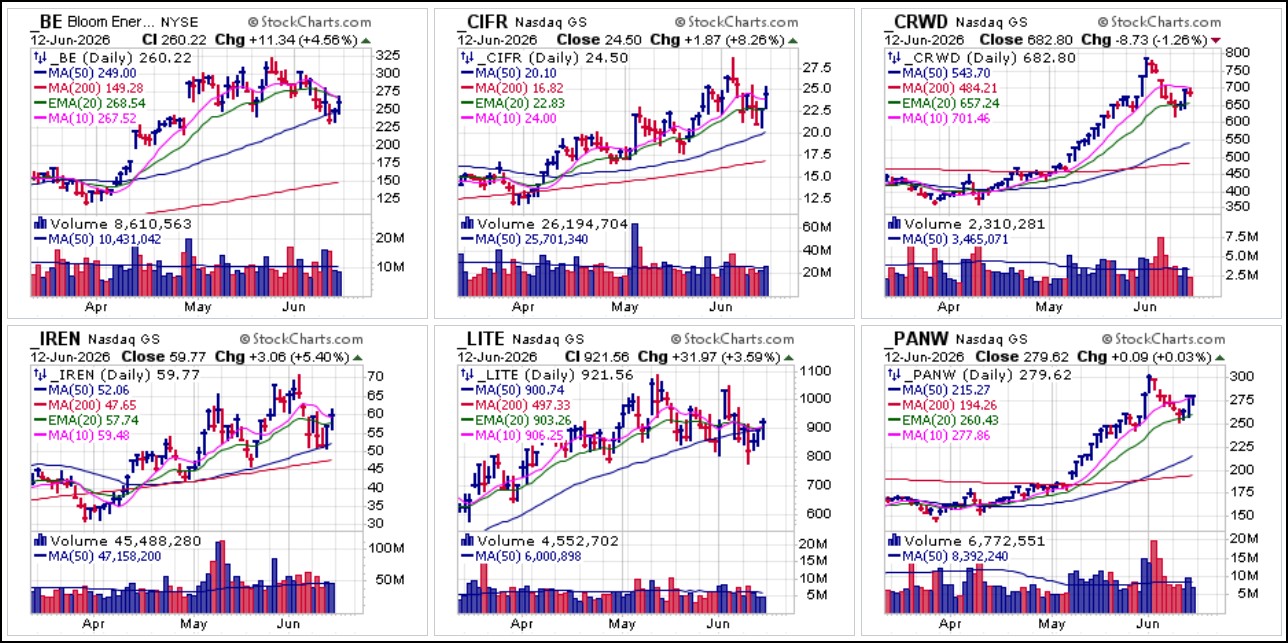
 Other AI and AI Data Center related names that we have reported on recently have also gone into correction mode. It is possible to pick our MAU&Rs in all of these names over the past two days along key moving averages. These could have been utilized as Ugly Duckling style long entries, such as CrowdStrike (CRWD) and Palo Alto Networks (PANW) along their 20-demas on Thursday, for example.
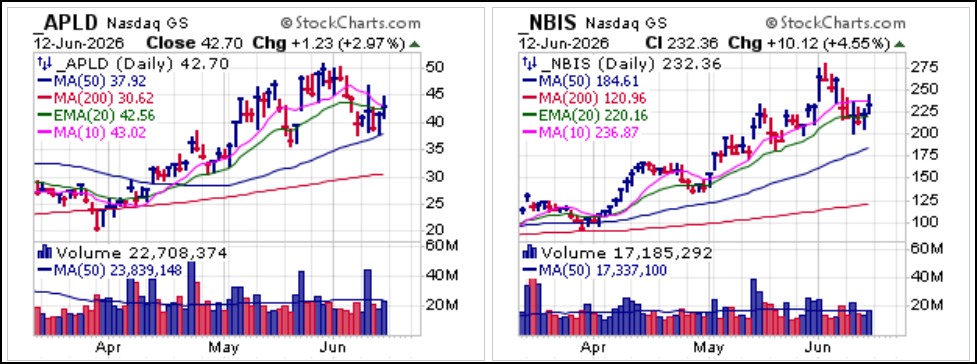
 AI Data Center related names Applied Digital Corp. (APLD) and Nebius Group N.V. (NBIS) have pulled into moving average support but remain, like those shown above, relatively choppy despite posting MAU&Rs at 10-dma and 20-dema on Thursday and/or Friday.
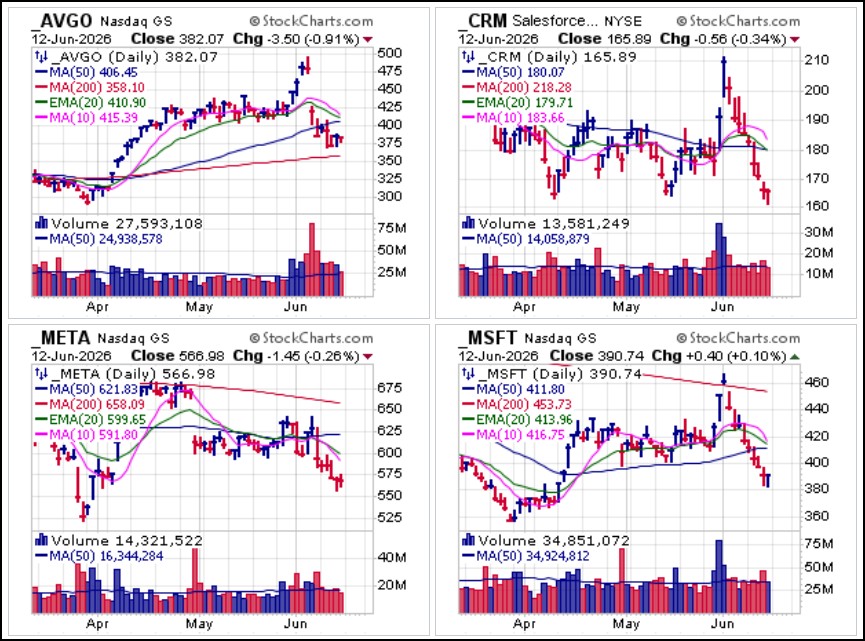
 While many of these Ai-related techs may be going into basic base-building mode after prior run-ups there is still no shortage of ugly charts out there among big-stock techs. We offer these four names below as prime examples. All four names are dangling down in No Man's Land, although Salesforce.com (CRM) is attempting to forge a price U&R along the`163.52 mid-April and 164.33 mid-May lows after closing at 165.89 on Friday.
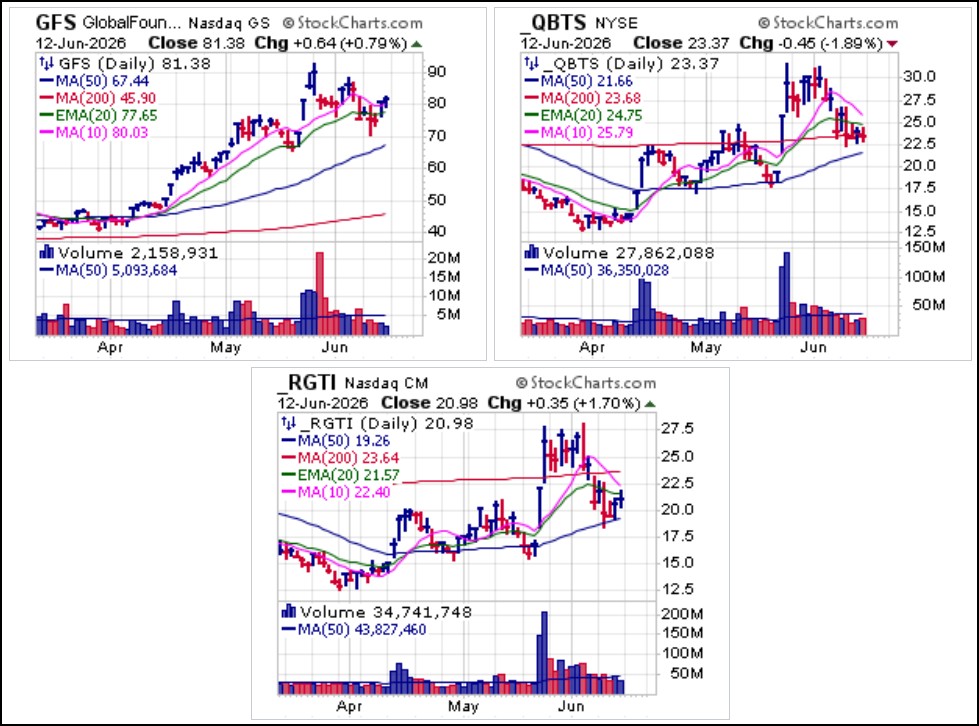
 Quantum Computing names that we have reported on previously in May as they began sharp upside runs have given those moves up almost in the entirety. The one exception here is GlobalFoundries (GFS) which on Thursday posted a price U&R at the pullback low of two weeks ago when it tested 20-dema support and then an MAU&R at the 20-dema on Thursday. Unlike its two money-losing counterparts, D-Wave Quantum (QBTS) and Rigetti Computing (RGTI), GFS actually makes money and is expected to earn $2.48 a share in 2027.
 The market rebound over the past two days has created some potential trading opportunities as many leading stocks in pullback/correction mode have posted simultaneous price and moving average undercut & rally (U&R and MAU&R) long entry triggers. However, unless progress is made on a final U.S.-Iran peace agreement these moves may not last long, keeping the market in its bi-polar news-dependent state. For now we remain cautious but also light-footed, nimble and ready to act appropriately as the situation develops.
 The Market Direction Model remains on a BUY signal.