
While the Fed talk is seen as hawkish, what the Fed actually does remains relatively dovish. If we consider that the Fed now sees Core PCE running at 3.3% in 2026, sharply higher than the 2.7% they were forecasting as recently as March, then why not head it off at the pass and raise interest rates now? Perhaps they are banking on their current Dot-Plot expectations that Core PCE will fall to 2.5% next year, but consider that this was an increase from the 2.2% they were forecasting back in March. In many ways Warsh’s commentary was similar to the prior Fed Chairman Jerome Powell, who, during his press conferences, tended towards a mindless repetition of a mantra of economic growth politely slowing, unemployment improving and Core PCE inflation slowing to a manageable 2.7% by year-end.
The latest Dot-Plot, what one commentator astutely characterized as a constellation of anonymous guesses dressed up as policy, has gone at least half hawkish. Three Fedheads now expect one rate hike, five expect two, and one bold hawk is calling for four. This from the same gang that told us inflation was transitory back in 2021. Have they suddenly acquired prescient wisdom? Meanwhile, among the persistent but dwindling doves, eight expect rates to hold steady for the rest of the year while a lone Fedhead dove expects one rate cut. This sudden hawkish turn on the Dot-Plot is what spooked the market. But it may be the last time since Warsh has expressed a desire to eliminate it altogether.
It is, however, necessary to read between the lines as Warsh has taken the Fed's practice of speaking out both sides of its mouth to a fresh, new level. During the press conference one rebellious member of the financial press asked the question that I asked above, that if the Fed’s inflation forecast for 2027 remains above 2%, why not just just raise rates now? Warsh declined to comment, instead holding up the final phrase of the Fed’s policy statement, The Committee will deliver price stability like a rhetorical shield. Warsh also let it slip that when it comes to inflation he only looks at the left side of the decimal. Translation: he would be just fine with 2.999% inflation since the left side of the decimal stills shows a “2” and can therefore be deemed in line with the Fed’s arbitrary inflation target. Presto Change-O! The new inflation target is 3%!
Combined with the policy announcement statement (sentence two of paragraph one), “The Committee reaffirmed its policy of maintaining ample reserves in the banking system,” a subtly dovish comment when considered within the context of the Fed continuing to purchase $40 billion worth of Treasuries every month as part of its latest QE activity, this time disguised as a Reserve Management Program. It is likely that if something is going to kill stocks it will not be the Fed raising rates as the financial system edges ever closer to a systemic liquidity issue as all three Pits of Debt – personal, corporate, and sovereign – forged in the fire of QE when rates were near 0% and currently at record levels, start to face the reality of being serviced and rolled over into a higher-interest rate environment.
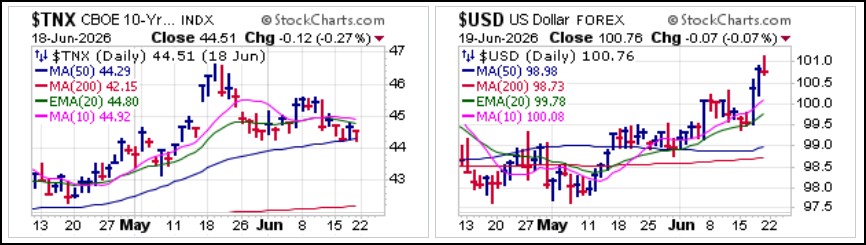
 The proof in the pudding will ultimately be seen in the action of interest rates, e.g., the 10-Year Treasury Yield ($TNX) and the U.S. Dollar ($USD). Both rallied on Wednesday after the Fed policy announcement, but on Thursday seemed to digest some of the more dovish aspects of the Fed's rhetoric on Wednesday. The $TNX remains well off its mid-May highs while the $USD reversed off a new 2026 high on Thursday morning to close down slightly. the 100.00 level has been a key area of resistance for the $USD so should be watched carefully.
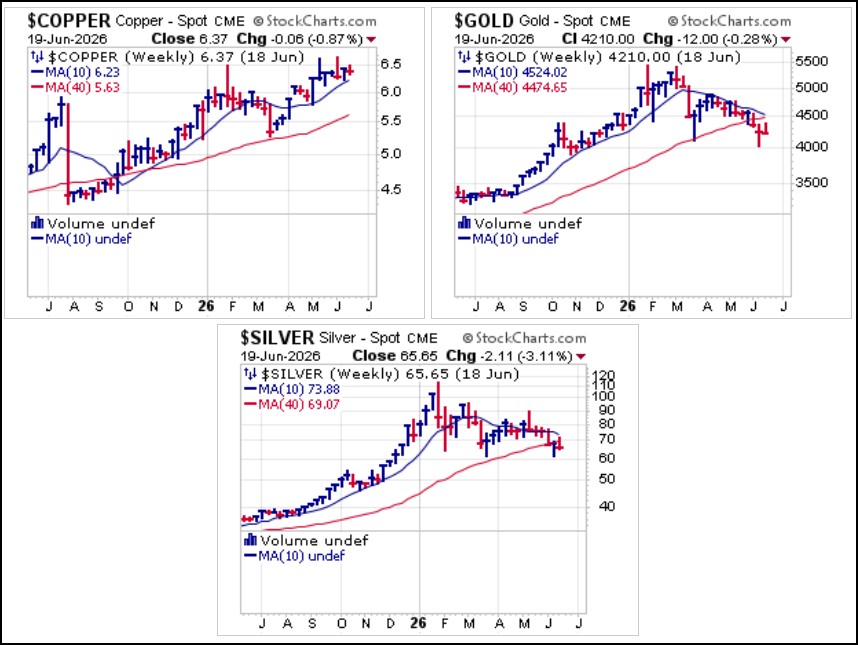
 Also keep an eye on precious metals, gold and silver. Both sold off sharply on Wednesday, along with copper but if one were looking to short either metal then doing so as they broke 200-dma/40-wma support was the proper entry. Whether this can result in anything more than a tactical trade will depend on how the market finally digests the Fed's current rhetoric. Copper, on the other hand, remains above 10-wma support and near all-time highs. As copper has trended higher since early March both precious metals have trended lower. Western ETFs are showing strong net outflows from the SPDR Gold Trust (GLD), for example, 45% of Central Banks expect to increase their holdings of gold within their overall mix of reserve assets, up fro 29% two years ago, forecasting purchases of 750-850 tons. There is a systemic bid in gold, the question is where. Shrewd central bankers, if there is such a thing, should let it come to them.
Asian buying has remained at record levels creating an odd divergence. Ultimately, Western investors tend to buy at the top and sell at the bottom when a pullback gets obvious and everyone wants to get short. If the Fed is truly in a hawkish mood based on actions and not just words, however, we could see these move lower from here, but it is likely that stocks would correct as well so to some extent the precious metals serve as ancillary indicators in this regard. For now, however, I tend to favor playing copper on the long side with the idea of using the 10-wma as a tight selling guide.
 On the issue of liquidity, there is currently no shortage of liquidity for stocks, specifically semiconductors which remain the primary game in town. That is no surprise given that U.S. equity funds/ETFs posted a record +$119 billion in inflows in the week ending June 17th. This was driven by tech, which saw +$19.2 billion in inflows, the largest weekly intake on record.
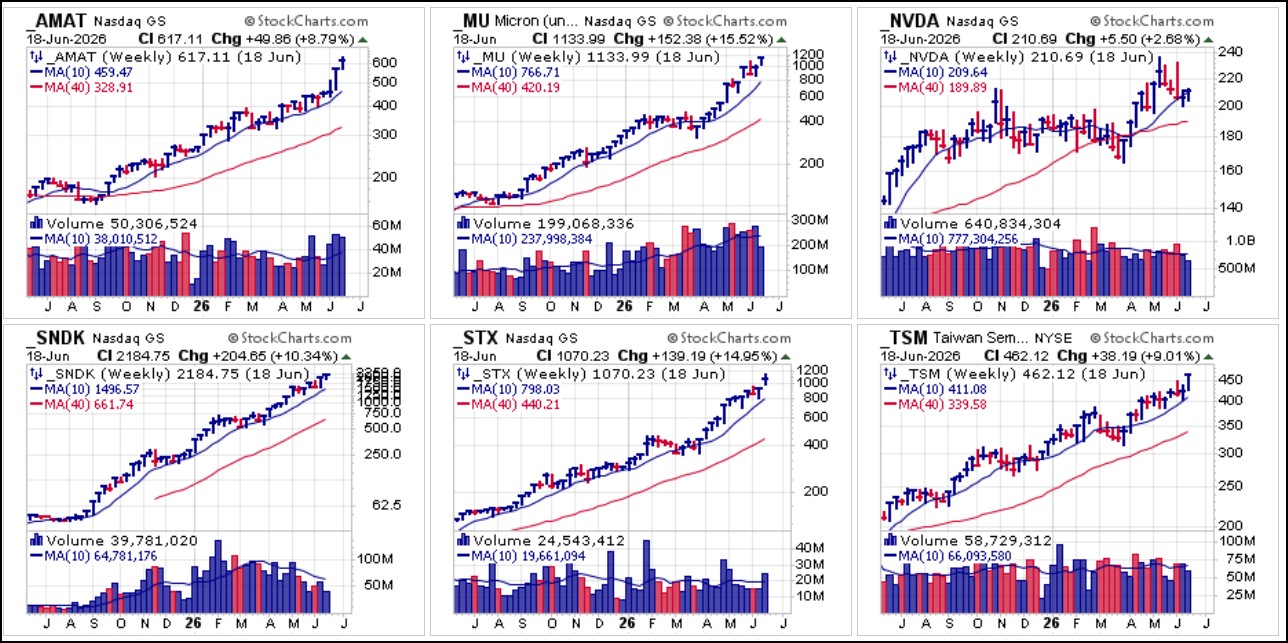
And so, weekly charts of semiconductor names we have reported on over the past couple of months continue to trend higher, with little in the way of fresh long entry points along the way. Nvidia (NVDA) remains once exception as it hovers around 10-wma support where it could resolve as a short if it decisively busts the line or a long entry if it can hold an MAU&R move at the 50-dma/10-wma from here as it sits just on top of both moving averages. Two points to take note of - the first is that NVDA has pulled all the way back top the top of a multi-month base structure extending back early November 2025 and the second is that its recent move into the PC business may be a shrewd adaptation as the current trend toward running LLMs locally on individual PCs, laptops and hand-held devices instead of relying on a cloud-hosted model accelerates. Great companies find new catalysts to drive new price moves after long periods of sideways movement, and this may be something to keep an eye on.
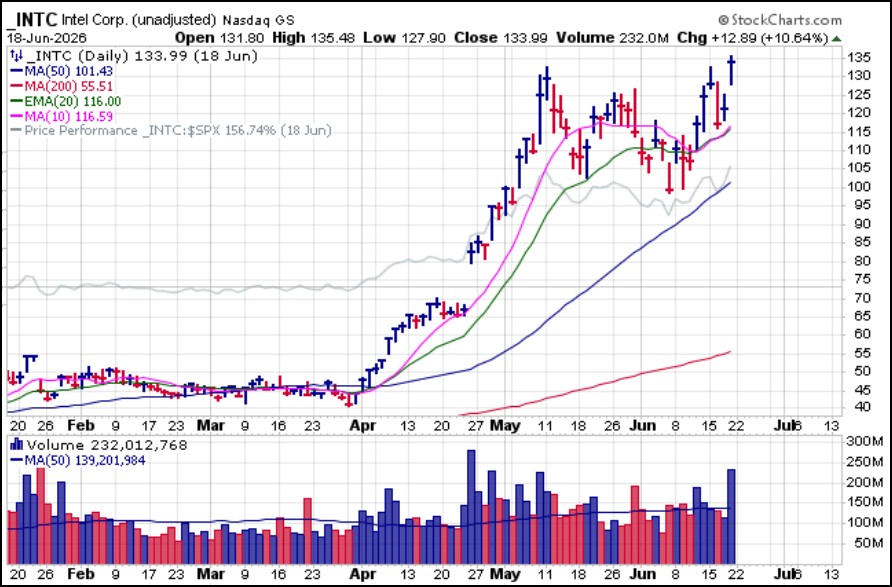
 One semiconductor that has recently posted a proper long entry set-up as we reported on Thursday is Intel (INTC) after it announced its deal with AAPL. Volume held up by the end of the day on Thursday, coming in at 56% above average as the stock broke out to new highs. The buyable gap-up (BGU) was therefore actionable using the 127.90 intraday low as a selling guide. It remains within buying range. While INTC sells at 125 times forward estimates it is important to remember that a stock like Arm Holdings (ARM) sells at 202 times forward estimates yet this has not prevented the stock from continuing to streak to new highs as it did on Thursday.
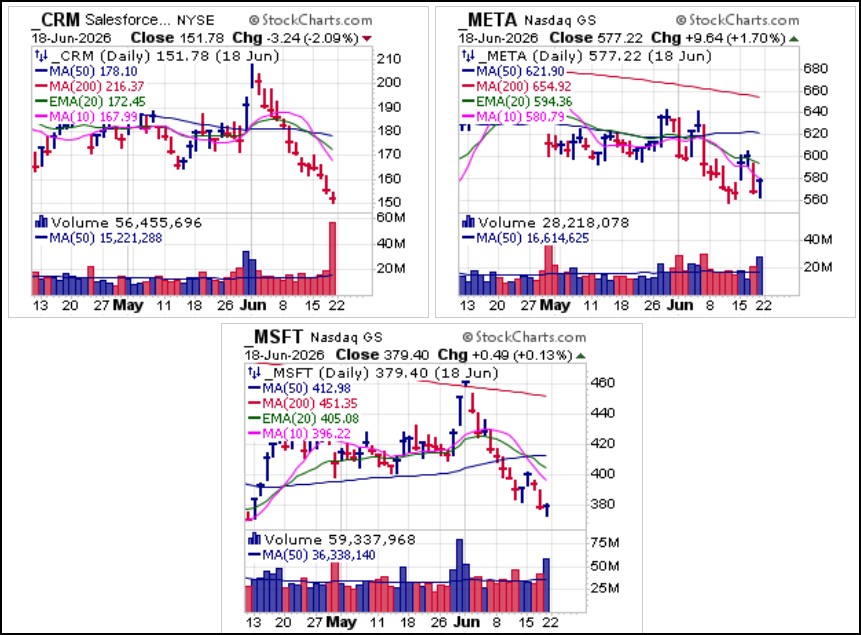
 Illustrating the bifurcation in tech land as semis dominate is the action in big-stock software/cloud names. While Meta Platforms (META) and Microsoft (MSFT) attempted to rally off their lows on Thursday, Salesforce.com (CRM) posted its thirteenth straight down day as the stock remains in a steady freefall.
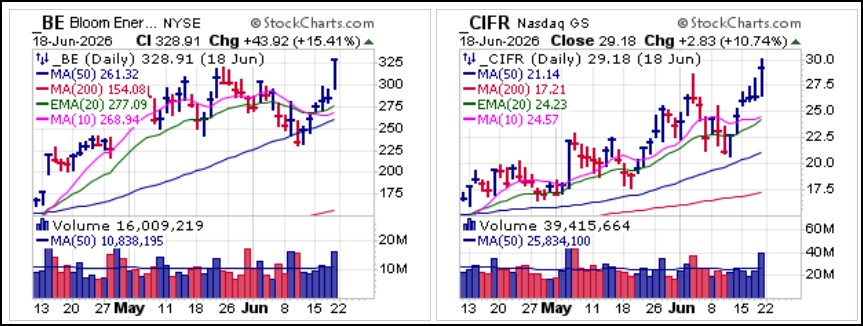
 Data Center names Bloom Energy (BE) and Cipher Digital (CIFR) both posted breakout moves on Thursday but are not extended. Note the MAU&Rs at the 50-dma for BE and the 20-dema for CIFR six days ago on both charts. That was the optimal long entry point, but requires some courage to step in and buy at those levels. In general, these stocks will tend to spike higher and then pull back sharply, making for opportunistic entries on the pullbacks that are far more optimal with respect to the ensuing price action as these two stocks show.
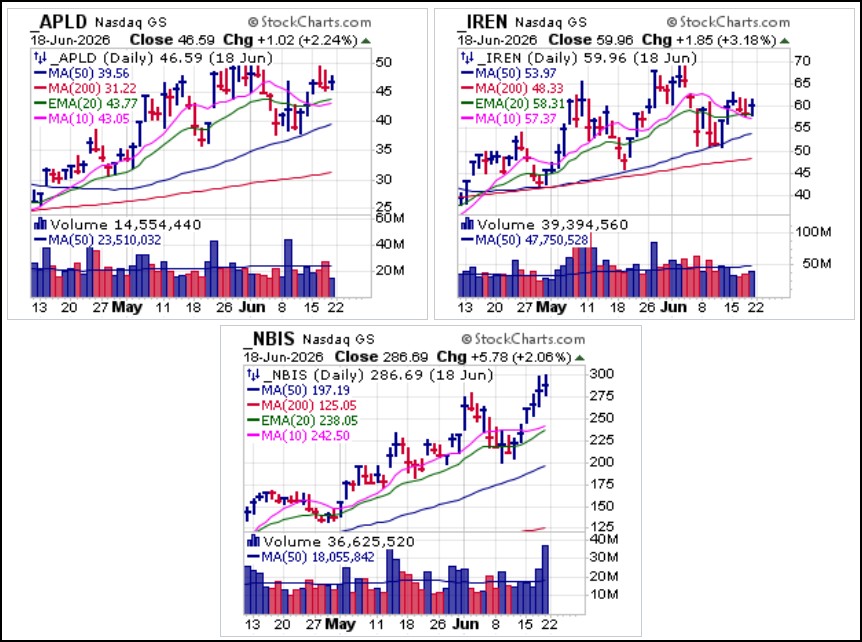
 Applied Digital (APLD), Iren Ltd. (IREN) and Nebius Group N.V. are in recovery mode after finding support at the 50-dma in the first two and the 20-dema in the the latter. APLD is holding the late May/early June highs. Constructive pullbacks to the 10-dma/20-dema from here would offer potentially opportunistic entries. IREN is hanging along 10-dma/20-dema support on below average volume, but may be in a long entry position here using the 10-dma/20-dema as a tight selling guide. NBIS broke out on Wednesday as it rallied six days in a row after posting an MAU&R at the 20-dema two Thursdays ago. It is extended as it approaches the $300 Century Mark.
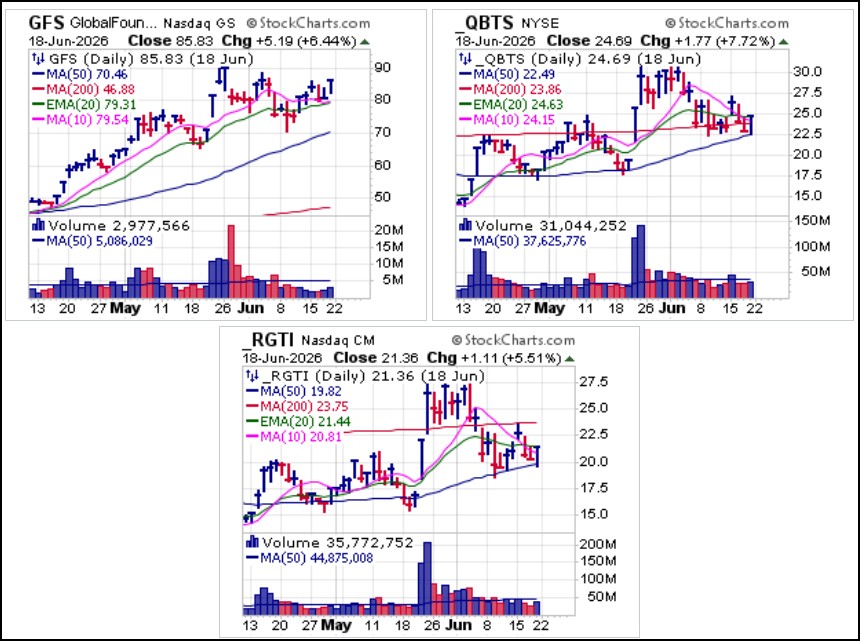
 Quantum Computing names that we have reported on over the past several weeks present a mixed bag. GlobalFoundries (GFS) posted an MAU&R at the 20-dema six days ago on the chart and then showed VDU action along the 10-dma before rallying up to the Monday highs on Thursday. This remains a long entry on pullbacks to the 10-dma/20-dema which are then used as tight selling guide. D-Wave Quantum (QBTS) posted an MAU&R move through the 200-dma after bouncing off the 50-dma. This is a potential long entry using the 200-dma as a tight selling guide. Finally, Rigetti Computing (RGTI) posted an MAU&R at the 50-dma on Thursday but is slightly extended unless one wishes to use the 10-dma at 20.81 as a tight selling guide vs. the much wider 50-dma.
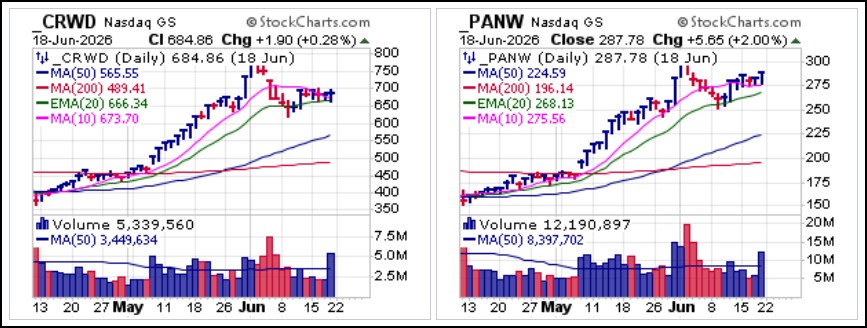
 Cybersecurity names CrowdStrike (CRWD) and Palo Alto Networks (PANW) both posted pocket pivots on Thursday amid the triple-witching OpEx action. CRWD held tight along the 20-dema while PANW held tight along the 10-dma, so that each is actionable using the 20-dema and 10-dma, respectively, as tight selling guides.
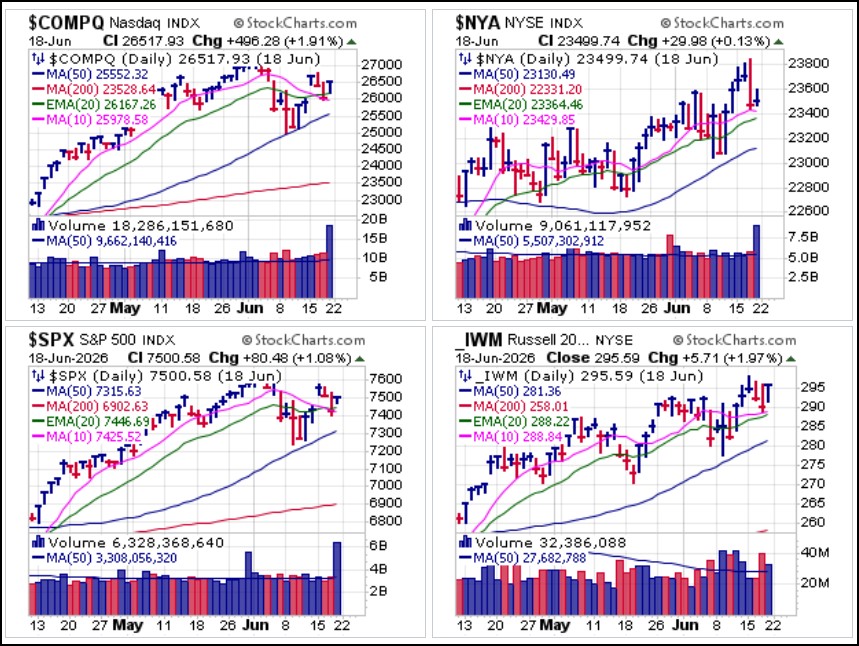
 While many areas of the market have languished, tech continues to lead the market higher. Liquidity has not been an issue, at least with respect to what have been record inflows into stocks, led by tech, as previously noted in this report. Debt has also contributed to the liquidity pool flowing into stocks, as U.S. margin debt jumped by +$112 billion in May to a record $1.42 trillion. This marks the second consecutive monthly increase, totaling +$195 billion. Margin debt has surged +$495 billion, or +54%, over the last 12 months as investors borrow money to buy stocks and a margin debt bubble of sorts continues to inflate. Until these trends are reversed, stocks may continue to hold up, barring any exogenous catalysts. Meanwhile, negotiations between the U.S. and Iran have stalled over the weekend, throwing another wrinkle into the war situation. Stay tuned.
The Market Direction Model (MDM) remains on a BUY signal.
- Gil Morales, June 20, 2026