
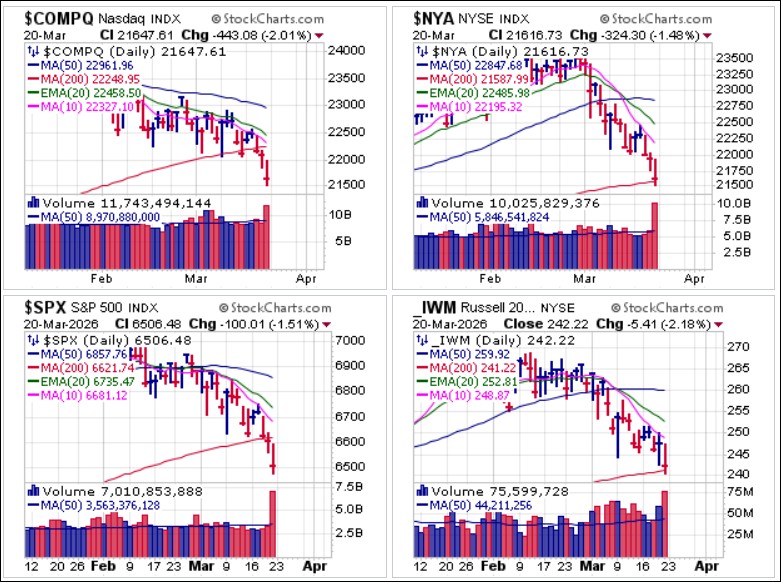
Major market indexes all sunk to lower lows on Friday on heavy triple-witching options expiration. The NYSE Composite and Russell 2000 are the only indexes holding above 200-dma support, but that is likely to change in short order. As we have said, unless one is oriented towards a nimble trading approach, primarily on the short side, cash is king.
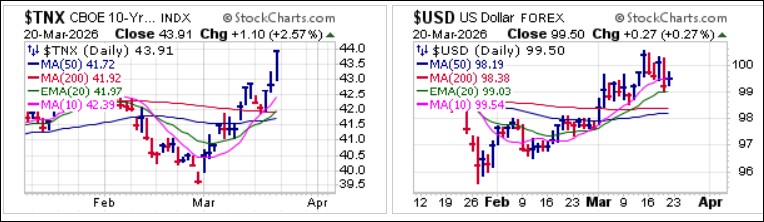
 Interest rates are spiking as another upside surprise in inflation hit the market on Wednesday morning as the headline Producer Price Index (PPI) came in very hot at 0.7% vs. expectations of 0.3% and accelerating from the 0.5% increase seen in January. On a year-over-year basis the PPI increased 3.4%, the fastest annual pace in a year, up from +2.9% in January. Core PPI advanced 0.5% month-over-month vs. an expected 0.3%, and was up 3.9% year-over-year. Keep in mind, this is all according to government data, which skews inflation to the downside.
Meanwhile, as rates spike, raising the question as to how high they can go before they crash stocks, the U.S. Dollar ($USD) has lost momentum as it runs into resistance along the 100 level. At the same time, this past week saw the the U.S. National Debt set a new record as it crossed the $39 trillion level for the first time. Higher rates mean higher costs to service the national debt as the U.S. government faces the need to roll nearly $10 trillion in debt this year. Overall, underlying conditions remain at toxic levels, underscoring how QE and "not-QE" continues in full force but against factors that are heavily weighing on stocks.
 Technology shares continue to tumble as the SPDR Select Sector Technology (XLK) ETF reversed at 200-dma support on Friday as it now tests the late November lows.
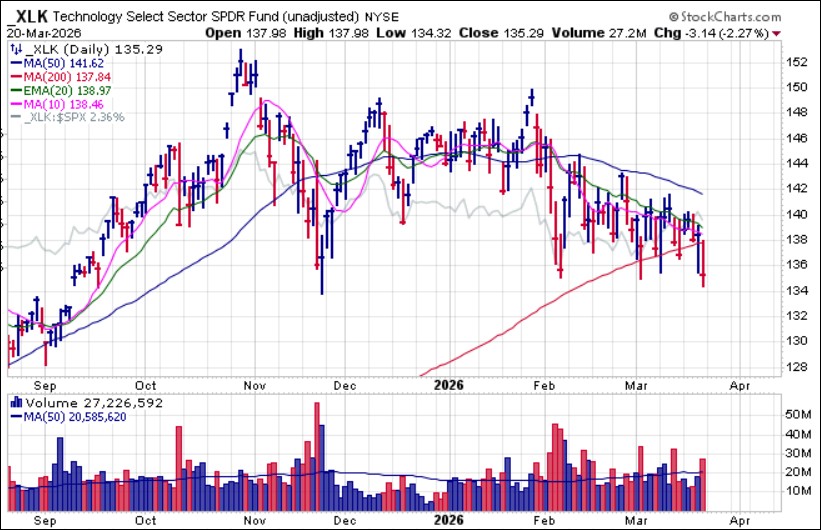 Investors have no place to hide as both gold and silver quickly failed at U&R attempts along their early February lows on Thursday, with gold breaking to a lower low on Friday. The yellow metal had its worst week in six weeks when it plummeted in late January after posting all-time highs above the $5,500 level. Such is the nature of forced selling: anything and everything that is not nailed down will be sold as a fungible source of cash.
 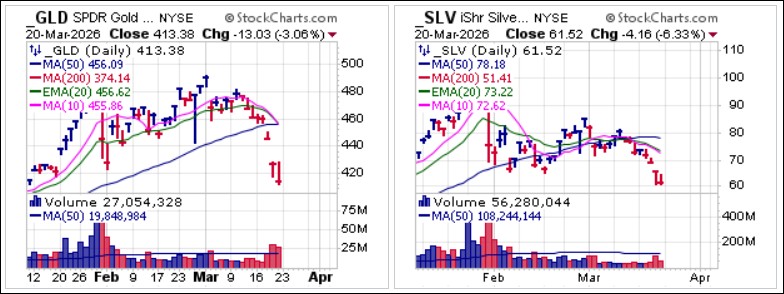 While some began to consider that Bitcoin ($BTCUSD) was starting to act like a safe haven asset as the War in Iran began, it has now pushed back below 50-dma support. In the process is triggered a double-top short-sale (DTSS) as it reversed along the early March peak. It is likely that the move to the upside in the first half of March was primarily due to Strategy (MSTR) continuing to purchase more $BTCUSD at all costs. The company announced on March 2nd that it had purchased 3,015 $BTCUSD for approximately $204 million, and on March 9th announced it had purchase 17,994 $BTCUSD for approximately $1.28-$1.3 billion and then on March 16th that it had bought 22,337 $BTCUSD for approximately $1.57 billion, their largest purchase in 2026 so far.
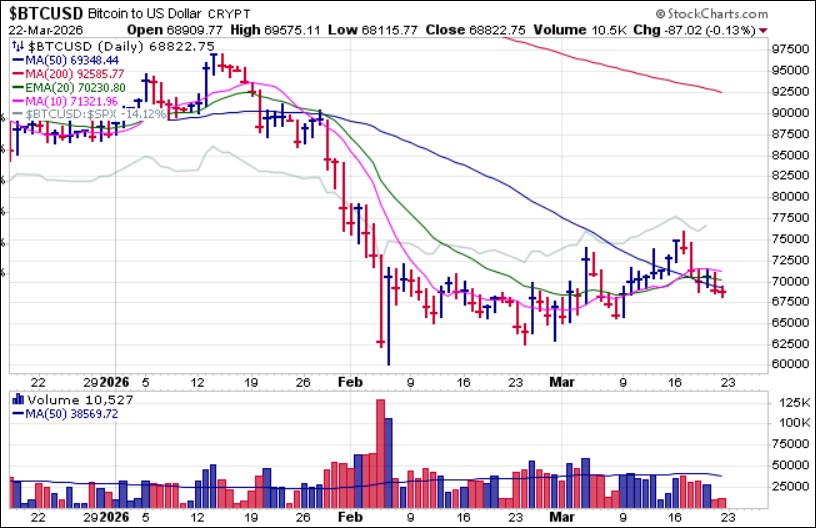 While declining prices in all assets may at some point create some very interesting opportunities on the long side, it is clear that late March 2026 is not that point in time. Cash remains king.
The Market Direction Model (MDM) has remained on a SELL signal since February 27th.