
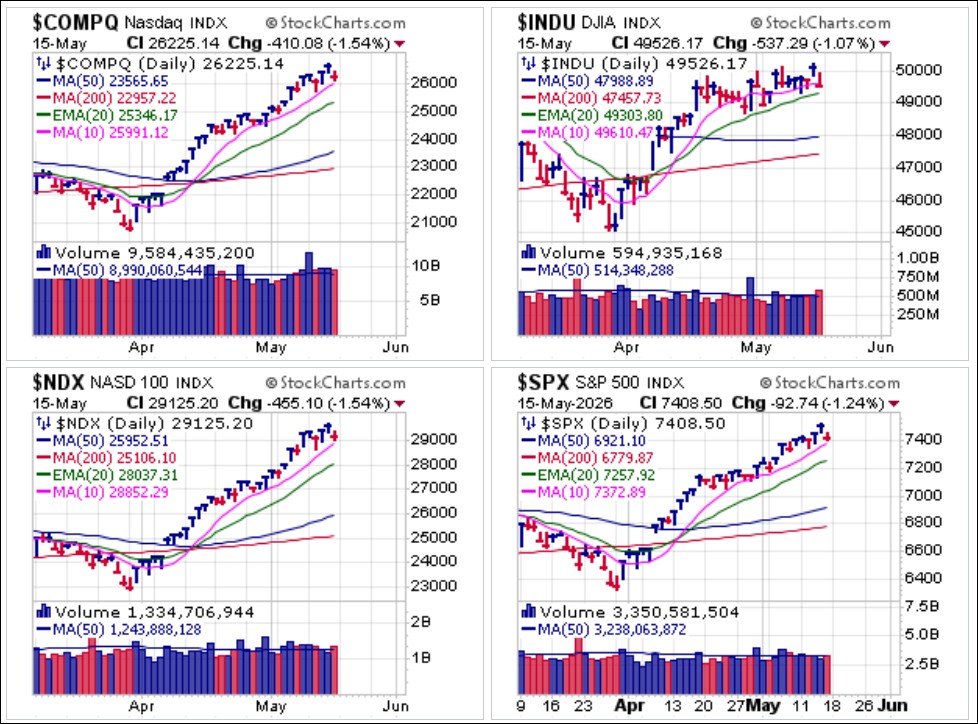
 A handful of big-stock techs have been leading the market higher, resulting in the persistent outperformance of the NASDAQ and the S&P500. This becomes evident on the charts of the broader and less tech centric NYSE Composite and small-cap Russell 2000. Both indexes broke below 20-dema support on Friday on higher volume.
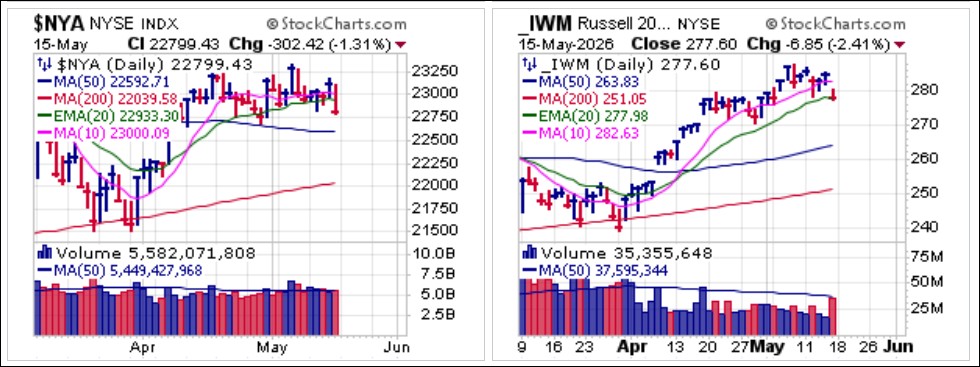 The impact of narrowing leadership is also seen in a comparison of the S&P 500 and the S&P 500 Equal-Weighted Indexes. As the $SPX still holds above 10-dma support the $SPXEW has broken 20-dema support as non-tech stocks pummeled on the inflation data.
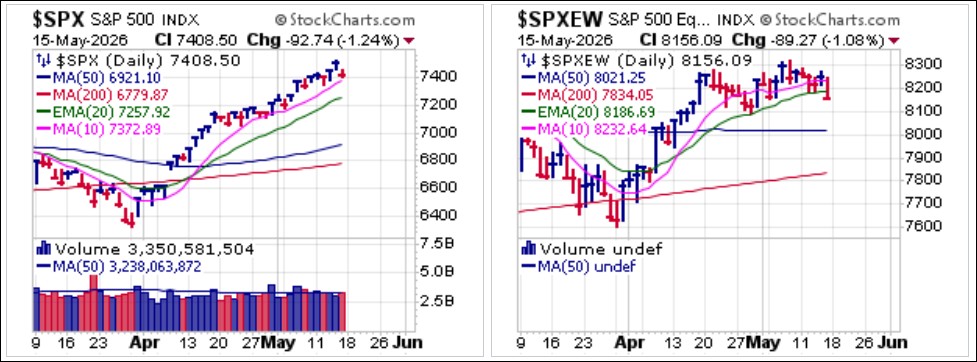 This divergence is also more than evident in the matrix of Sector ETFs where we see the SPDR Select Sector Energy (XLE), courtesy of rising energy prices, and the SPDR Select Sector Technology (XLK) ETFs holding up while everything else rolled over on Friday.
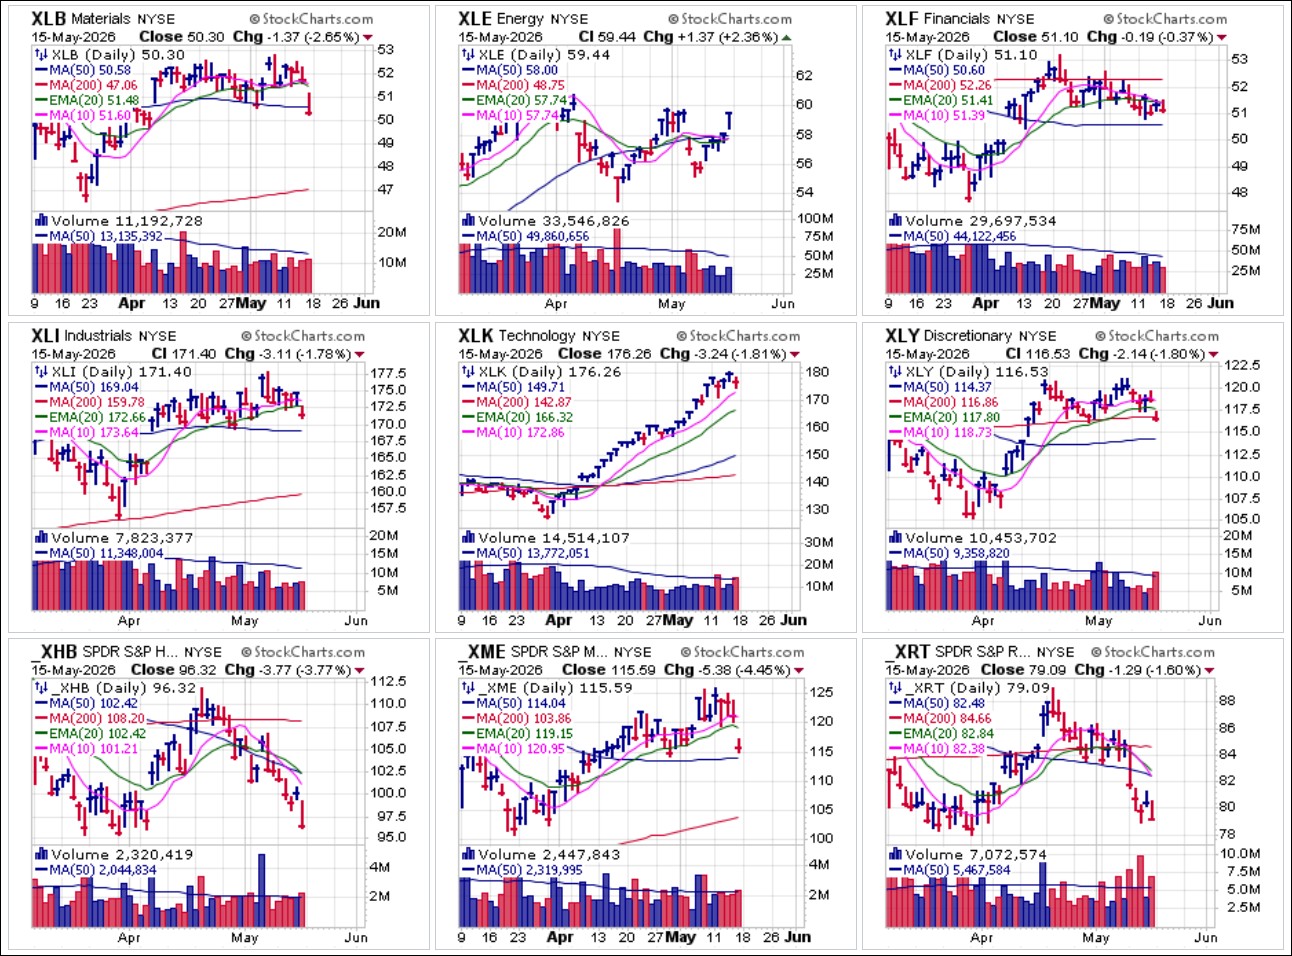 The outperformance of a handful of Ai-related big-stock semiconductors, telecoms, and other techs can be seen as a gamma-related feedback loop. Aggressive call-buying in turn induces market maker buying which in turn drives prices higher. The rush into these stocks stocks since the market turned on March 31st has created the current situation. An unwinding of this gamma feedback loop can lead to sharp pullbacks, so members should review trailing stops and have a selling plan in place well before any serious signs of trouble emerge. Having a selling plan ahead of time prevents one from reacting emotionally.
Aside from spiking inflation, with this past week's numbers showing that inflation is spreading beyond oil-induced price increases as services inflation remains a major component. This finally spooked the bond market on Friday, leading to a veritable bond rout, as the chart of the iShares 5-7 Year Treasury Bond ETF (IEF) shows below.
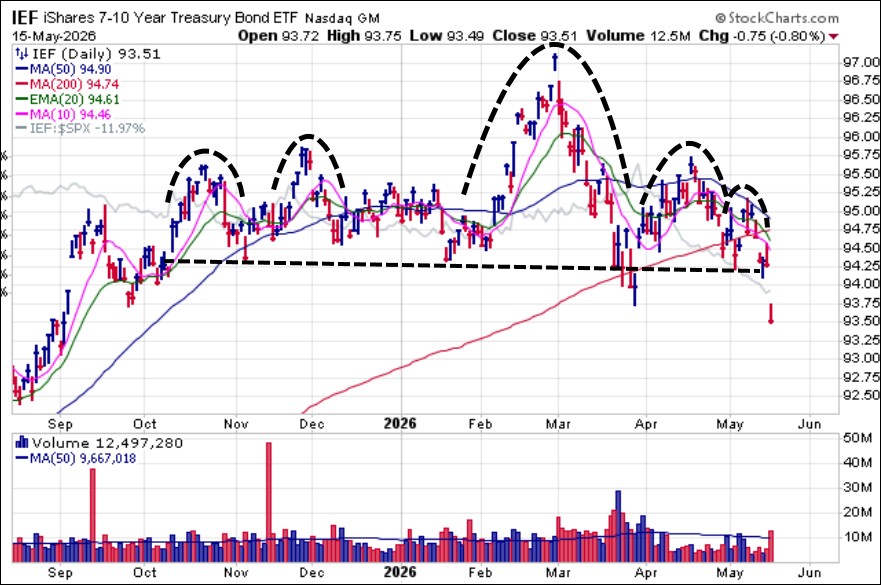 The sharp selling in bonds was also seen among high-yield (junk), investment grade corporates and municipals bonds as well on Friday. We can see this in the charts of the iShares High-Yield Corporate Bond (HYG), iShares Investment Grade Corporate Bond (LQD) and iShares National Muni Bond (MUB) ETFs. Note that junk bonds tends to be among the last to go as the junk bond markets tend to be far less liquid, and when institutions and others need to raise liquidity they will tend to sell more liquid Treasuries first. Something is certainly not quite right here, and perhaps will find out what that is in the coming days and weeks.
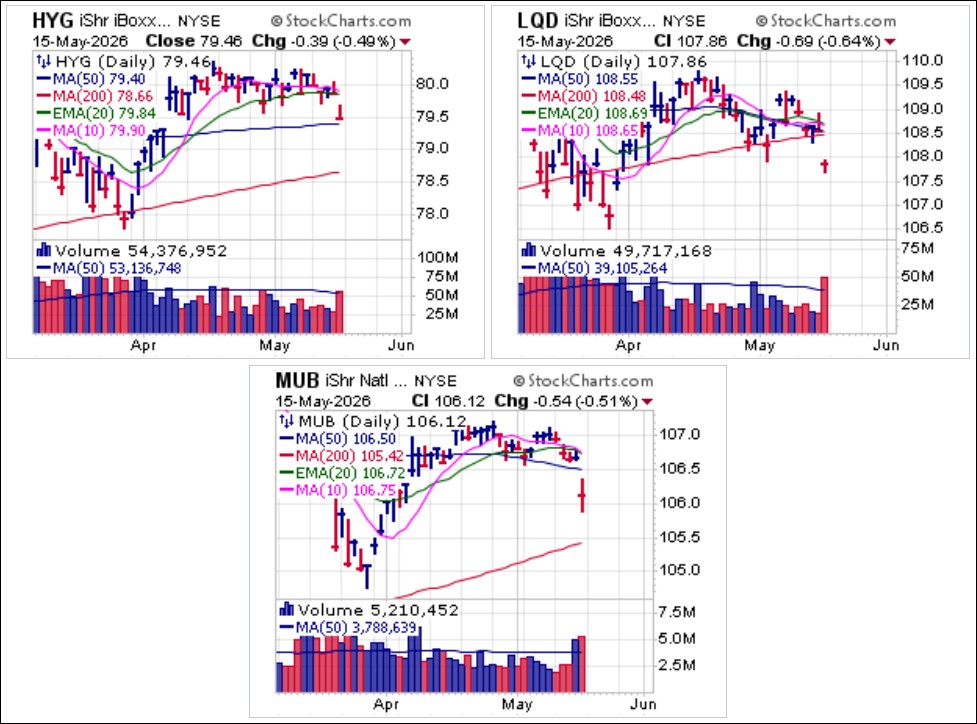 Obviously as bonds are routed both interest rates as measured by the 10-Year Treasury Yield ($TNX) and the U.S. Dollar ($USD) rise in response. Also notable, the 30-Year Treasury Yield ($TYX) surged to 5.127% on Friday, marking its highest closing level since July 2007. This all accounted for the sharp sell-off in gold, silver and copper on Friday as well. Ultimately, a persistent rise in interest rates is negative for stocks.
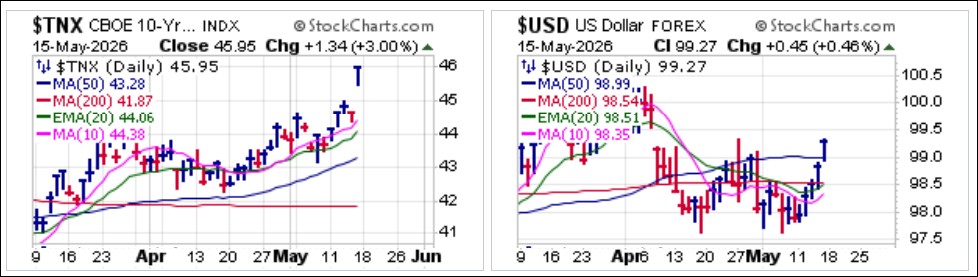 Leading semiconductors are showing mostly one-day pullbacks as of Friday's close, but in some cases the action is notable, such as in the case of Micron Technology (MU) which reversed at the $800 Century Mark on Thursday and then gapped down to 10-dma support. Most of these stocks have not even been trending higher for more than seven weeks, so implementing the Seven-Week Rule by using whatever moving average that the stock has obeyed on the way up for seven weeks or more as a selling guide is not possible. As an example, note that MU has only been following the 10-dma for the past six weeks.
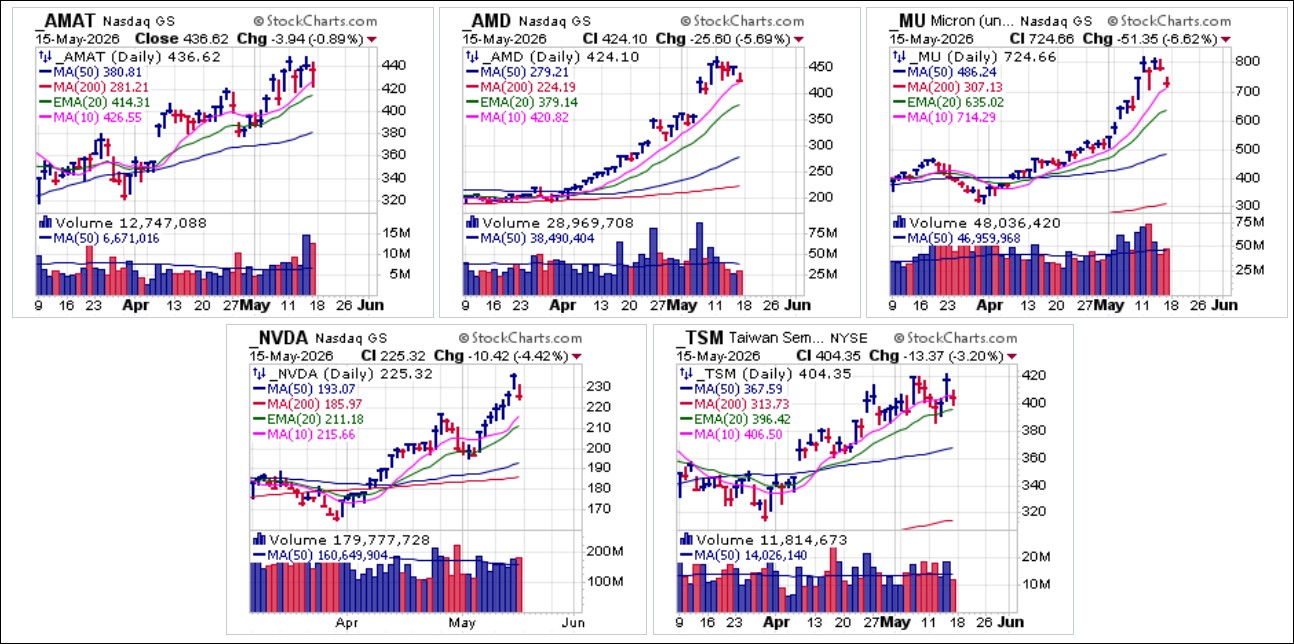 Last week we reported on big-stock cybersecurity names CrowdStrike (CRWD) and Palo Alto Networks (PANW) as they looked to be posting buyable gap-ups (BGUs) seven trading days ago as we see on the charts below. As it turned out, volume by the end of the day last Thursday was not sufficient for BGUs but did qualify as gap-up pocket pivot (GUPP) type action. Both stocks were actually moving in sympathy to their cybersecurity cousin Fortinet (FTNT) which did in fact post a BGU after reporting earnings two Thursdays ago. FTNT earnings helped allay fears that AI would replace cybersecurity software and the group reacted like a school of fish, trending higher in close synchrony for the past seven days in a row.
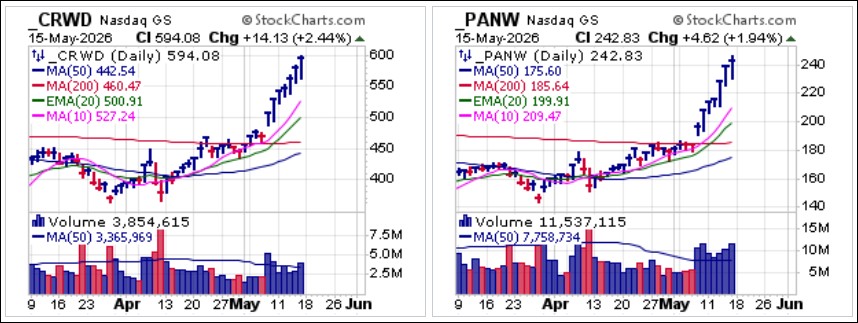 While the Fed does nothing, inflation reaccelerates again and it is the bond market that starts raising rates well ahead of the Fed, as is typical. But with $10 trillion in new Treasury issuance set to hit the markets in 2026 in order to refinance the national debt, now approaching $40 trillion, the Fed remains reticent, citing their confidence in achieving their arbitrary 2% inflation objective, despite failing to do so for the past five years in a row.
Divergences and cross-currents are expanding in the current market environment, even as the AI FOMO spirit remains alive amid sell-offs in other areas of the market. As the two tides meet, which will prevail? Only the charts will know for certain. Thus, it is prudent for investors holding any of the current leaders to review their holdings and devise a selling plan based on certain technical criteria ahead of time.
The Market Direction Model (MDM) switched to a CASH/NEUTRAL signal on the morning of Wednesday, May 13, 2026 before switching back to a BUY signal by the end of the day.
- Gil Morales