
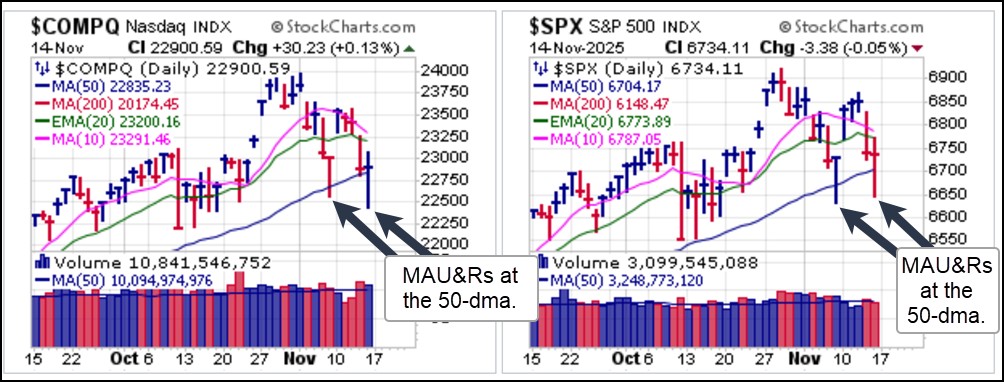
 The prior week's sell-off emanated from concerns of an AI bubble, while this past week's sell-off was centered around fears the investors had overestimated the Fed's willingness to engage in aggressive rate cut policy going forward. Various Fedheads on the speaking circuit poured water on the idea that a December rate cut is in the bag, sending stocks lower and interest rates higher. Both the 10-Year Treasury Yield ($TNX) and the 30-Year Treasury Yield ($TYX) spiked higher on Friday within continuing uptrends off the lows that were posted right around the Fed's last policy announcement.
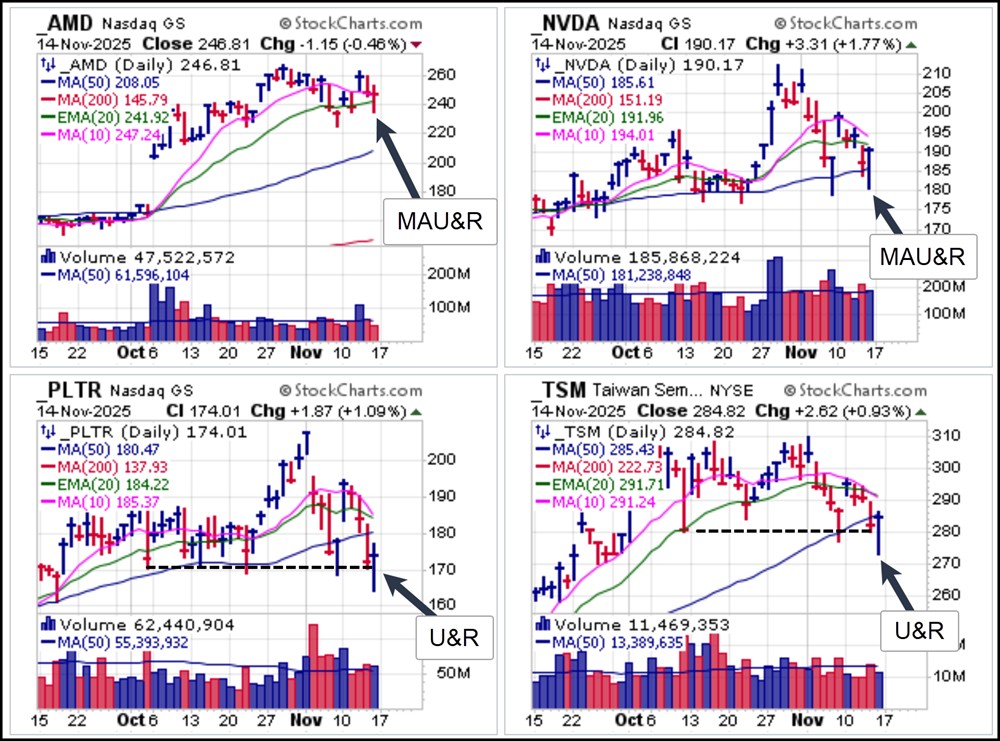
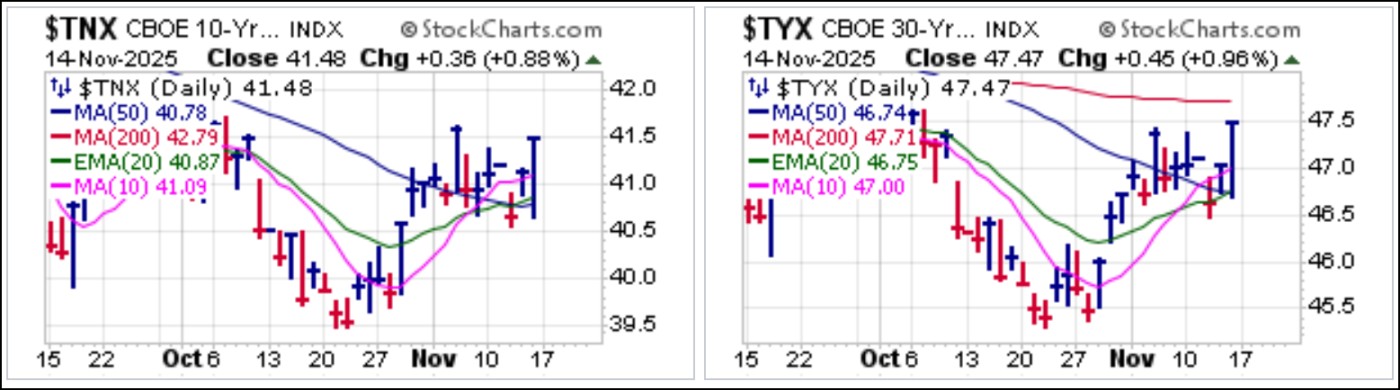 On an individual stock basis, big-stocks reacted in similar fashion, posting both price and moving average undercut & rally (U&R and MAU&R) moves off the early morning lows on Friday. Advanced Micro Devices (AMD), which got the tech sector moving on Wednesday after its CEO crowed about the massive AI opportunity that the company is addressing as "the right bet" to make. That move lasted one day before AMD broke below 10-dma and 20-dema support on Thursday and then Friday morning before shaking out along the 20-day line.
Meanwhile, Nvidia (NVDA) and Palantir (PLTR) continue to play out as late-stage failed-base (LSFB) short-sale set-ups as they are essentially bouncing between 10-dma and 20-dema resistance on the upside and 50-dma support on the downside. Taiwan Semiconductor (TSM) has been playing out as a Livermore Century Mark short-sale set-up after decisively busting the $300 level the prior week. It failed to rally to clear 50-dma resistance but did manage to shake out along a pair of price lows in the pattern along the 280 level to post price U&Rs on Friday. However, 50-dma resistance may present a possible short entry spot if TSM cannot clear the line.
 The sell-off in stocks as forced selling sweeps the market also puts natural pressure on gold and silver, both of which remain what so far appear to be consolidations following the early October peaks in record territory. Spot Gold and Spot Silver both pulled into 10-dma and 20-dema support and held on Friday, but could remain volatile as the markets sort themselves out. We tend to think that further consolidation is likely with gold holding support along the $3900 level and the 50-dma while silver is looking at maximum downside support at the 50-dma.
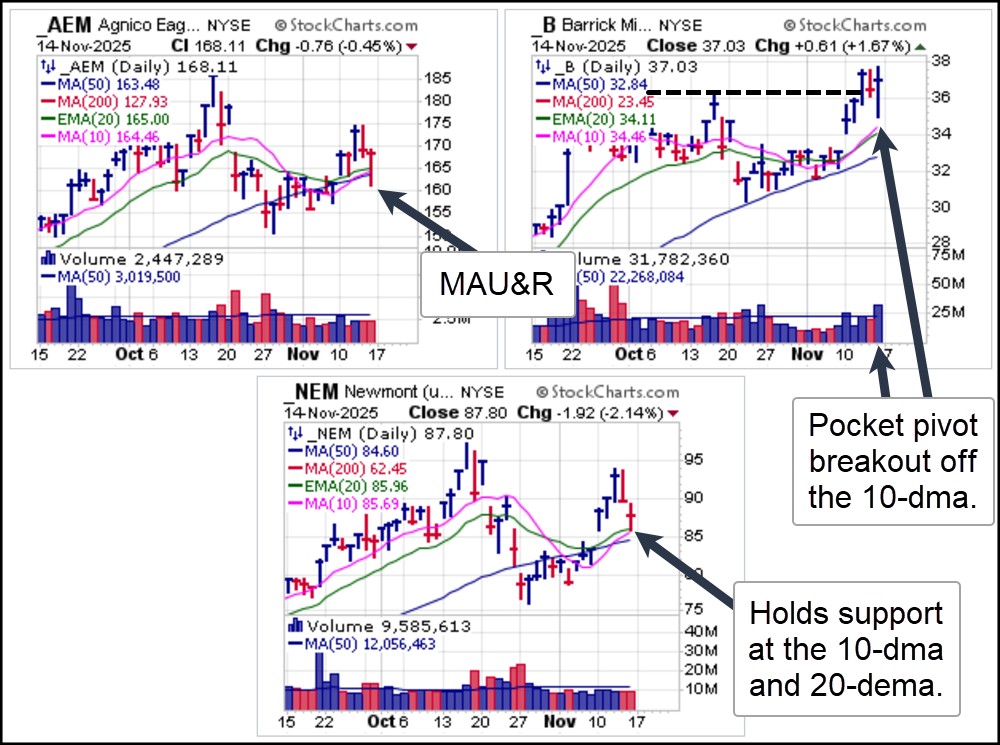
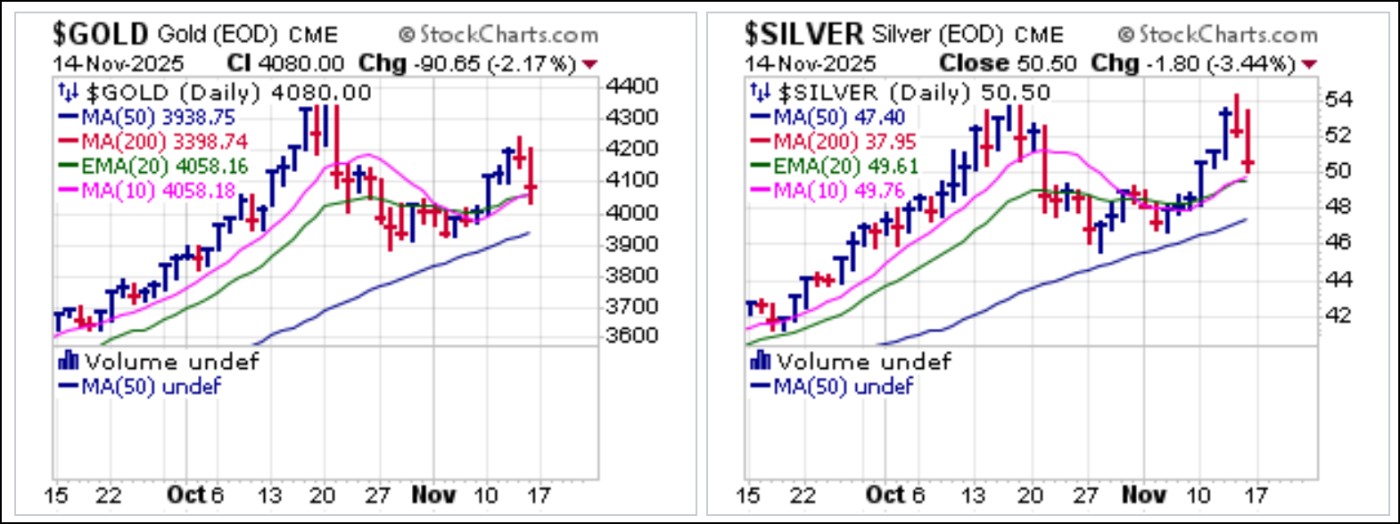 As gold and silver held 10-dma and 20-dema support, big-stock gold miners and institutional favorites Agnico-Eagle Mines (AEM), Barrick Mining (B), and Newmont Corp. (NEM) also found support at their 10-dmas, among other moving averages. AEM posted an MAU&R at the 10-dma, 20-dema, and 50-dma, while B posted an impressive strong-volume pocket pivot re-breakout maneuver off a point near to the 10-dma and NEM bounced off 10-dma support.
Gold and silver miners have made their 2025 projections based on gold prices that were at least $1,000 lower and silver prices that were at least $15-20 lower earlier in the year. As gold and silver pull back and define their new price plateaus, profitability among the mining stocks should remain robust. Thus it will be interesting to see how these play out in any continuing market correct, because historically major sell-offs in stocks has generally dragged mining stocks down as well as forced selling overcomes the market. Stay tuned.
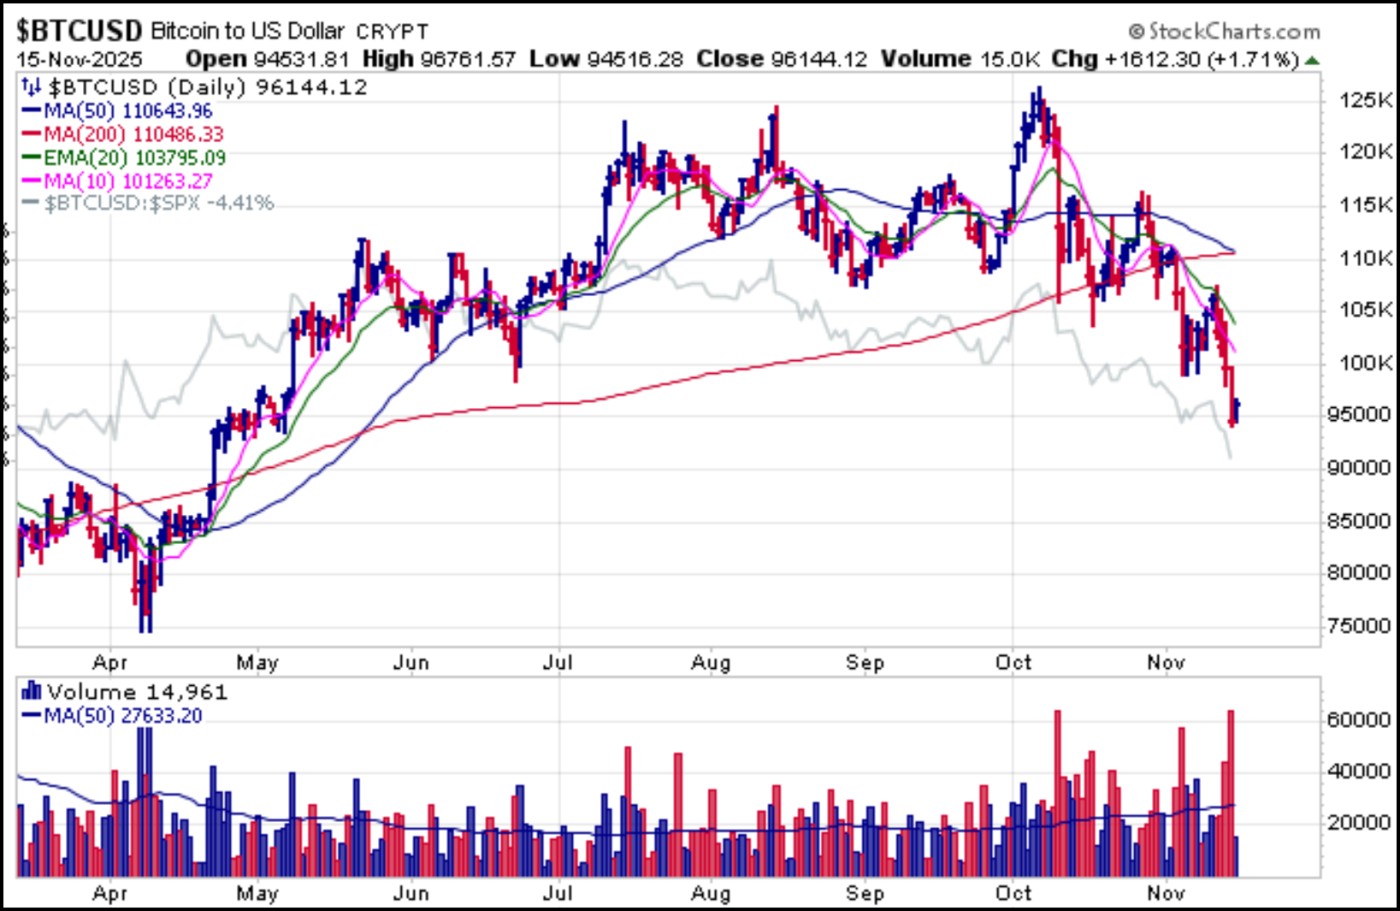
 Bitcoin ($BTCUSD) remains a basket case as it now trades below the $100,000 level. This leads many to ask what is wrong with Bitcoin. We identified a potential problem months ago when we questioned whether dependence on government intervention and support was the bane of $BTCUSD's existence as a legitimate alternative currency that was originally designed as a way to avoid any involvement with corrupt governments and their paper fiat currencies. A healthy correction, or does the market feel that $BTCUSD has been corrupted? Keep in mind what the market feels can stay irrational for longer than one can stay liquid so never argue with the market. Fundamentally, nothing material has changed which has been the case since it was launched in 2009. Mathematics guides Bitcoin and blockchain is its beating heart.
The current correction in $BTCUSD is due to broader macroeconomic pressures and liquidity shifts with reduced odds of a rate cut rather than a wholesale loss of confidence in Bitcoin’s foundational integrity. Global liquidity is the best predictor of general market direction. By general, I mean to expect periods of decoupling between liquidity and market direction lasting up to a number of weeks before correlation catches up.
 On November 2nd we wrote in this report that, " Many economically-sensitive areas of the market remain in stealth bear markets while the big index-influencing tech names continue to drive the market higher, at least on the surface." During our weekly live market webinars we have also discussed the divergence and bifurcation in the market as most sectors were weak while big-stock techs and index-influencers in the AI space kept the major market in overall uptrends. Now we are seeing the cracks underneath the surface of the market come up to to ground level where the picture becomes more obvious. For now, we advise caution as investors who remain long anything in this market should review selling guides and risk-management plans.
The Market Direction Model (MDM) remains on a CASH/NEUTRAL signal.