
 The broader non-tech centric indexes, the roughly 3,500 stock NYSE Composite and the 2,000 stock small-cap Russell 2000 illustrate the greater weakness seen in economically sensitive names as both indexes are now trading below their 50-day moving averages.
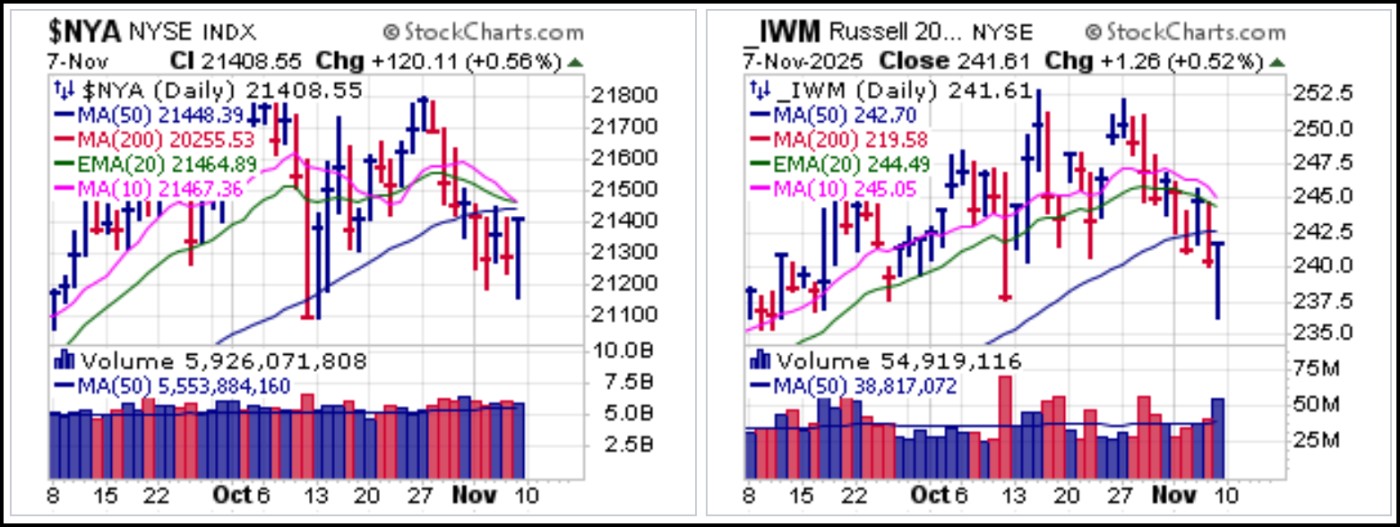 We issued Short-Sale Set-Up reports on Nvidia (NVDA) and IREN Ltd. (IREN) on Thursday morning as they were breaking near-term support levels. NVDA busted 20-dema support to trigger a short-sale entry Thursday morning, while IREN played out as a double-top short-sale (DTSS) entry as it reversed back below the 74.15 left-side peak of the cup base from which it tried to break out but failed earlier in the week. Both stocks immediately moved lower before NVDA posted an MAU&R cover point at the 50-dma and IREN a near-term MAU&R cover point at the 20-dema. These are potentially playable as long entries, possibly for swing-trades, as we see how far the market is able to rally following Friday's MAU&R at the 50-dma in the tech centric NASDAQ and S&P 500 Indexes.
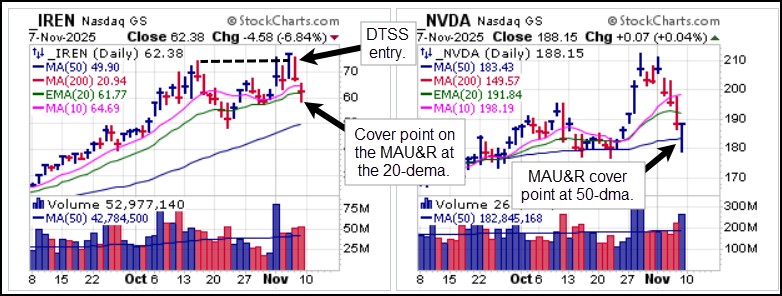 A Short-Sale Set-Up report was sent out Friday, late in the market sell-off, for D-Wave Quantum (QBTS) and Rigetti Computing (RGTI). As Gil points out, this is late in the downside moves for both even as they broke 50-dma support early on Friday. The proper, optimal short entries were at the 20-demas earlier in the week. Thus, QBTS and RGTI moved in sync with the tech centric market indexes, the NASDAQ and S&P 500 to post moving average undercut & rally (MAU&R) moves at their 50-dmas on Friday. Technically, these are actionable as potential long entries using the 50-day lines as selling guides and potential flip points back to the downside. The main takeaway here is that as stocks come down, trying to short these names after they are already extended on the downside implies greater risk. Reacting late when things get obvious tends to work less effectively.
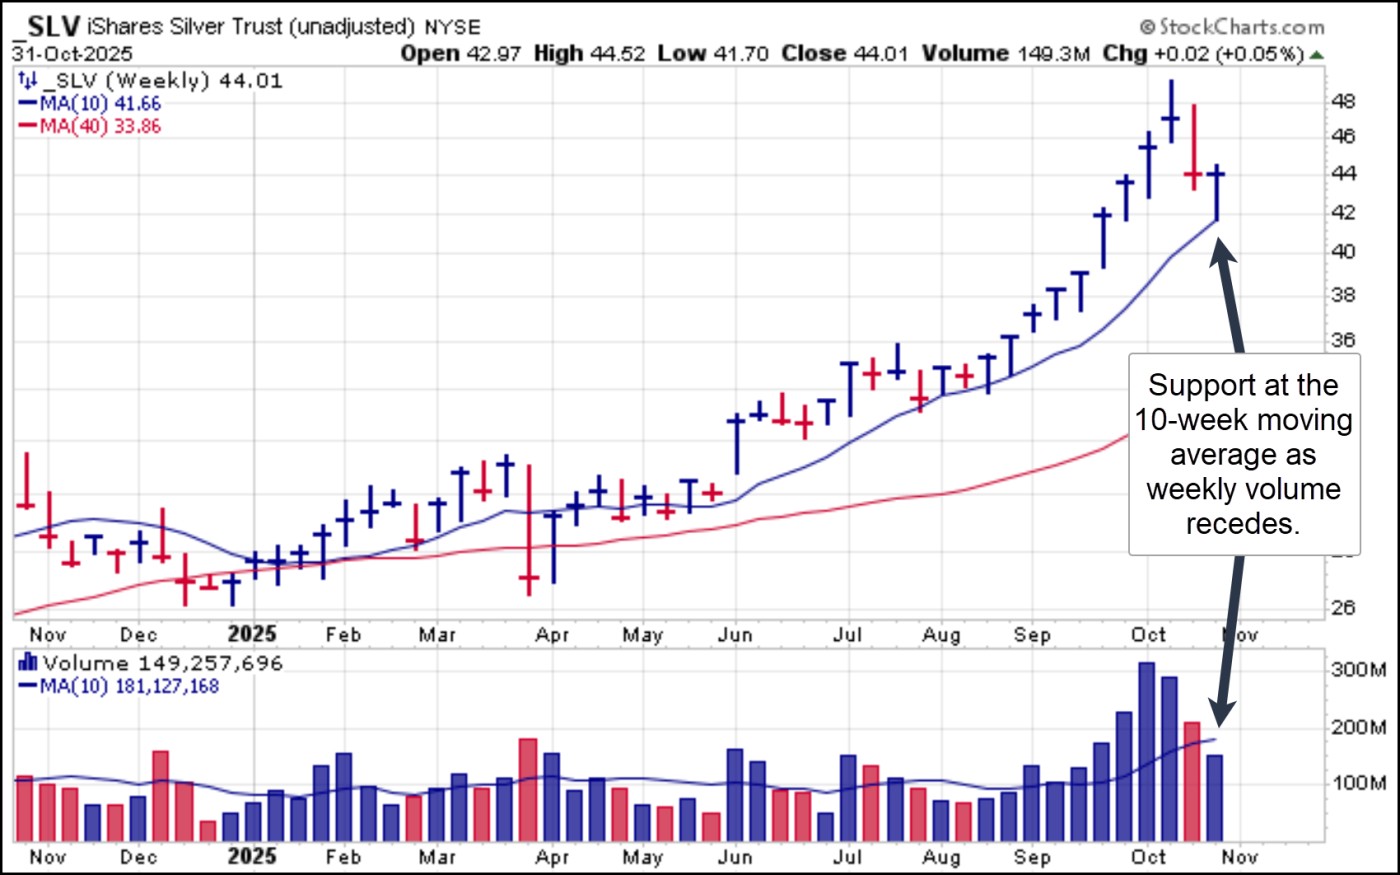
 Gold and Silver remain in potential consolidation phases as their weekly charts show. Both the SPDR Gold Trust (GLD) and iShares Silver Trust (SLV) have pulled down near 10-week moving average support as weekly volume has dried up sharply.
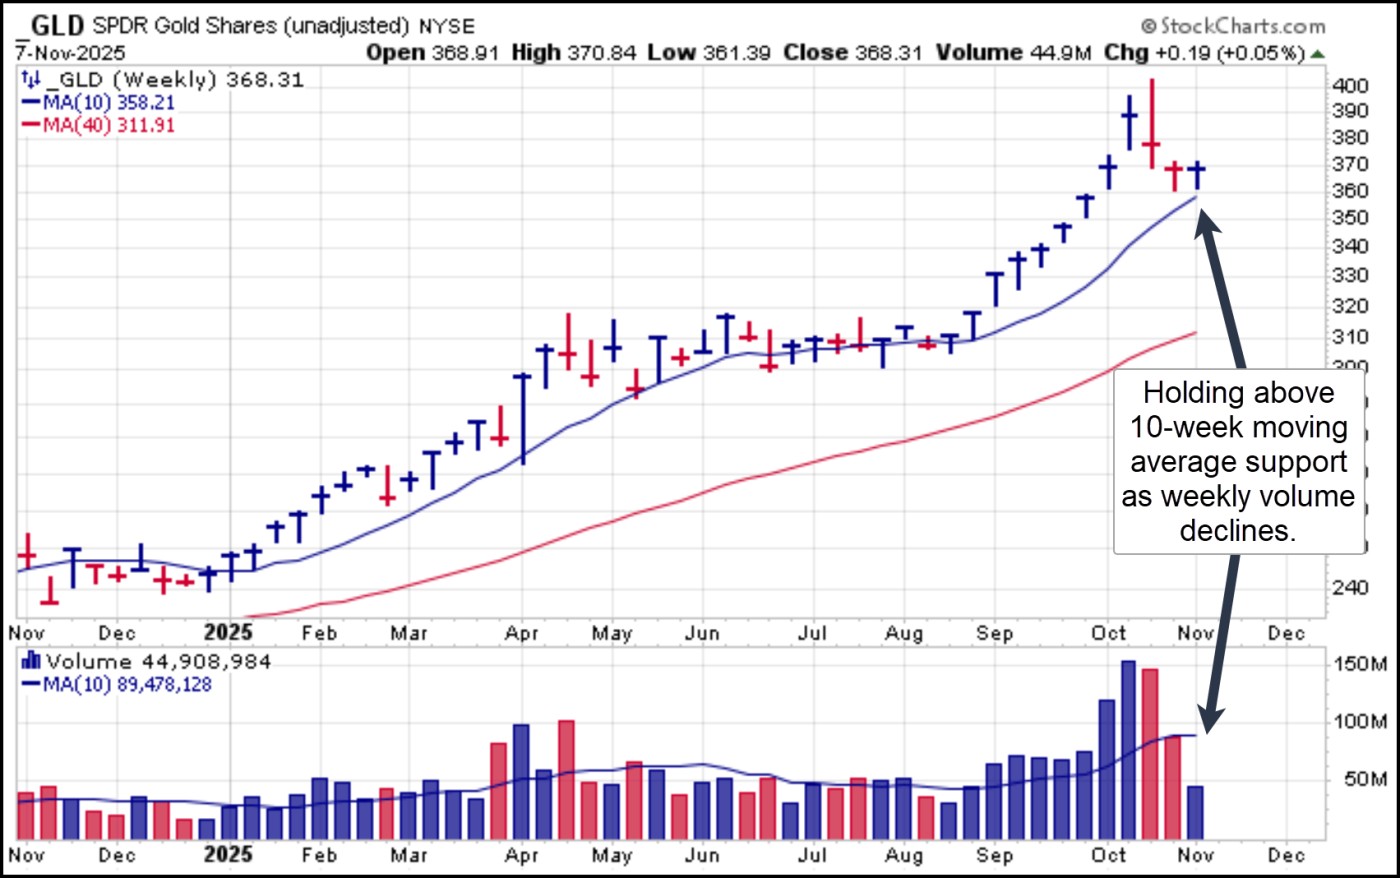
 Bitcoin ($BTCUSD) on the weekly chart shows its first break and close below 40-week moving average support since late March. It has primarily played out as a short-sale target since failing on a breakout and triggering a double-top short-sale (DTSS) entry five weeks ago. $BTCUSD would need to regain the 40-week/200-day moving average before it would become viable on the long side. For now, downside risk remains in place.
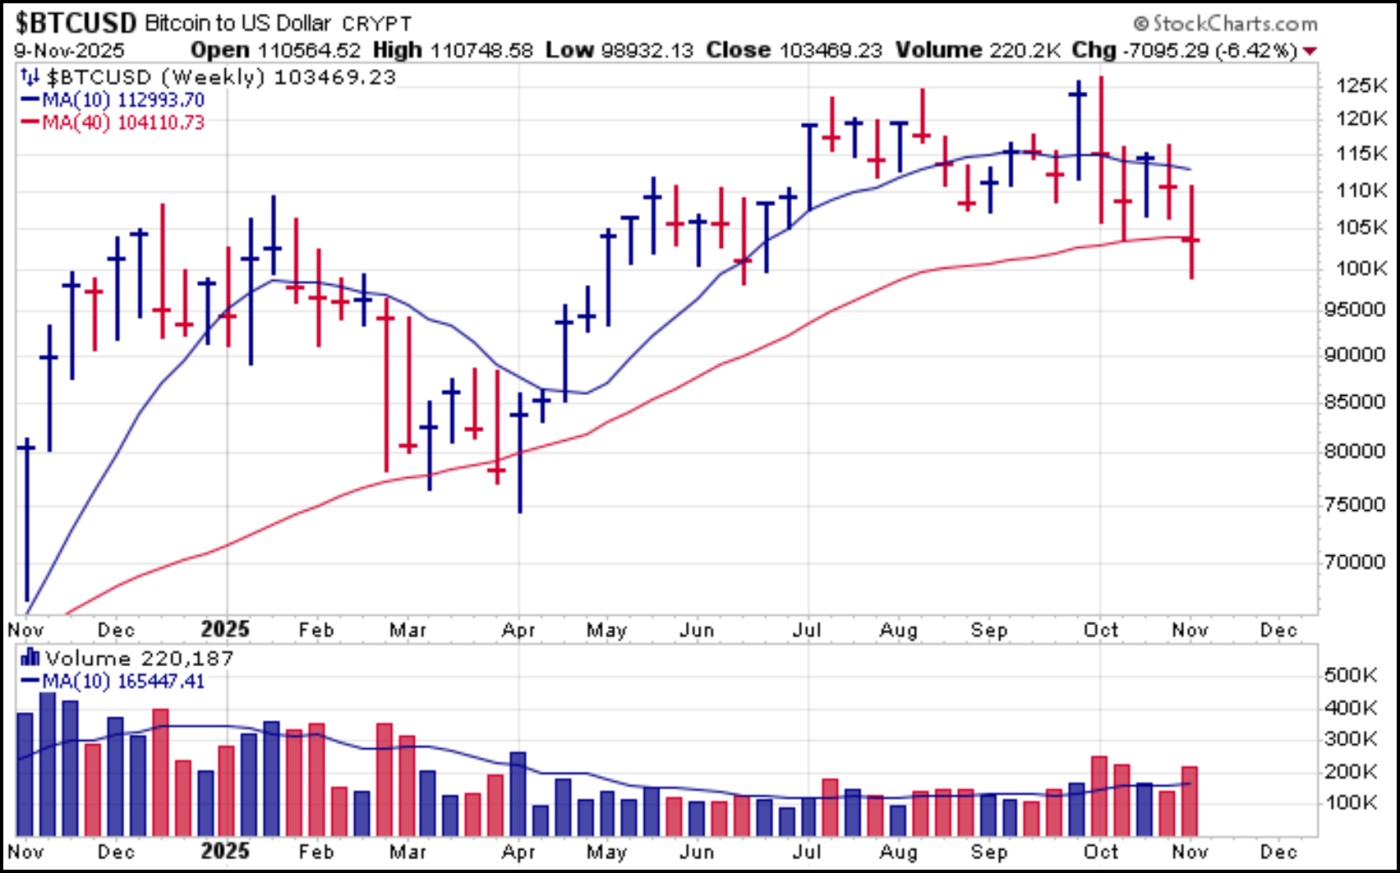 Friday's market bounce was logical as the tech centric indexes posts U&Rs at their 50-dmas while most stocks were extended on the downside and in potentially near-term oversold positions. It is now a matter of seeing how this rally holds up as we enter the new trading week.
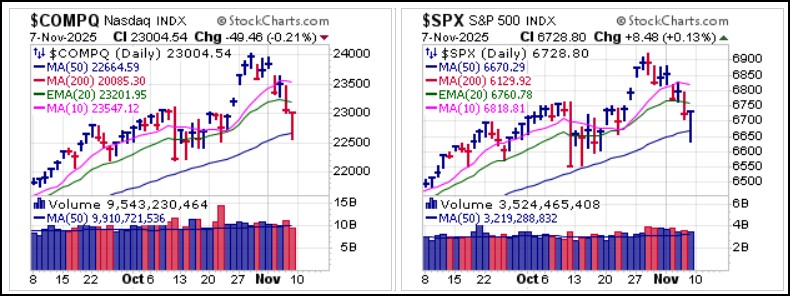
The Market Direction Model (MDM) switched to a CASH/NEUTRAL signal on Friday morning, November 7, 2025.