
Major market indexes gapped higher on Monday on positive U.S.-China trade news last weekend and then spent the rest of the week churning around near recent highs. Big-volume stalling ranges on the NASDAQ Composite and S&P 500 daily charts as they spun around on Friday shed some light on the volatile intraday action. Meanwhile, the NYSE Composite had its own battle at the 50-dma on Friday as it shook out at the line and closed flat along with the Dow which earlier in the week twice cleared the 48,000 level on an intraday basis before backing down.
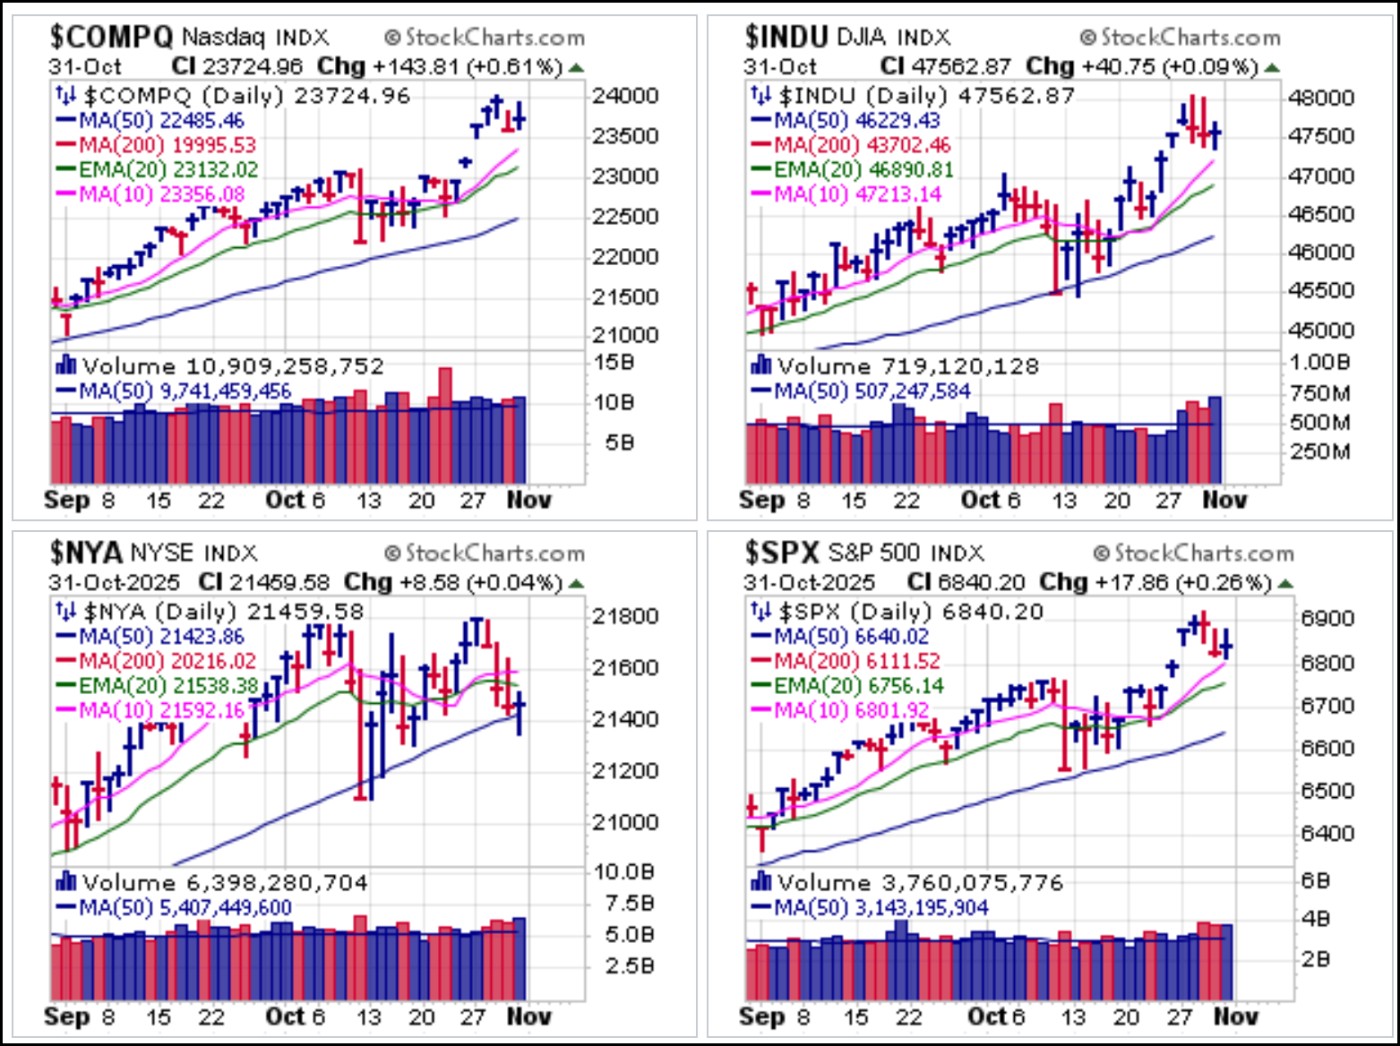
The NYSE Composite’s action for the week, a five-day downtrend off the Monday peak, reflects the relative weakness of less tech centric, more economically-sensitive names that ran into trouble after Head Fedhead Powell’s comments on Wednesday about stagflationary pressures. Despite the 1/4% rate cut from the Fed on Wednesday, interest rates as measured by the 3-Month Treasury Yield ($IRX), 10-Year Treasury Yield ($TNX), and 30-Year Treasury Yield ($TYX) rallied on the news before short-term rates via the $IRX declined as the $TNX and $TYX continued to push higher.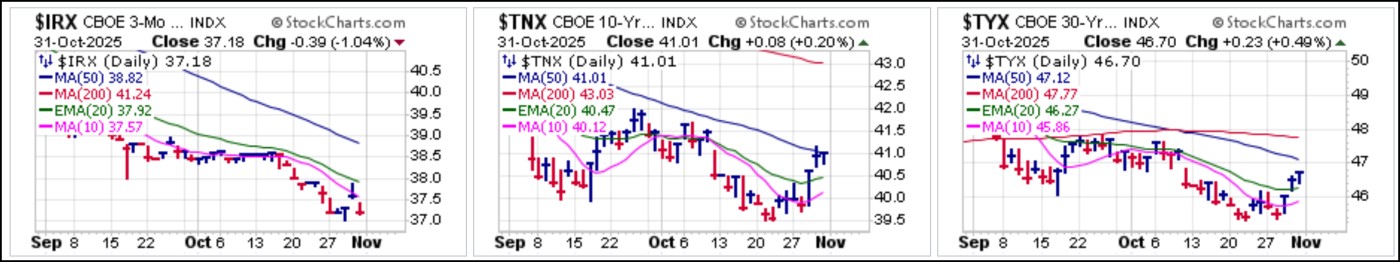
Alphabet (GOOGL) posted a BGU on Thursday after earnings Wednesday afternoon, and also showed a long upper tail on the price bar. Like AMZN, that remains a buyable BGU using the 280.06 BGU low on Thursday as a selling guide. Meta Platforms (META) certainly found direction after earnings on Wednesday, and that was to the downside as a Shortable Gap-Down (SGD) on Thursday. That remained a short entry at 200-dma resistance on Friday as the stock posted a lower closing low. Microsoft (MSFT) gapped down and kept on going on Thursday before breaking the 20-dema on Friday. That set a potential late-stage failed-base (LSFB) short-sale set-up into motion, with the stock holding support at the 50-dma.Western Digital Corp. (WDC) that closed in the upper half of its price range. That looks constructive, for now, but the stock is clearly extended on the upside and not actionable currently.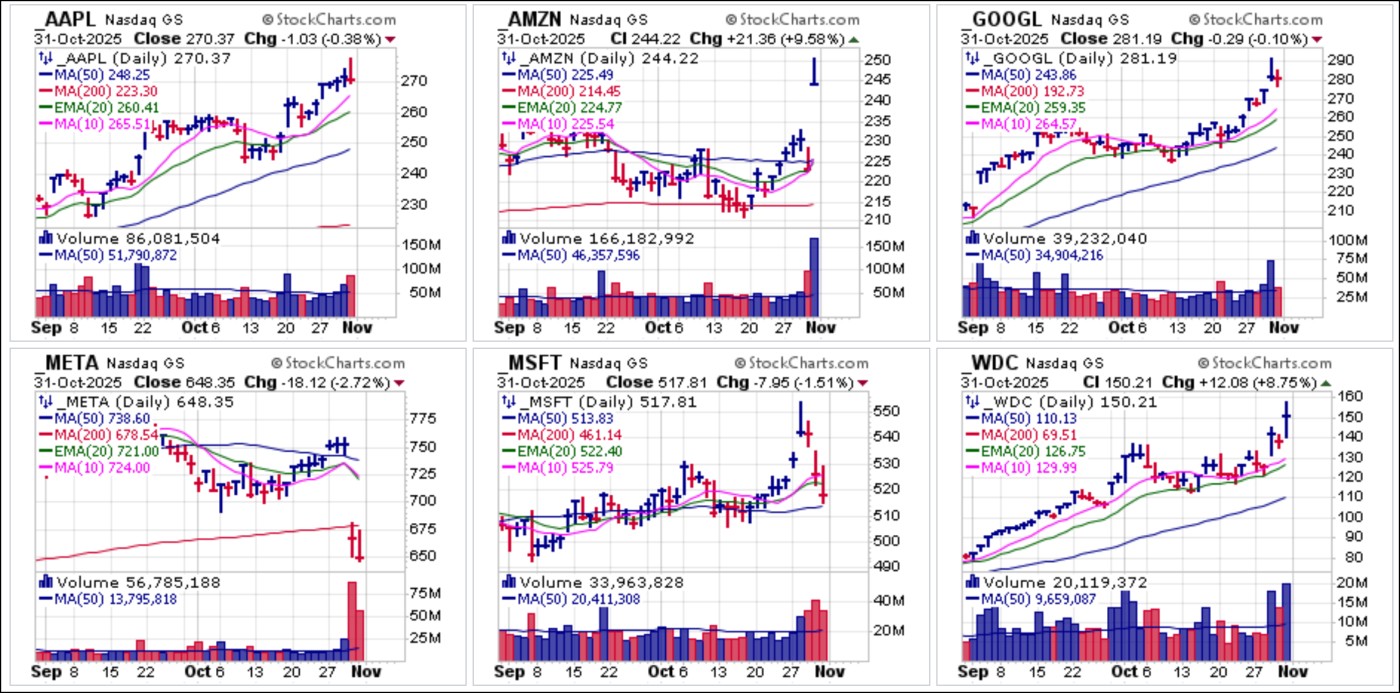
 Gold and silver continue to correct. Despite gold correcting over 11.29% off its $4,381.58 peak of two weeks ago, Spot Gold still ended the week just below the $4,000 level at $3,997.10 an ounce. So while some expected gold to peak at $4,000, in fact it went 10% past before correcting back to the $4,000 level. So far, gold, as measured by the SPDR Gold Trust (GLD) has held above 10-week moving average support on the weekly chart as it corrects following a nine-week parabolic in September and October.
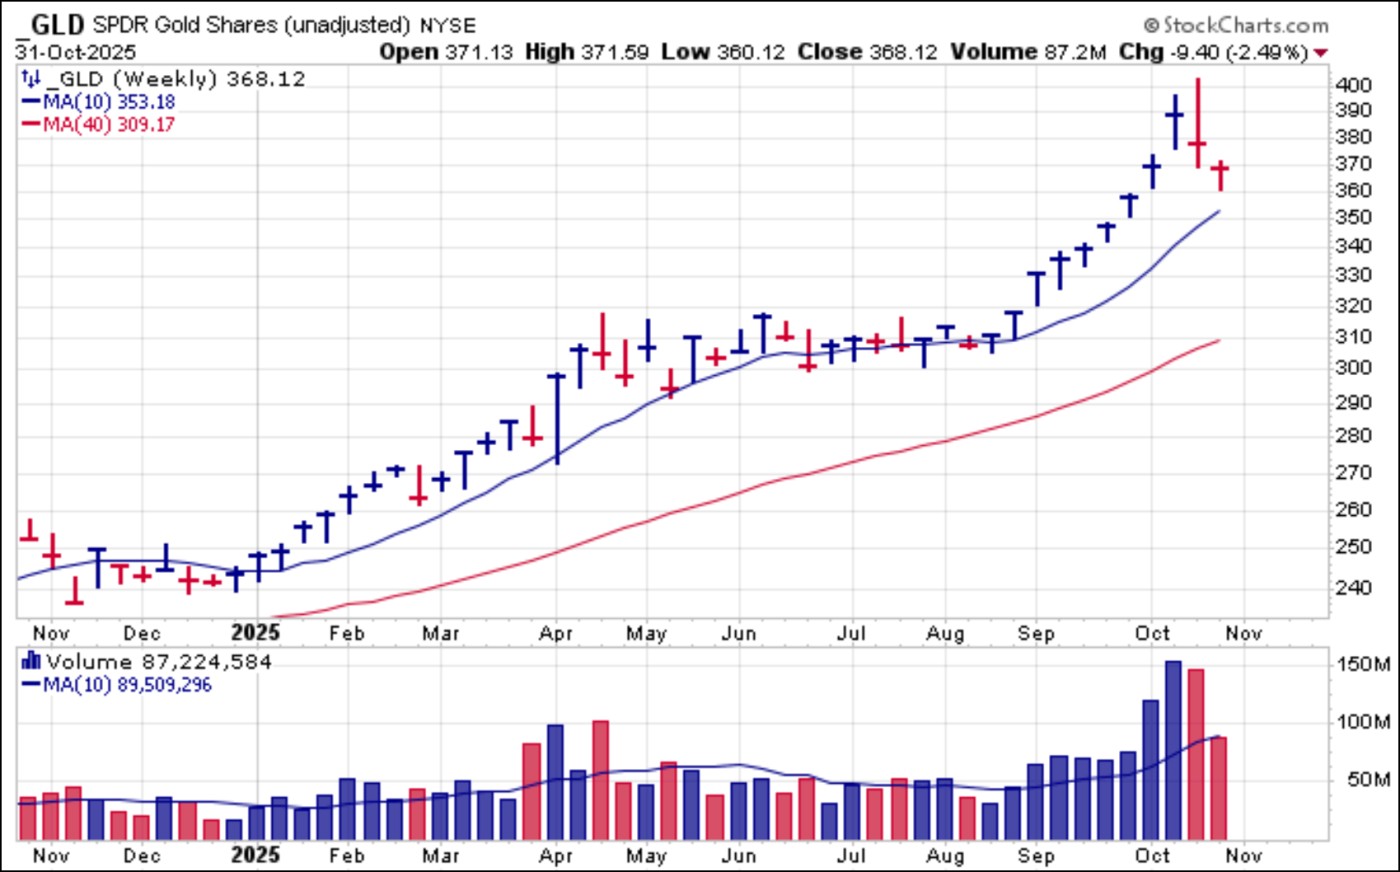 The weekly chart of silver via the iShares Silver Trust (SLV) shows clean support at the 10-week moving average as the white metal consolidates prior sharp gains after clearing the $50 level for the first time in history two weeks ago. Silver remains within 10% of its recent highs with Spot Silver ending the week at $48.65 an ounce. We would not expect the $50 level to serve as a reference for hard support, but as an area around which silver will attempt to stabilize around the $50 level after regaining the 20-dema on the daily chart (not shown) on Thursday.
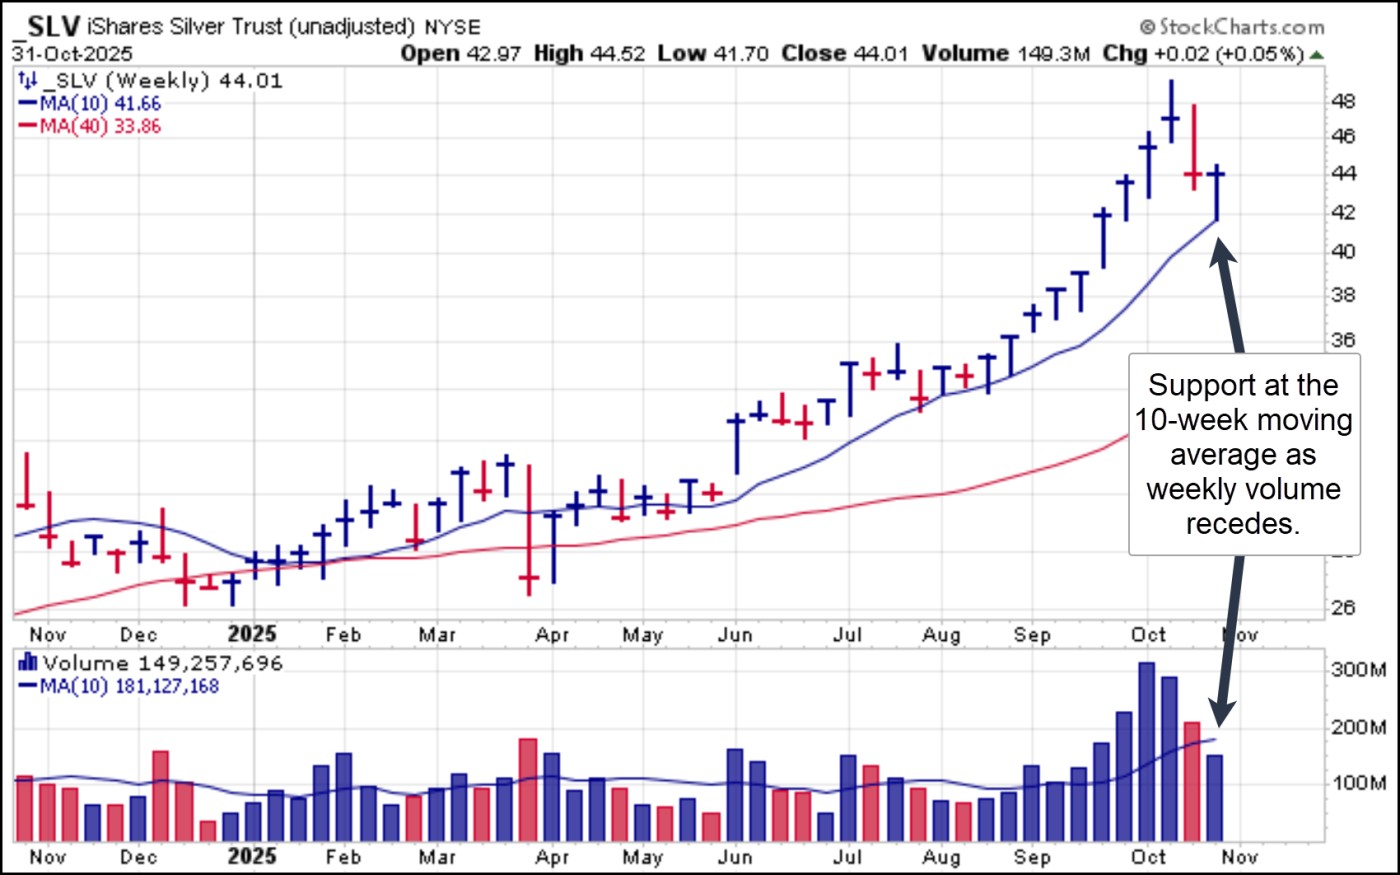 Bitcoin ($BTCUSD) continues to lack any clear direction as it continues to swing around between 50-dma resistance on the upside and 200-dma support on the downside. For now we do not see this as actionable unless $BTCUSD can regain 50-dma support on the long side or whether it busts 200-dma on the short side.
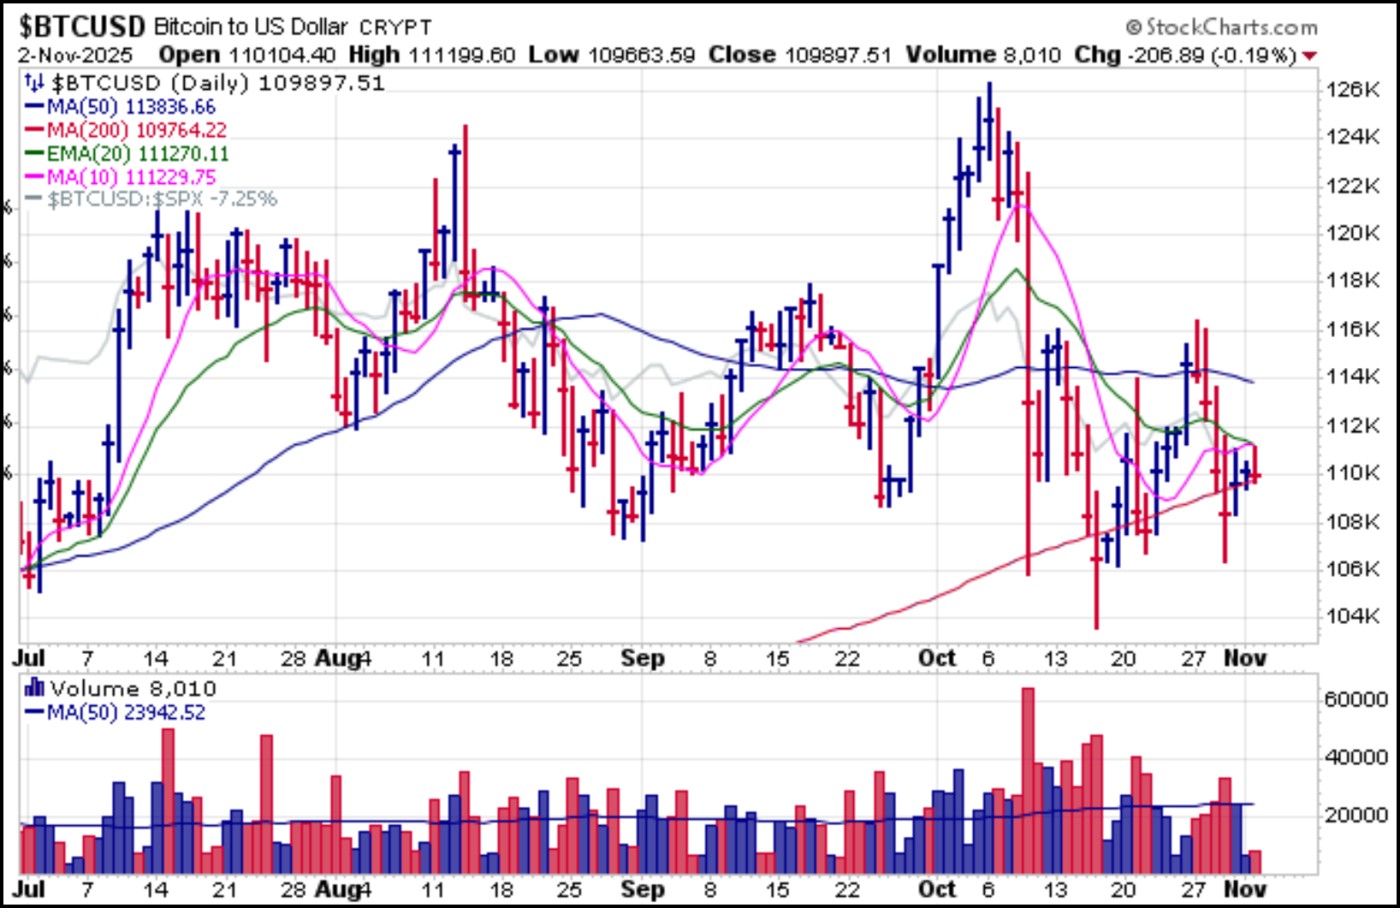 No reports were sent out this week as the market shows us few optimal targets. Many economically-sensitive areas of the market remain in stealth bear markets while the big index-influencing tech names continue to drive the market higher, at least on the surface. Earnings season continues apace, and it remains to be seen whether any new opportunities arise as we move into November.
The Market Direction Model remains on a BUY signal.