Read our free, updated as of Mar 3, 2022, Dr K report on how to
optimize your mind and body so you can boost your focus when trading the markets.
YES, SEND ME THE REPORT !
Meet Dr K !
Nuclear physicist
Stock & crypto market wizard
Blockchain builder
Bestselling author
Top 40 charted musician
Biohacker
Former computer hacker
YES, SEND ME THE FILE !
YES, SEND ME BOTH !
Sign Up Below to Receive Dr K's Optimization Strategy
Your email will always remain private.
Get Our FREE Market Lab Report + $29 Two-Week Trial
Proven Strategies That Outperform Major Averages
Get 2 weeks access for $29
**16th Anniversary** [Launched in 2010]
**16th Anniversary**[Launched in 2010]
The William O’Neil (Investor's Business Daily) Disciples, Dr. Chris Kacher and Gil Morales,co-authors of “Trade Like an O’Neil Disciple: How We Made 18,000% in the Stock Market”, and and top performing portfolio managers for legendary investor William O'Neil,show you how togain a material edge in today’s market
When breakouts become obvious and everybody sees them, decreasing their effectiveness, stop running
with the herd and learnLearn to use the alternative buying techniques employed by Dr. K and Gil togain an advantage over the crowd.
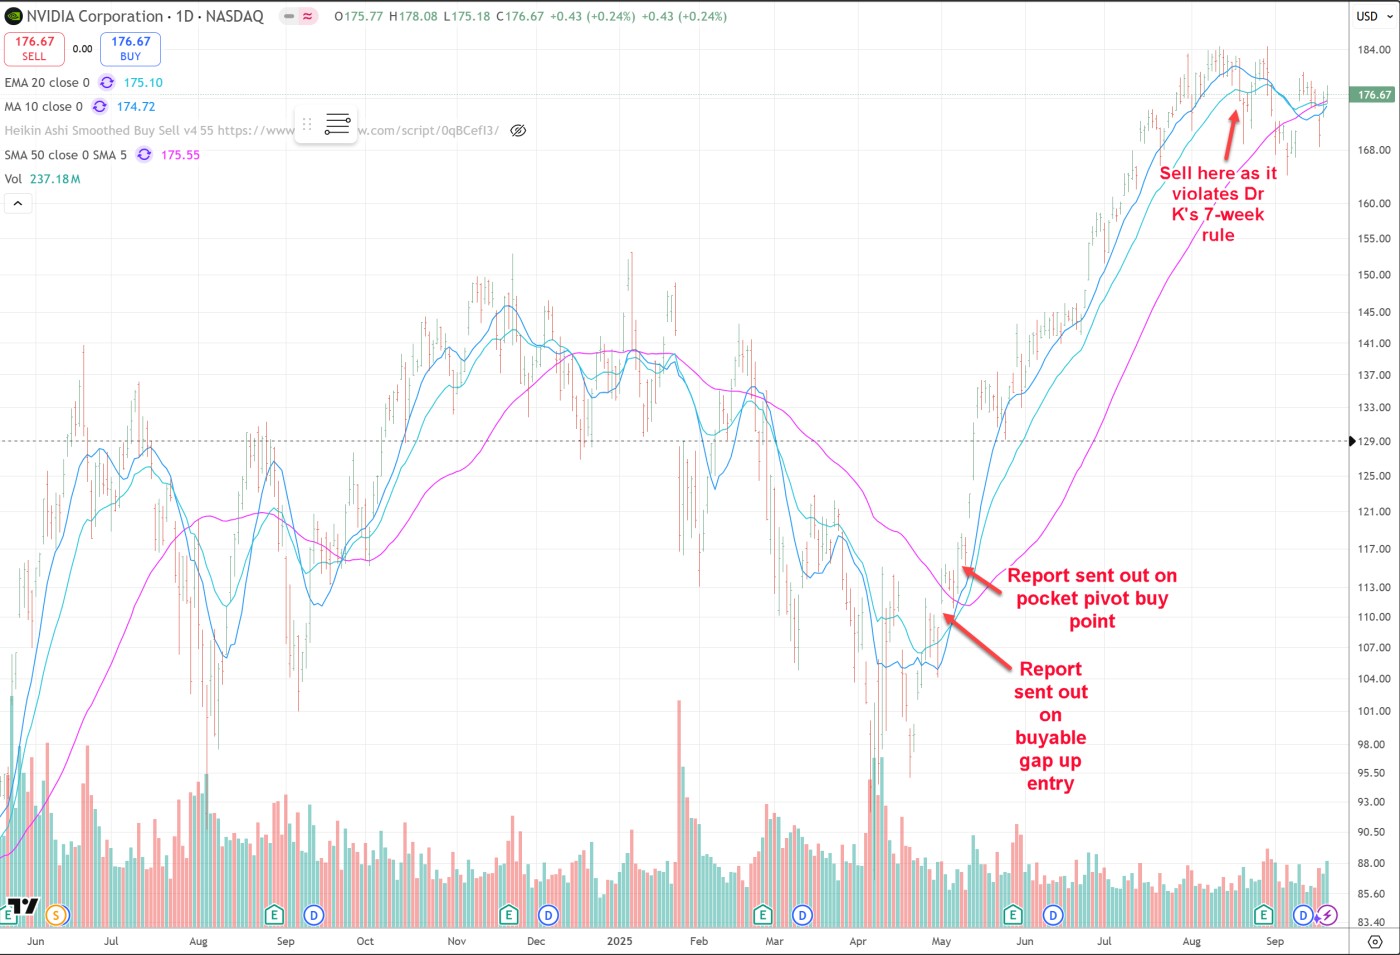
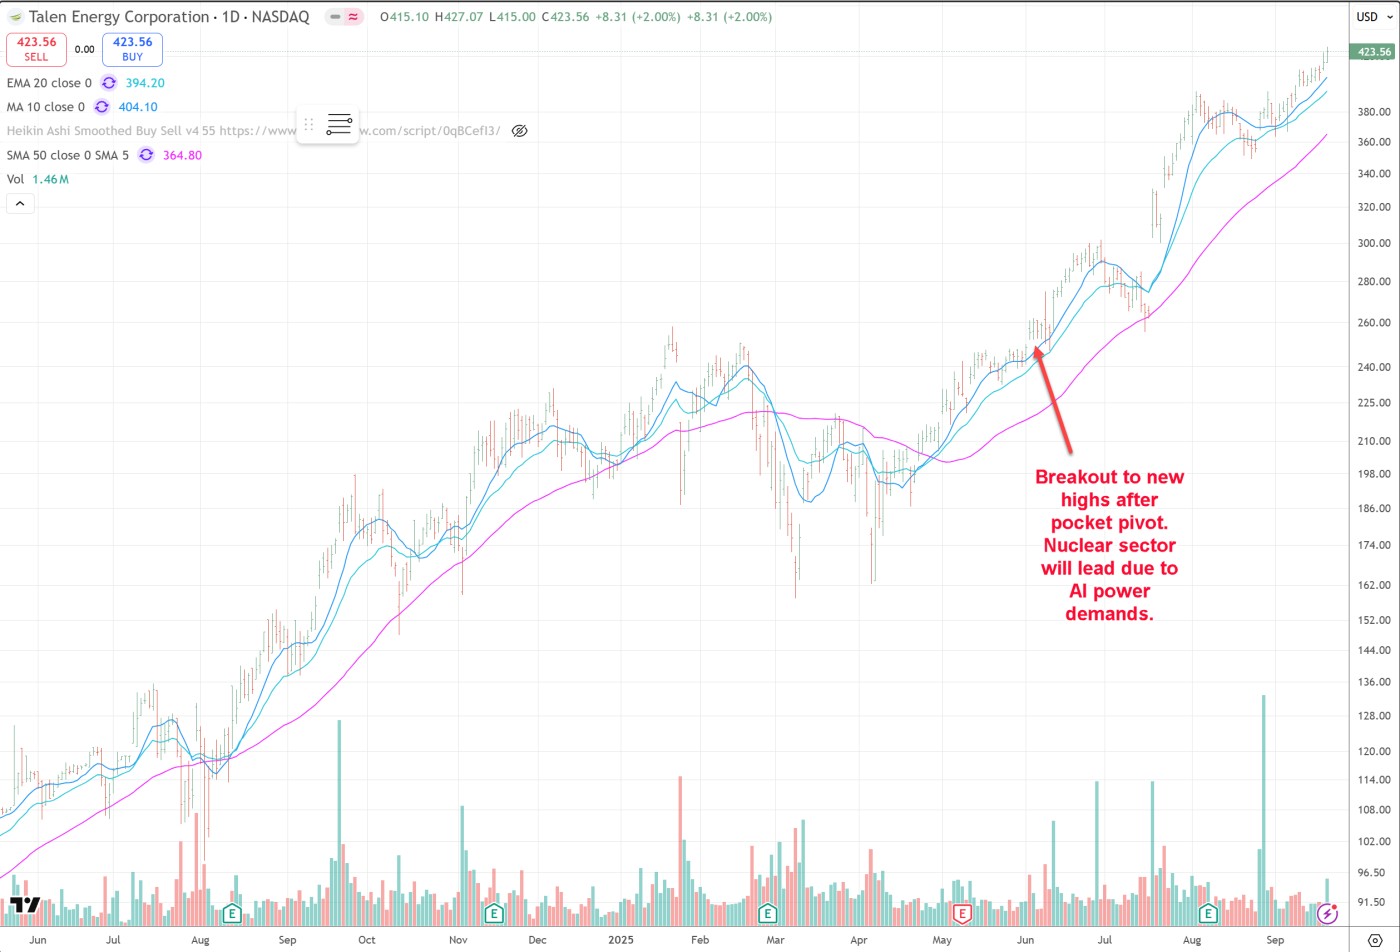
Pocket Pivots™, Buyable Gap-Ups™, VooDoo, and Undercut & Rally are powerful buying techniques that take O’Neil-style growth investing to the next level.
Use Dr. K’s Timing Modelsto ensure you are in sync with the marketor trade index and sector ETFs based on the models’ buy, sell, and neutral/cash signals.
Beat the Market with Proven Stock + ETF Selection
Stop guessing. Stop holding through crashes.
Get clear, actionable signals with pocket pivots, buyable gap-ups, undercut & rally setups, and volume dry-ups - delivered by two market wizards' proven systems.
“ My account is up 86% since joining - best decision I’ve made in years.”
Richard H., Portfolio Manager
“ Turned $50,000 into $214,000 in under 14 months.”
David B., Portfolio Manager, Family Office
“ The system helped me afford sending my parents on a first-class trip around the world.”
How have we done so far this year (as of September 2025)?
As seen on: CNBC, Bloomberg, Reuters, Fox Business News, Forbes, Barrons, U.S. News & World Report, MarketWatch, Technical Analysis of Stocks & Commodities, Michael Covel's Trend Following
OUTPERFORMING STOCKS
Supercharge your profits using our time-tested, optimized, low risk buying strategies includingUndercut & Rally, VooDoo low volume signatures, Buyable Gap-Ups and Pocket Pivots.
We combine positive fundamentals with technical timing to stack the odds in your favor.One stock can make a big difference if that stock is a future leader, so we tend to focus on quality over quantity. William O'Neil typically only held 3 to 4 stocks in total during strong bull markets.
Members over the years have said what we always say: The trade of a lifetime comes along every few weeks. And this makes all the difference to one's portfolio.
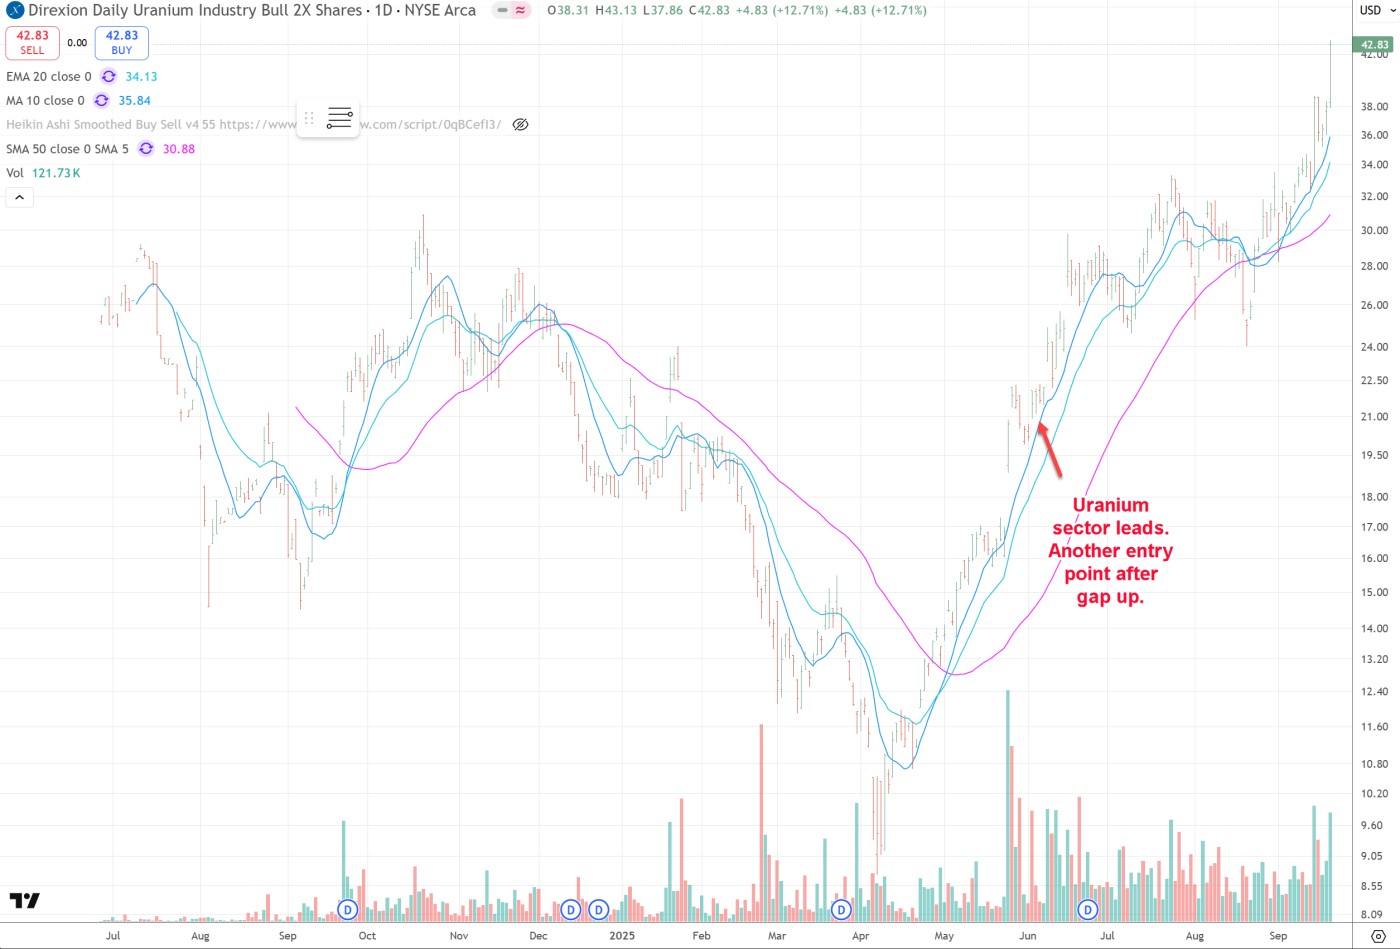
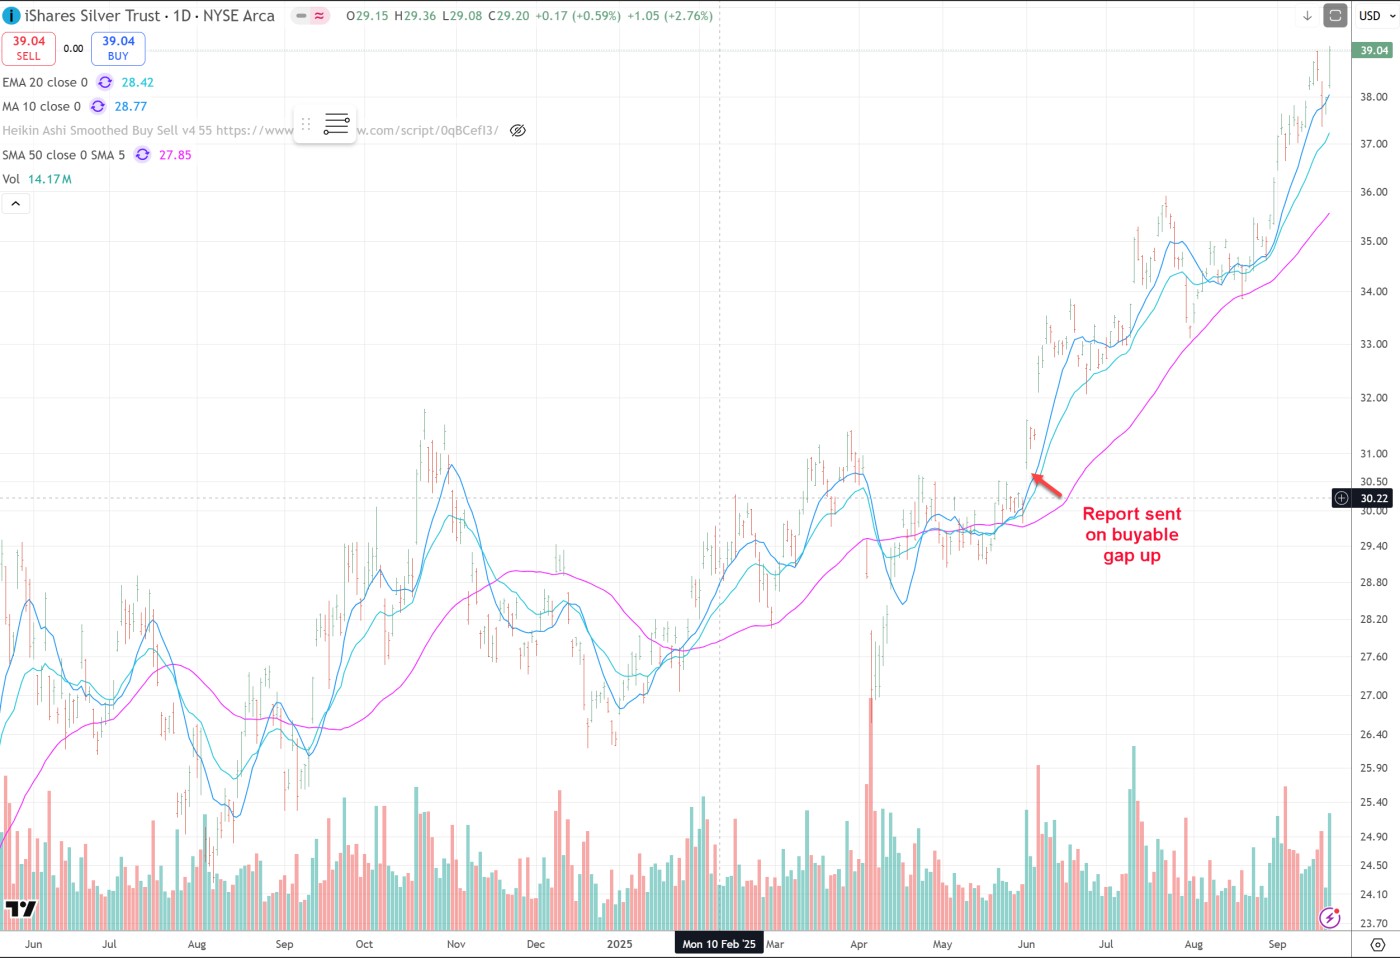
Capturing the right side of trends in specific sectors, whether bullish or bearish, has been key such as the uranium sector, AI stocks (Mag 7 et al), bitcoin-related, and gold & silver-related, among others.
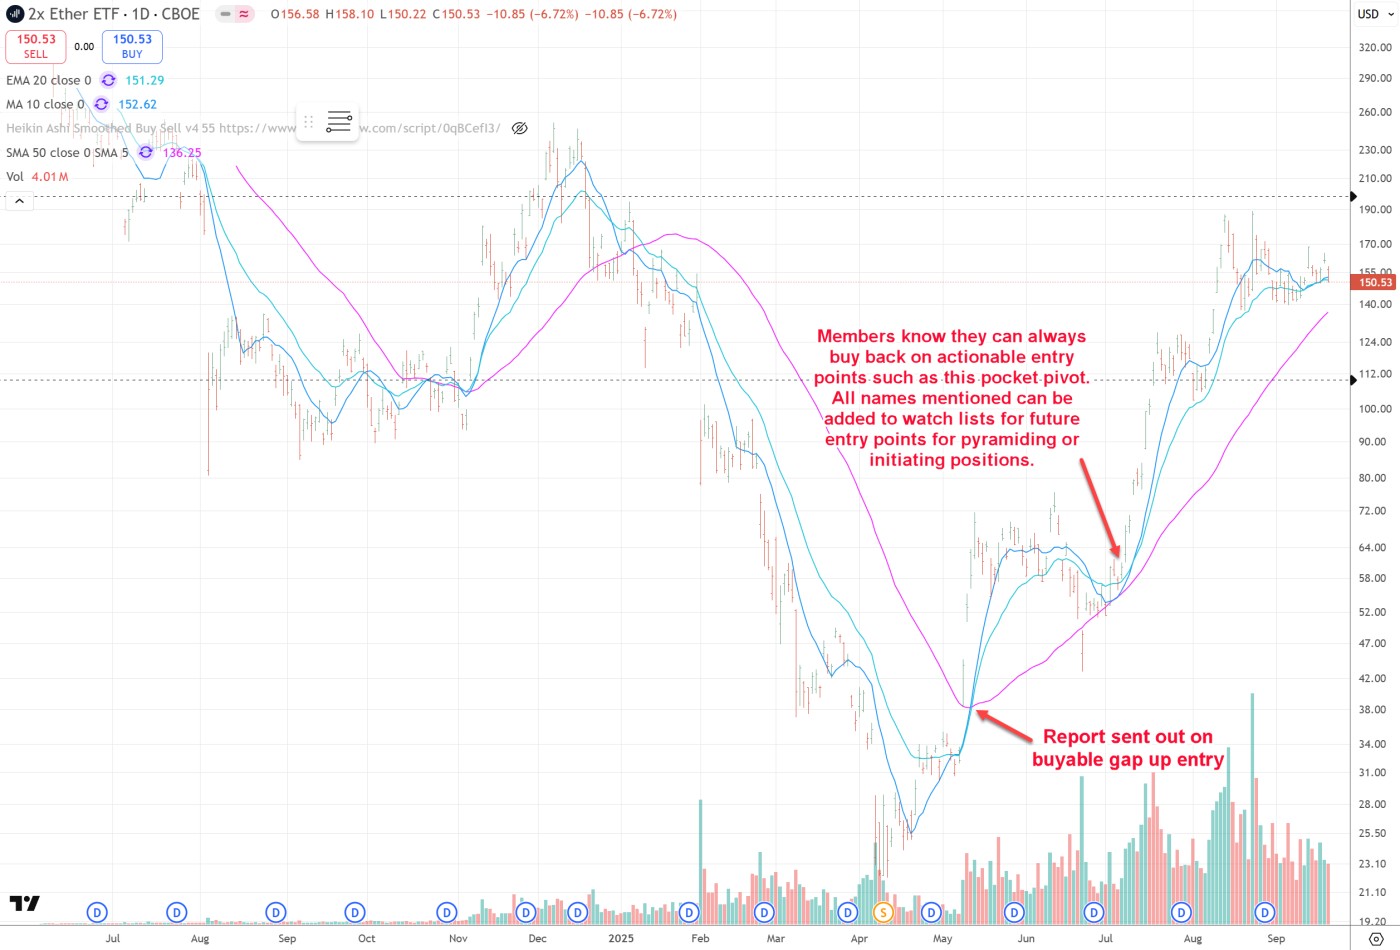
All names mentioned can be added to watch lists for future entry points for pyramiding or initiating positions.
By keeping stops tight as we always advise, profits from your winning trades should well outweigh any losses.
Here are some examples on how we handle trades:
Please enable javascript
Please enable javascript
Please enable javascript
Please enable javascript
Please enable javascript
Please enable javascript
Please enable javascript
Please enable javascript
Please enable javascript
Please enable javascript
Please enable javascript
We also capitalize on unusually volatile markets such as in early 2020. Here are examples showing how we averted the crash then profited on the recovery:
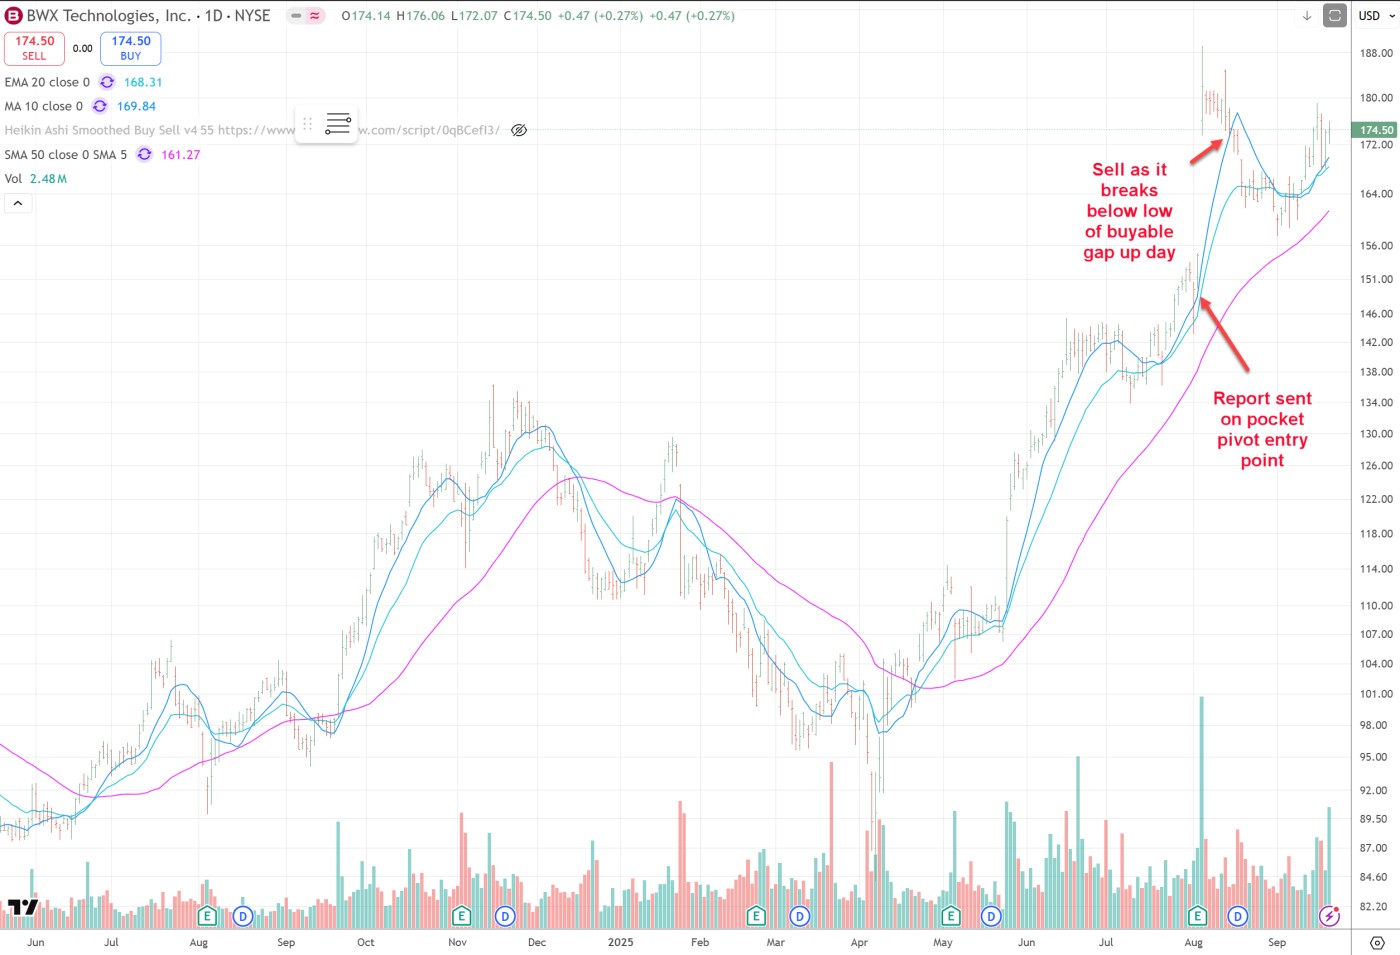
Just because a stock is "extended" on a gap-up move doesn't mean you can't buy
it.
The fact is that in many leading stocks, a Buyable Gap-Up™ can often be your most profitable buy
point!
ProShares Bitcoin Strategy (BITO) on March 13, 2023 at $13.85
Please enable javascript
We added Proshares Bitcoin Strategy ETF BITO near the low of the day when the Fed printed large sums of capital to rescue major banks.
Agnico Eagle Mines (AEM) on March 13, 2023 at $47.55
Please enable javascript
Precious metals are volatile but can enjoy fierce trends in either direction. Buyable Gap-Ups and undercut & rally patterns are a great way to tilt the odds in your favor.
Momo (MOMO) on March 7, 2017 at $30
Please enable javascript
Momo (MOMO) posted a buyable gap-up after earnings on March 7th, looking "extended" at that point, but for those who know how to implement the rules of buyable gap-ups, the stock could have easily been purchased at that point. Interestingly, we had already issued a pocket pivot alert to our members on January 23rd as MOMO was rounding out the lows and starting to come up the right side of what turned out to be a new base. This occurred well before and far below any kind of standard-issue base breakout, and allowed investors to get in long before the March buyable gap-up.
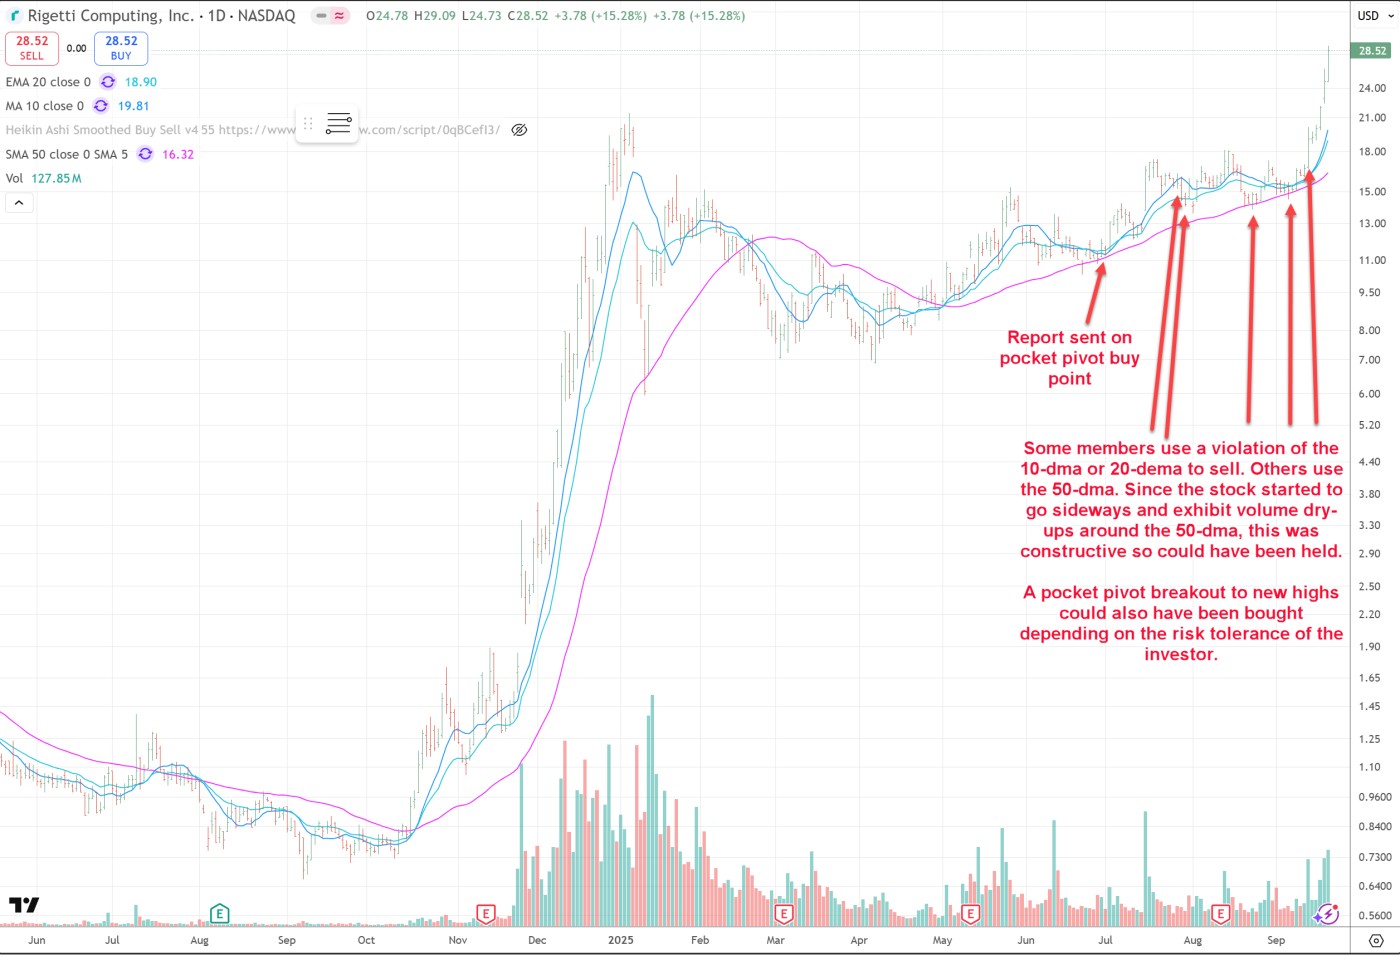
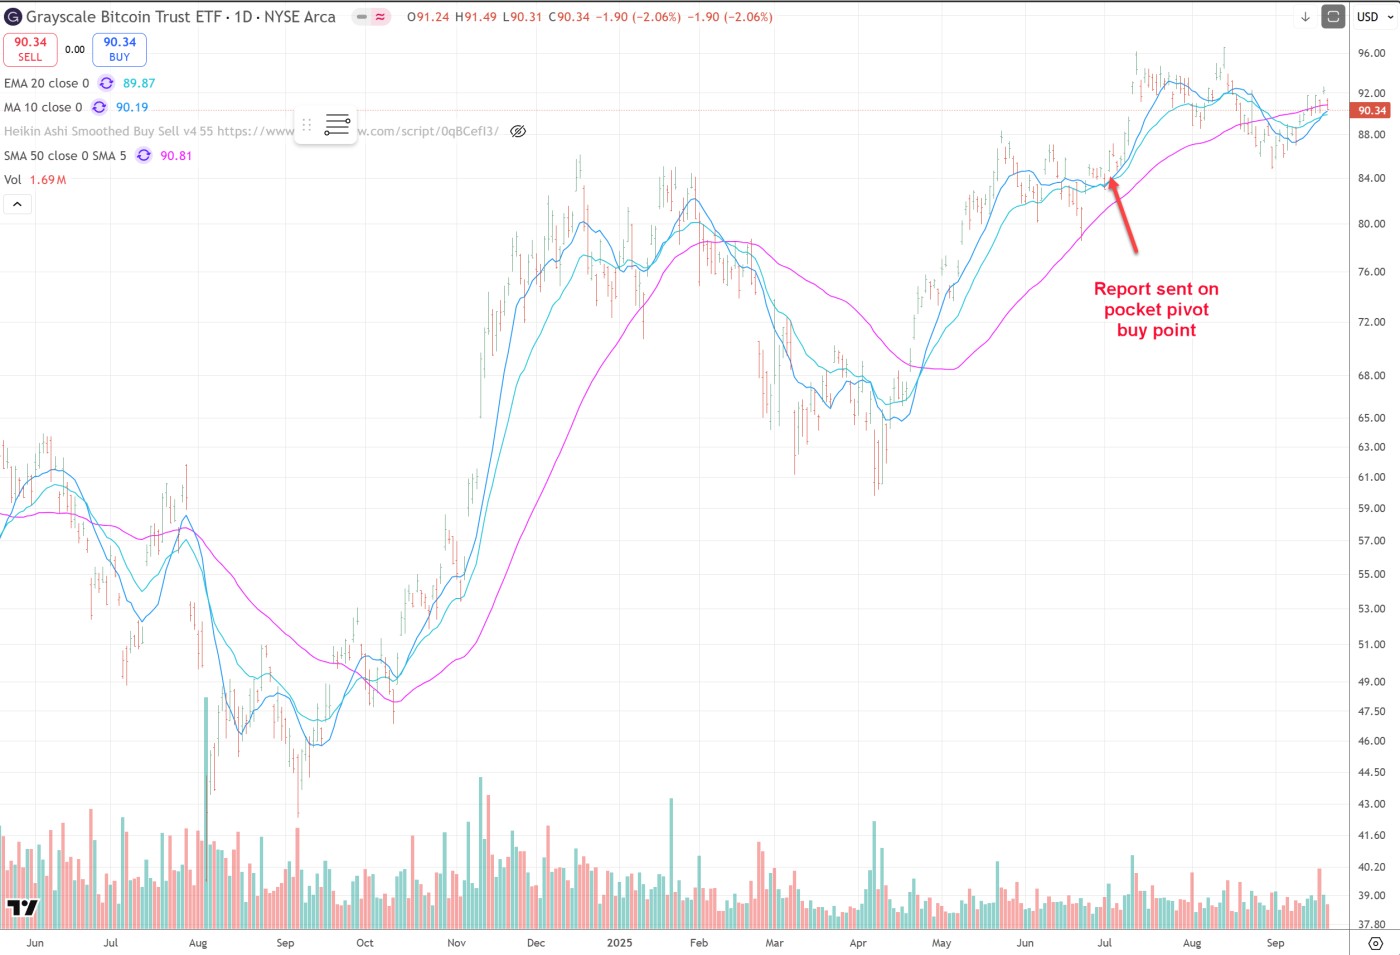
Use Pocket Pivot™ buy points to purchase a stock when it's still within its base,
before the crowd sees it!
Bitcoin Investment Trust (GBTC) on October 30, 2017 at $720
Please enable javascript
Maybe you missed the recent "Bitcoin mania," but we didn't. On October 30, 2017, we issued a Pocket Pivot Report alerting members to the set-up in the primary Bitcoin ETF, the Bitcoin Investment Trust (GBTC) when it was trading at $720. The move from there was epic, as has been well-documented in the media, with GBTC quickly eventually going into a climactic, parabolic price move that carried to an eventual peak of $3,523 in December. The Bitcoin phenomenon can at times appear incoherent and emotionally-driven, but our work has shown that precise buy signals can and do show up for crypto-currency-related stocks and ETFs alike. We believe that blockchain technology is real, and that more such investment opportunities based on this theme have the potential to appear in 2018 and beyond.
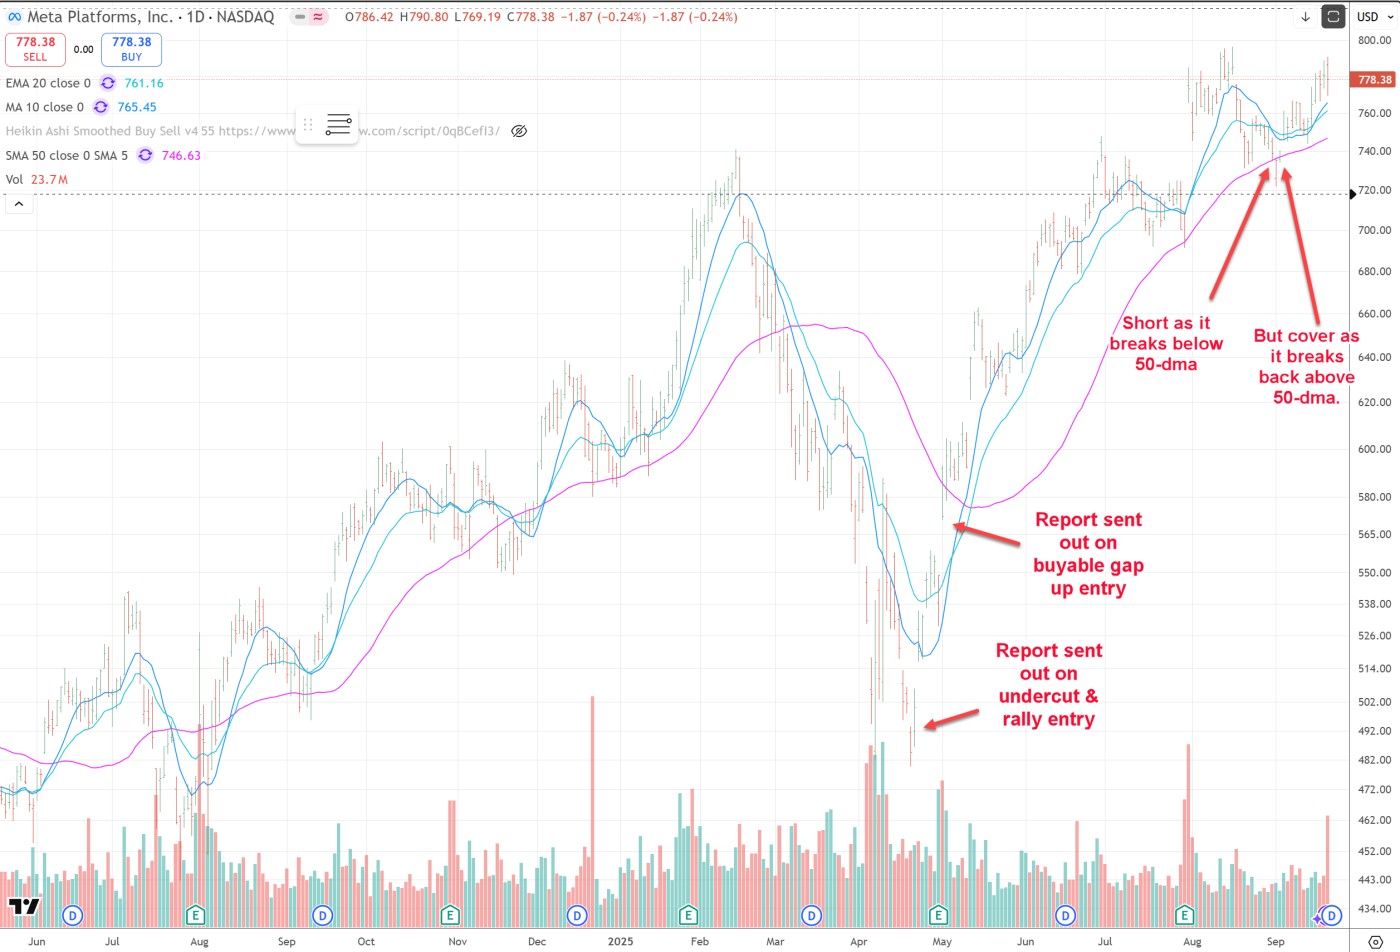
Meta Platforms (META) on February 28, 2023 at $174.72
Please enable javascript
Our buy signal was a play on the massive growth behind Web3/AI.
Marathon Digital Holdings (MARA) on Nov 9 and Dec 8, 2023
Please enable javascript
When GBTC breaks out, Bitcoin mining stocks correlate with GBTC and BTC. Stock tickers such as MARA and CLSK have top fundamentals and technicals. We have reported on various Bitcoin mining stocks at key entry points such as on Nov 9 and Dec 8, 2023.
Note: Pocket Pivots™ and Buyable Gap-Ups™ are not issued as recommendations to purchase
a stock, but as real-time reports alerting you to potentially actionable and factual technical action in a
leading stock. Examples shown here are intended to illustrate the advantage traders and investors can gain by
acting on these reports while also implementing proper risk-management and stop-loss techniques. As we like to
say, in the stock market the opportunity of a lifetime can come every few weeks. Catching one or two big
winners, and doing so early, can make your whole investment year, and our goal is to help you do just that.
MARKET TIMING
A material change was made to the model on Feb 9, 2019 which accounts for its improved performance. Details HERE.
NASDAQ Composite Market Direction Model Trading Return Jan 31, 2000 - Sep 25, 2023
+1,720%*
NASDAQ Composite Buy and Hold Return Jan 31, 2000 - Sep 25, 2023
+236%
Index
Market Direction Model Trading Return Jan 31, 2000 - Sep 25, 2023
Our timing strategies can materially boost your profits or protect from losses from identifiable market trends, whether up, down, or sideways. An ETF-based investment strategy simplifies the process. It puts you in a position to produce big profits during strong market trends. The model has outperformed the major averages over both bull and bear market cycles, though remains flexible to changing markets as the only constant when it comes to markets is change.
It focuses on minimizing losses during questionable periods which tend to chop and slop about while sticking to trends when they emerge. Price/volume action of major indices and leading stocks is key in determining buying and selling pressure.
The model is good at picking its spots as one can see from the performance graph. It is willing to hold for longer periods to avoid getting whipsawed to capture larger gains as the market can swing widely at times, but it is still sensitive to potential sharp drops in the market which is why it was handsomely profitable during crashes such as in 2008 and March 2020.
Our Crypto Report section provides guidance on various cryptocurrencies as well as vehicles such as GBTC (tracks bitcoin), ETHE (tracks ethereum).
Dr K's metrics have called every major top and bottom in bitcoin since 2011 (as of this writing January 10, 2024).
Since Jan-2013 when Dr K started trading bitcoin:
Date
Signal
Jan 8, 2013
Major buy sig
Apr 10, 2013
Major sell sig
Oct 14, 2013
Major buy sig
Dec 11, 2013
Major sell sig
Jan 15, 2015
Major buy sig
Jan 30, 2018*
Major sell sig*
Mar 24, 2019
Major buy sig
Jan 5, 2022*
Major sell sig*
Mar 12, 2023
Major buy sig
*While Dr K well outperformed Bitcoin by investing in stronger alternative cryptocurrencies in bull market years, Dr K was also up during the two devastating bear market years of 2018 and 2022 as his track record shows (blockchain audited and evident Dr K well outperformed based on going short cryptocurrencies). In 2018 and 2022, the average cryptofund lost -54% in 2018 according to Price Waterhouse Coopers (PwC) while in 2022, even conservative pension funds with limited exposure lost one-third or more of their value.
The bitcoin chart shows Dr K's crypto market timing signals. Please read the time-stamped archived reports to understand why the buy and sell signals came when they did: