
Dr. K's Crypto-Corner
by Dr. Chris Kacher
Riding the Revolutionary Rocket with Cryptotechnologies... Entirely Evolutionary™
The debate rages on. No, nothing to do with Roubini. We made calls to buy bitcoin on March 1, 2019 via the Grayscale bitcoin ETN GBTC when it was around $4.48 which was then followed by the March 24 report that gathered all the metrics I have used to call major tops and bottoms in bitcoin since 2011 and concluded a major bottom in bitcoin had indeed been set in December 2018.
But the latest debate is whether bitcoin must now stage a more substantial correction. Notwithstanding overly burdensome regulations that would certainly cause the cryptospace to temporarily stall, bitcoin has so far corrected -32.5% peak-to-trough which is in keeping with prior corrections during bull markets ranging from -28% to -42%. Therefore, it may continue higher from here without a need to further correct beyond -32.5% for reasons I’ve cited HERE.
Hopefully the US will not be as heavy handed as China with respect to crypto regulations. Some have suggested that if the government cannot control bitcoin because it is decentralized, they could try other measures like regulate every service provider connected to the ecosystem. But mesh networks which are an early stage tech and decentralized override service providers.
Two of the members of the SEC are pro crypto. Now that the top guns in the US have made public statements on crypto, that will force the mass majority to start thinking about it. Mnuchin has underscored how existing regulations must be applied to the cryptospace which will ultimately help the space mature and institutions jump on board en masse.
Bitcoin currently only has a 1% adoption rate. It doubles every year so it's taken a decade to reach 1%. It should take less than a decade to reach a majority especially given the state of QE, historically low interest rates, the global debt spiral, and potential fiat devaluations.
Bitcoin has been tested now for 10 years from security threats, to government bans, to forks, to agendas from miners, and it has remained resilient, always defying expectations that its time is done. Resilience spurs anti-fragility. It continues to benefit from the Lindy Effect. A cryptocurrency that challenges it would have to have its network effect and as we saw with TCP/IP, no challenging technologies even though superior could even get close to its network effect so TCP/IP remained the backbone of the internet.
The principles behind bitcoin are pure, focused on a public good, rather than any particular agenda. Given its fixed supply, it is deflationary thus can continue to rise in value. This would have a second order benefit of incentivizing savings over spending since goods bought today would cost less in bitcoin over time, but the appreciation of bitcoin over the long run may make some think twice about spending on luxury items. The psychological consequences are fascinating.
The Bitcoin Bulls
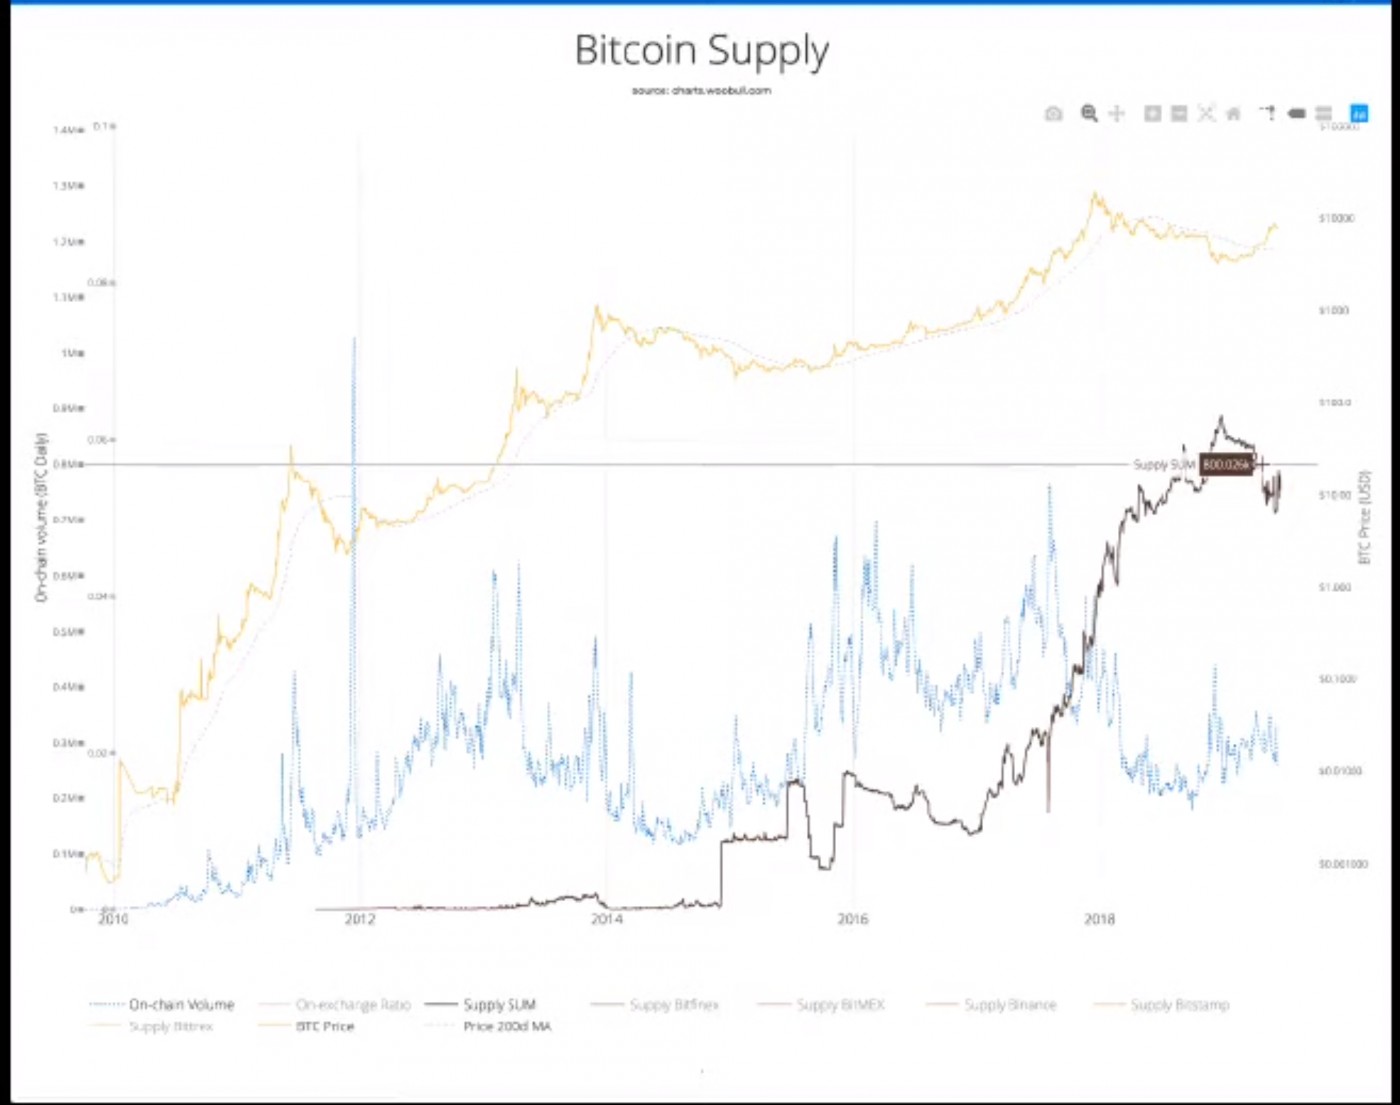
=The Y-axis in the Bitcoin Supply chart below is the number of bitcoins on-chain (peaked at 880,000, currently at 780,000) as shown by the black line below which is the total supply of bitcoin on the primary exchanges (Binance, Bitstamp, Bitfinex, Bitmex, Bittrex tracked by Coinmetrix) being measured. This excludes the Chinese exchanges which have been shown to grossly distort volumes, often by as much as 50-fold, thus accounts for why up to 95% of the total reported trading volume is false. There are currently 18.5 mil BTC of which 14.5 mil BTC are active (4 mil are gone/lost), so 6% of BTC that are alive are sitting on major exchanges. On March 10, 2017, the SEC rejected the first attempt by the Winklevoss twins to launch a bitcoin ETF. This was the first time mainstream news media gave some credibility to bitcoin instead of simply calling it a tool used by criminals. As a consequence, the black line was pushed sharply higher and continues to rise since then as bitcoin acceptance continues to rise.
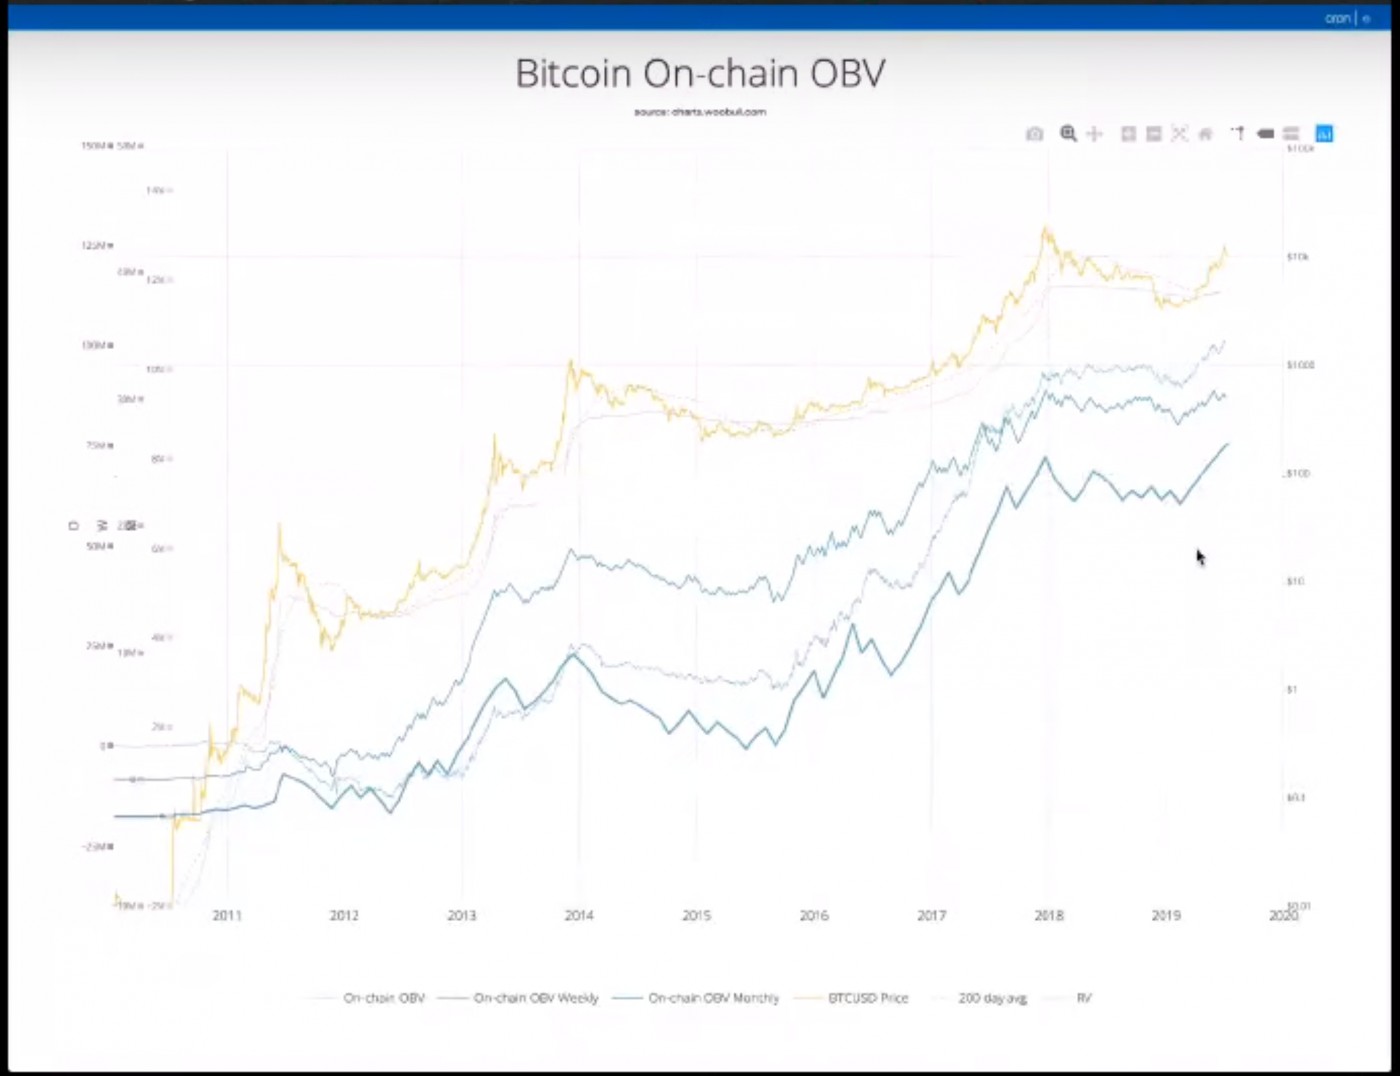
=The chart below shows the price of BTC at the top in gold while the three lines below it represent bitcoin on-chain volume on daily, weekly, and monthly time frames. Notice how in prior cycles when bitcoin price drops, all three drop as well. In the last bear market, on-chain volume went more or less sideways then quickly reached new highs. This suggests smart money has been accumulating bitcoin. Indeed, record numbers are holding onto their bitcoin as evidenced by UTXO metrics. This underscores the Bitcoin Supply chart shown above. It also suggests the period of accumulation in the current bull market may be steeper but shorter lived than the uptrending but slower, somewhat sideways moves of BTC between 2015-2016. Thus, it now makes sense why BTC blew past its mid-6000 resistance levels in May compared to the prior cycle.
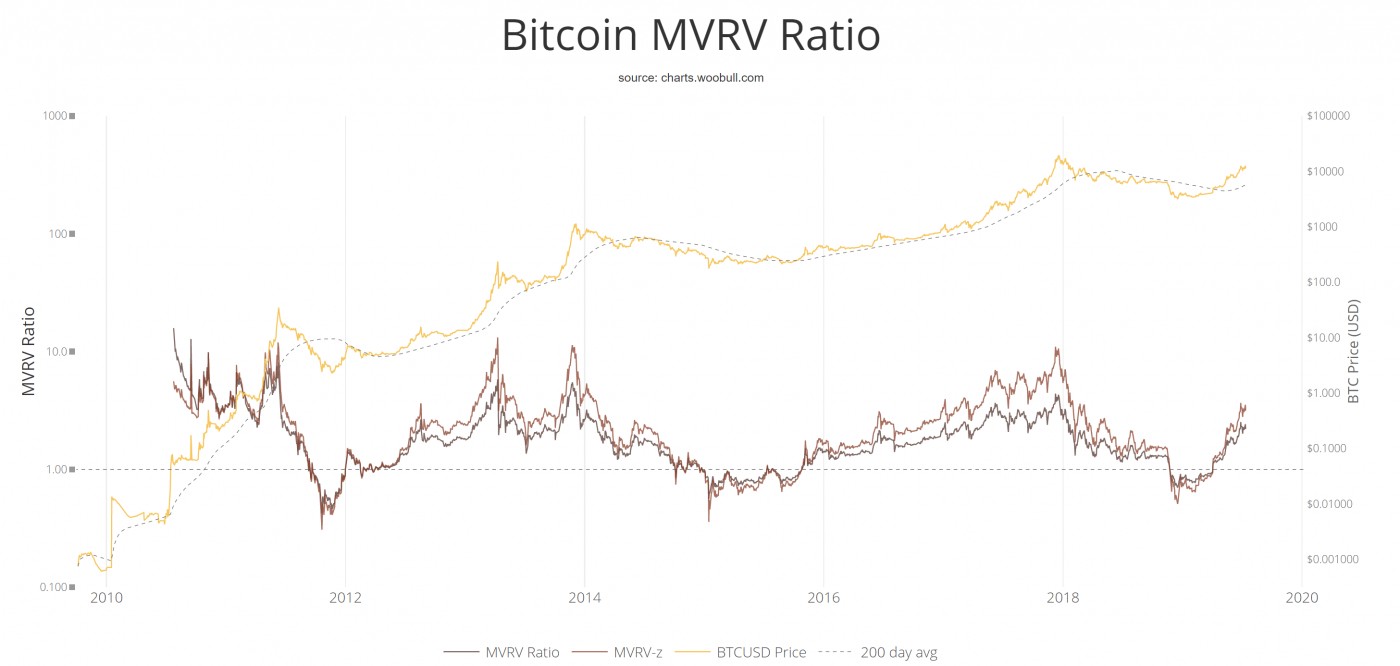
=The bitcoin MVRV Ratio shown below is the market value to realized value of bitcoin. MVRV-z is the standard deviation between market value and realized value which more clearly shows the tops and bottoms in bitcoin. Realized value approximates the value paid for all coins in existence by summing the market value of coins at the time they last moved on the blockchain. When the ratio is at a peak or a trough, this has coincided with market tops or bottoms in bitcoin. It currently suggests bitcoin can trend higher from current levels.
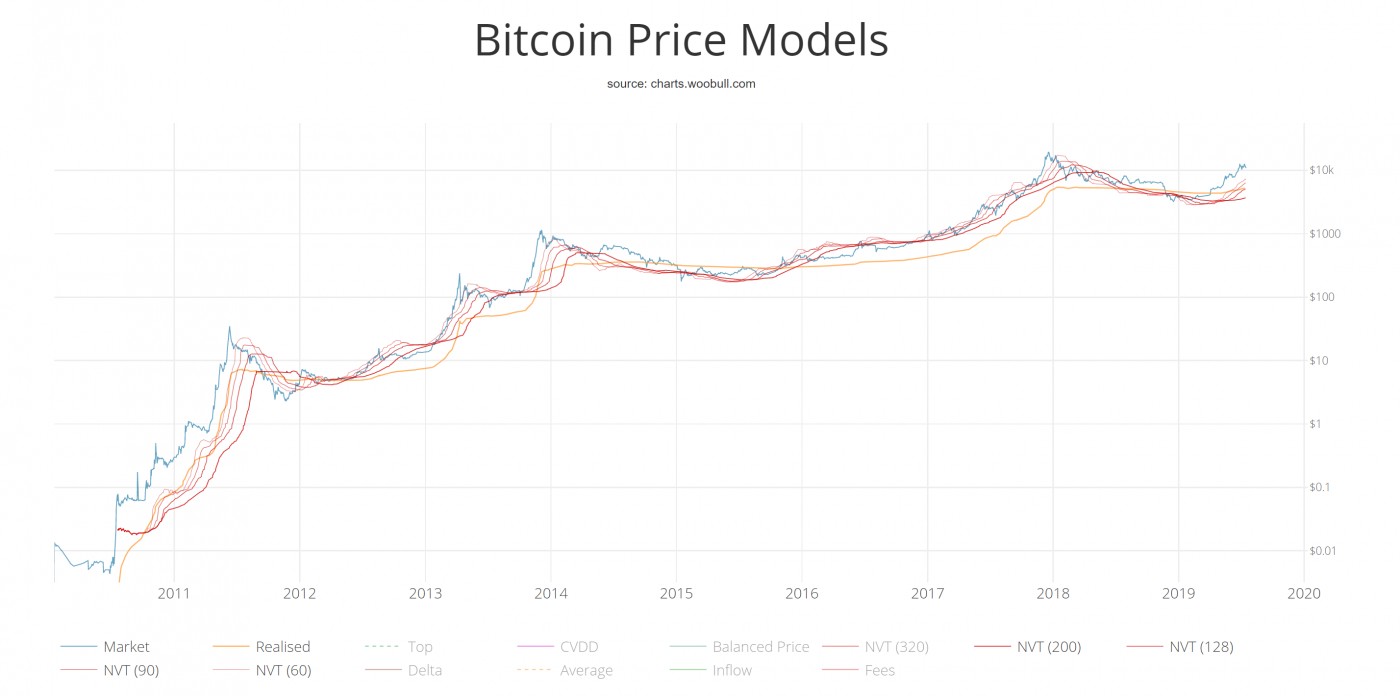
The NVT waves shown below of varying lengths illustrate the power behind each cycle. From 2010-2011, the waves were below the price of BTC. Yet the market had such power that price remained above these waves for the entire bull cycle. These waves repeated this illustration of powerful accumulation in late 2013 when price moved first then the waves started to rise. This action is being repeated in the current cycle perhaps because the number of transactions has dropped due to increasing hold times as shown by UTXO and increasing levels of accumulation. Increasing off-chain volume can also exaggerate NVT and NVTS since neither model accounts for off-chain volume. The more volume transacted off-chain, the less volume on-chain, thus the higher and artificially inflated the values of NVT and NVTS.
The Bitcoin Bears
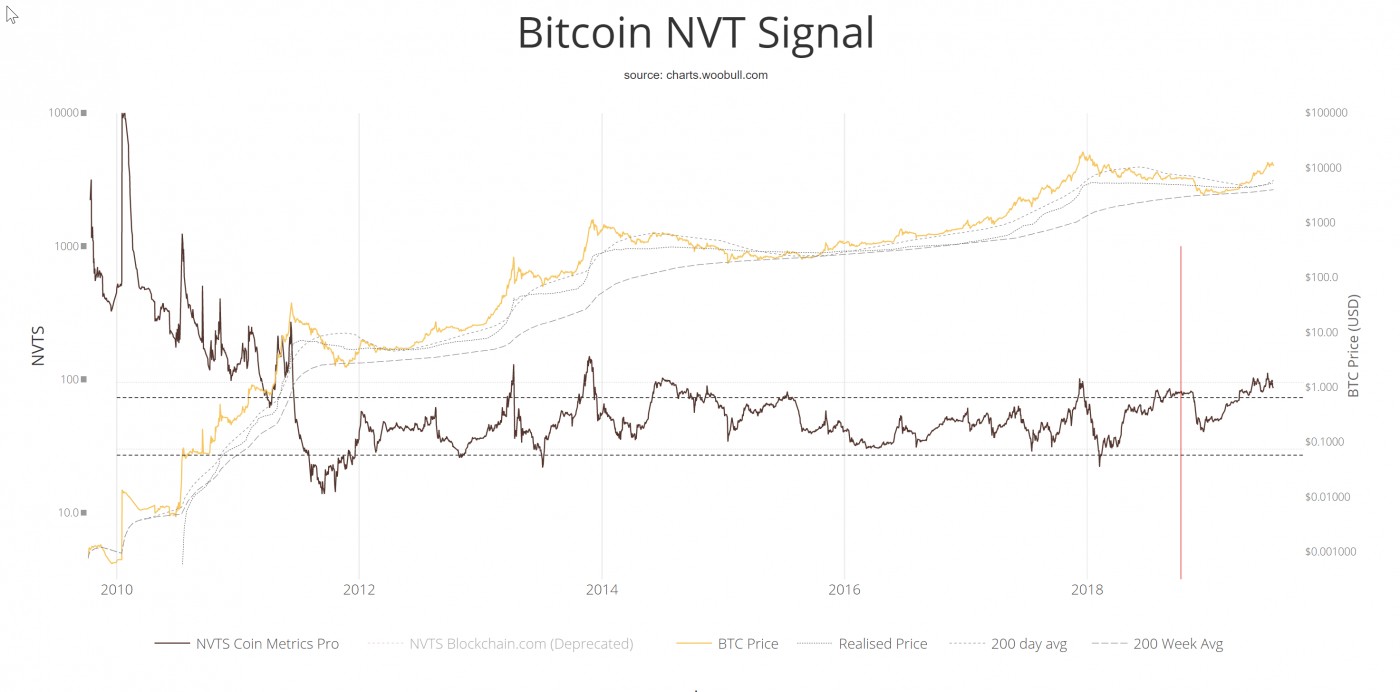
The improvement in sentiment, hold times, and accumulation of bitcoin has rendered indicators such as Network Value to Transactions (NVT) ratio less useful though NVT is still good for getting the 50k ft view macro structure while Network Value to Transactions Signal (NVTS) had to be retooled.
Even retooled, NVTS shown below is still showing BTC at overbought which leads some to suggest BTC needs to pullback further than -32.5%, down to a logical support level such as 8000 where there were peak funding rates. Such areas are targets for whales who often step in and buy. In other situations where it is on record via major exchanges such as Bitmex that a large number of short sellers have taken positions around a certain range of prices, whales will often buy to force short sellers to cover which further drives up the price.
Indeed, part of the bitcoin rally we have seen this year was due to short covering. This, however, does not invalidate the other major tailwinds at hand which have also contributed to the sharp rise in price in bitcoin this year.
Conclusion
The question is whether the NVTS chart above is substantial enough against all the other metrics to require BTC to correct further. BTC currently sits at around 10,400. NVTS has already been adjusted to account for on- and off-chain volume changes. That said, I wrote in an earlier piece in March where I concluded bitcoin had reached a major low in December even though NVTS (in its earlier form) showed bitcoin overbought. I had concluded that market sentiment had improved sufficiently such that what was overbought before was now the new norm. Perhaps the same still applies to the new version of NVTS? The only constant when it comes to markets is change. UTXO hold times, on-chain volume accumulation, and MVRV all suggest a faster but shorter rise in price in this bull cycle is possible. Thus BTC may not have to undercut prior recent lows before continuing its uptrend. Of course, the situation remains fluid.
Price/volume and chart structures are key to staying in step with the ever-evolving crypto markets. One should never wed themselves to either the bull side or the bear side but to the right side. This means staying in step each day with new data that emerges. In other words, there is no get rich quick scheme or black box model or substitute for working smart and staying in focus.
(͡:B ͜ʖ ͡:B)