
Dr. K's Crypto-Corner
by Dr. Chris Kacher
Riding the Revolutionary Rocket with Cryptotechnologies... Entirely Evolutionary™
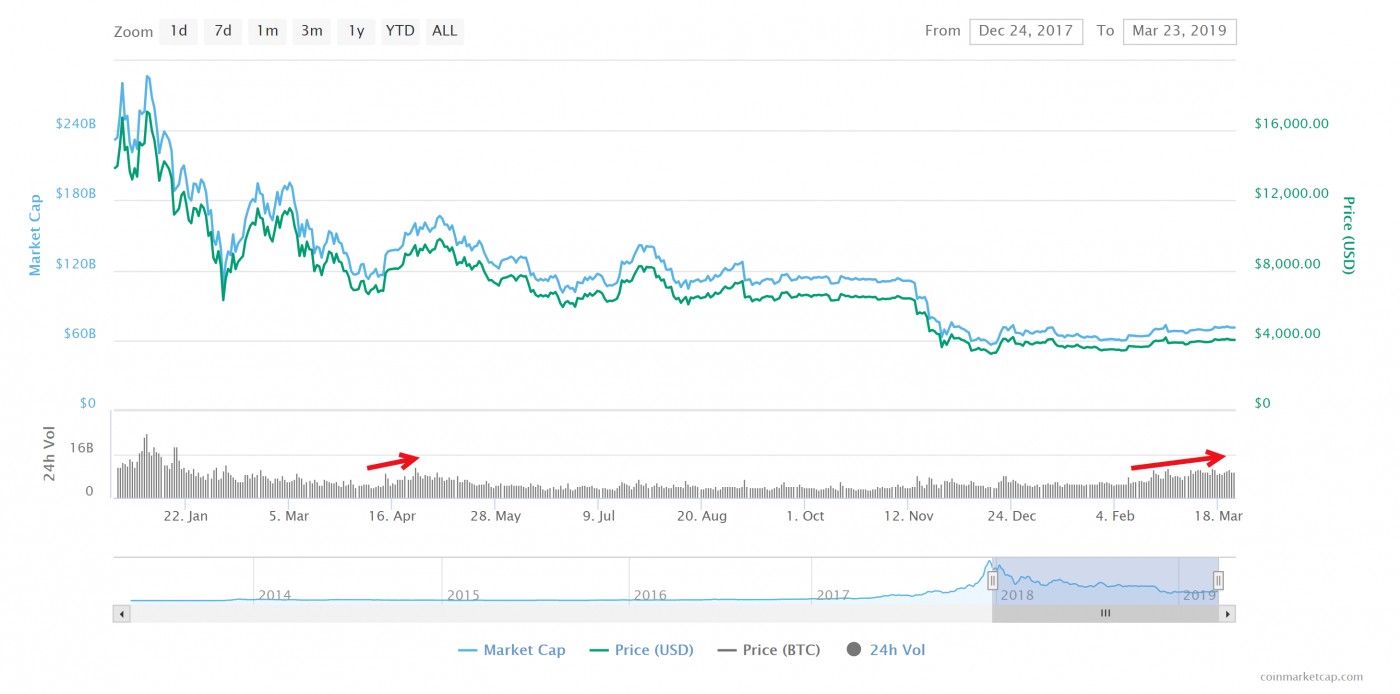
TLDR: It appears increasingly likely that bitcoin has bottomed. This is due to a shift in fundamental perception in bitcoin that has grown since 2017. This means metrics that used to show bitcoin being overvalued no longer suggest this.
Dr. K's Crypto Picks
The fact that the best coins I have noted in prior Crypto Reports have done well have spurred some to ask whether bitcoin already bottomed. Recent examples:
| Coin | Date When Reported | Price When Reported ($) | Current Price 3-24-19 | % Gain/ Loss |
| Ravencoin (RVN) | 3/19/2019 | 0.036 | 0.056 | 55.68% |
| Binance (BNB) | 3/1/2019 | 11.520 | 16.640 | 44.44% |
| Maker (MKR) | 3/1/2019 | 685.000 | 733.640 | 7.10% |
| Enjin (ENJ) | 3/1/2019 | 0.079 | 0.178 | 125.32% |
| Theta (THETA) | 3/1/2019 | 0.148 | 0.118 | -20.47% |
| Bitcoin (BTC) | Various over the years | Bearish calls since January 30, 2018 | ||
| I was up in 2018 vs median crypto hedge fund -46% (PwC) | ||||
Trading Strategy
Given how much some of these coins have risen since I shared them with members, one trading strategy would be to reverse any buys should bitcoin start to appreciably fall in context with its chart, similar to how bitcoin started to fall in late 2018, AND your coin also takes a hit. Naturally, should your coin hold up well, this is a sign of strength so you may want to try to hold it.
In the meantime, should bitcoin continue to trade in a fairly tight price band as it has been doing for a number of weeks, any new coins I mention in future reports could be bought, keeping stops in line with your personal risk tolerance levels.
Major Bottom In Place?
Markets and situations change as change is the only constant when it comes to markets. This is especially true of bitcoin. In prior pieces, conditions showed bitcoin was overvalued. That said, other major factors discussed below may override this overvalued condition thus allow bitcoin to become even more overvalued, ie, a new norm is now in place with a material shift having potentially occurred gradually since late 2017, thus making bitcoin no longer overvalued. When bitcoin hit a low of $3122 on December 15, 2018, odds have increased that this was the major bottom for bitcoin.
That said, the possibility still exists that bitcoin may have to at least retest lows of $3122 before a major bottom is in place. The situation remains fluid as always, and not as cut-and-dry as in prior major bottoms as more institutions are trading bitcoin now than ever before. There are some 350 crypto hedge funds and 372 crypto VC funds in existence and growing. This implies the use of algos and other vehicles which can distort the charts. But such vehicles typically only affect the price of bitcoin over the short term.
BULLISH CASES
Here are factors that serve as bullish tailwinds that suggest bitcoin already bottomed:
Bitcoin Adoption
Bitcoin adoption (user base) doubles every 12 months. Bitcoin adoption is currently at roughly 1% of the world's population. Therefore, it took 10 years to get to 1% adoption (2009-2018). Over the next 10 years, bitcoin's user base will rise from the current 1% to 50% as the S-curve wave adoption approaches based on its adoption rate doubling every 12 months.
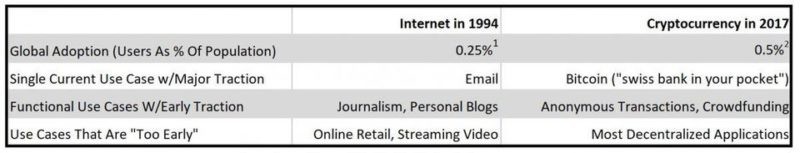
Though this doubling may start to take longer over time, there are 1.7 billion that remain unbanked and another 2 billion that are partially banked who will leapfrog traditional banking to become banked via peer-to-peer methods such as the use of decentralized, secure, and private blockchain-based bitcoin. This can help push bitcoin valuations higher, creating a new norm. Markets are forward looking. Remember when Amazon stock had nothing but negative earnings for years starting in the late 1990s yet Amazon stock continue to rip higher? Markets knew. Markets are the sum total of the collective mindset. None of us is as smart as all of us.
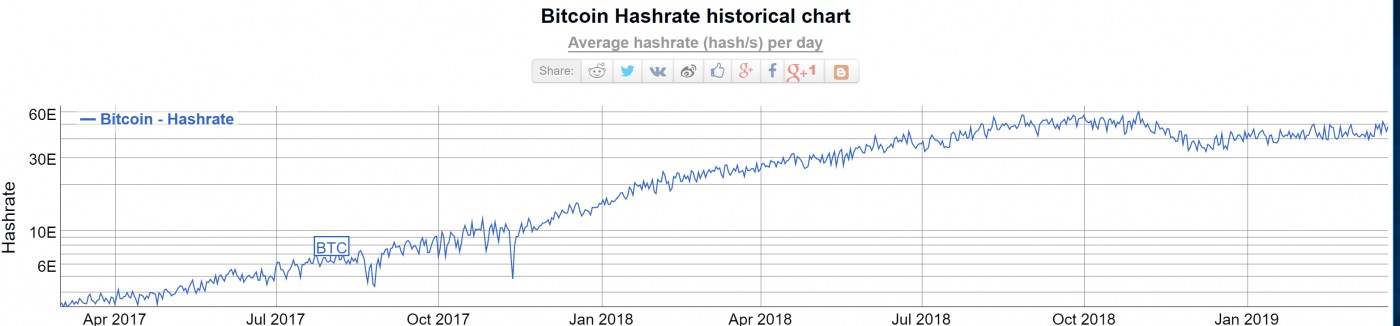
Bitcoin Hashrate
Bitcoin's hashrate is bouncing back though still off all-time highs. It may achieve all-time highs later in 2019.
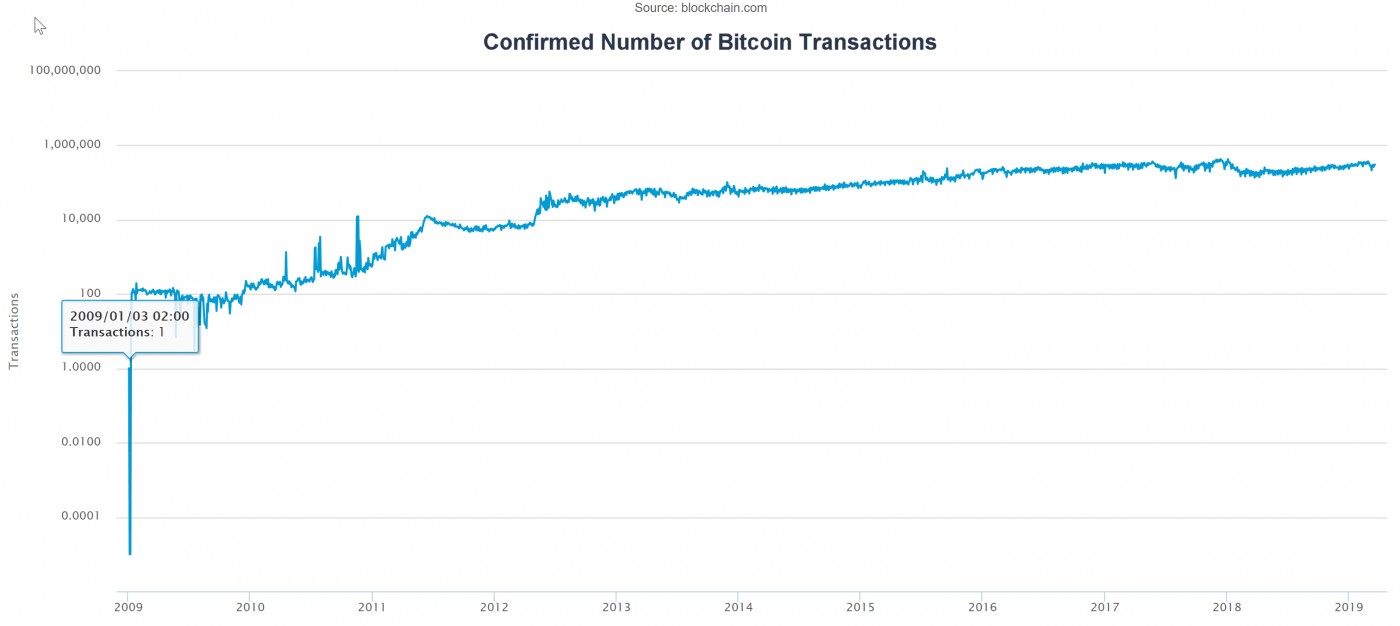
Confirmed Bitcoin Transactions
Number of confirmed bitcoin transactions and outputs are near all-time highs though much of this is due to Veriblock transactions which some think is spam, going from 6.5m in Sep. 2018 to 14m outputs Feb. 2019, representing 25% of total transactions.
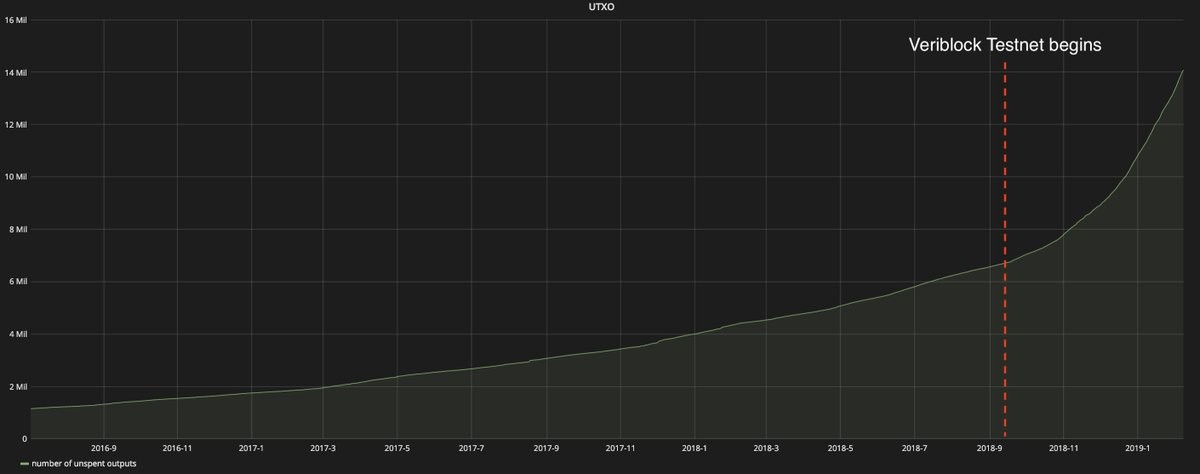
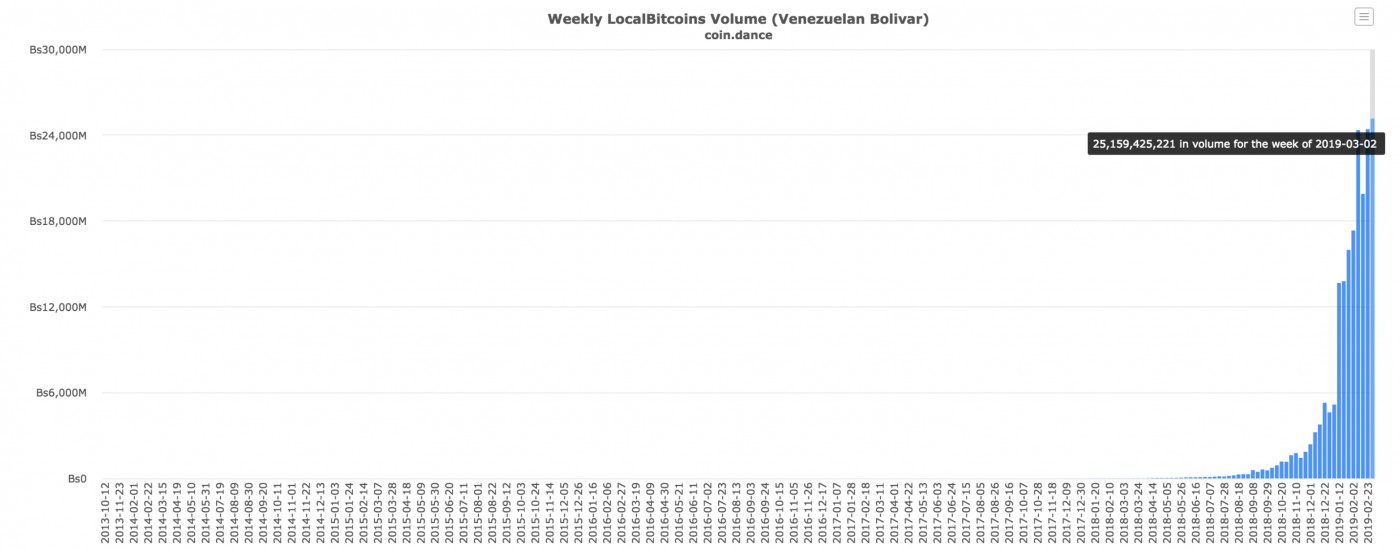
Part of the increase, however, is probably due in part to a growing number of individuals in second and third world countries using bitcoin wallets to transact value. Coins.ph is a great example of how already one in ten people in the Philippines use bitcoin to transact value while aiming to attract 650 million of Southeast Asia’s unbanked via their crypto wallet. Further, as deep struggles continue in Venezuela, the number of Venezuelans using bitcoin to transact value is at an all-time high as show below. Millions of families in Venezuela now use bitcoin to transact value.
Nevertheless, the ratio of network value to the dollar value of bitcoin transactions has demonstrated better predictive value (see NVT Signal chart later in this piece- the question is whether NVT Signal is being manipulated). Also note how the number of total transactions was hitting new highs in the latter part of 2014, months before bitcoin took another price plunge in January 2015.
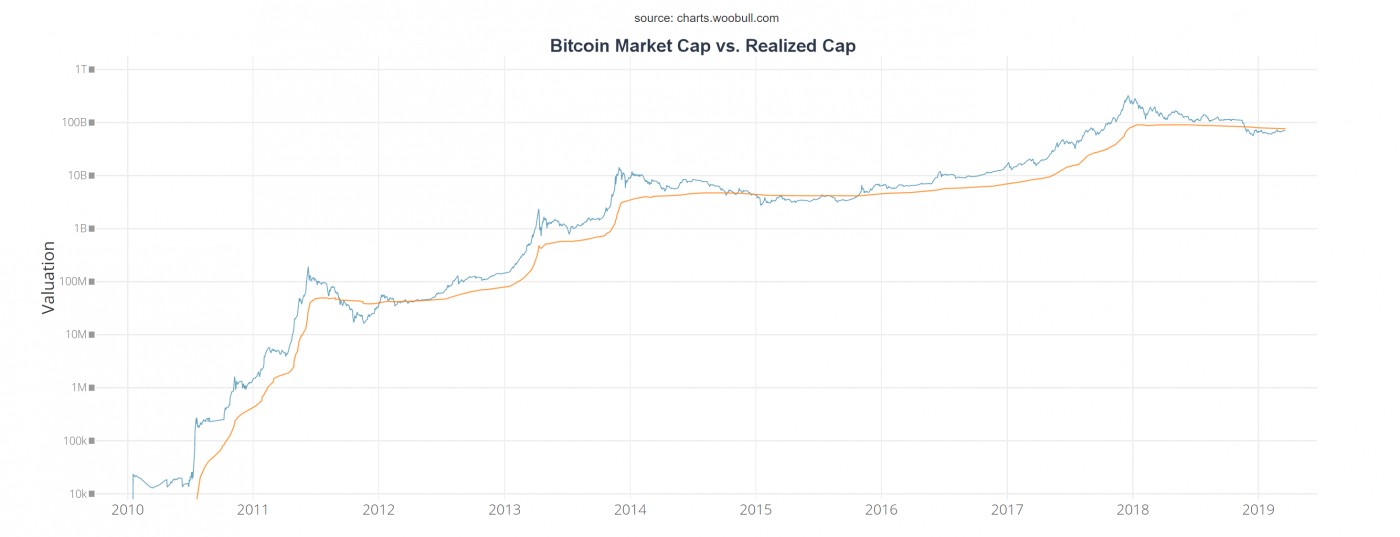
Bitcoin MVRV Ratio (market value to realized value)
The lower it goes, the more bitcoin is undervalued. It did drop late in 2018 suggesting a major low for bitcoin as shown in the chart below:
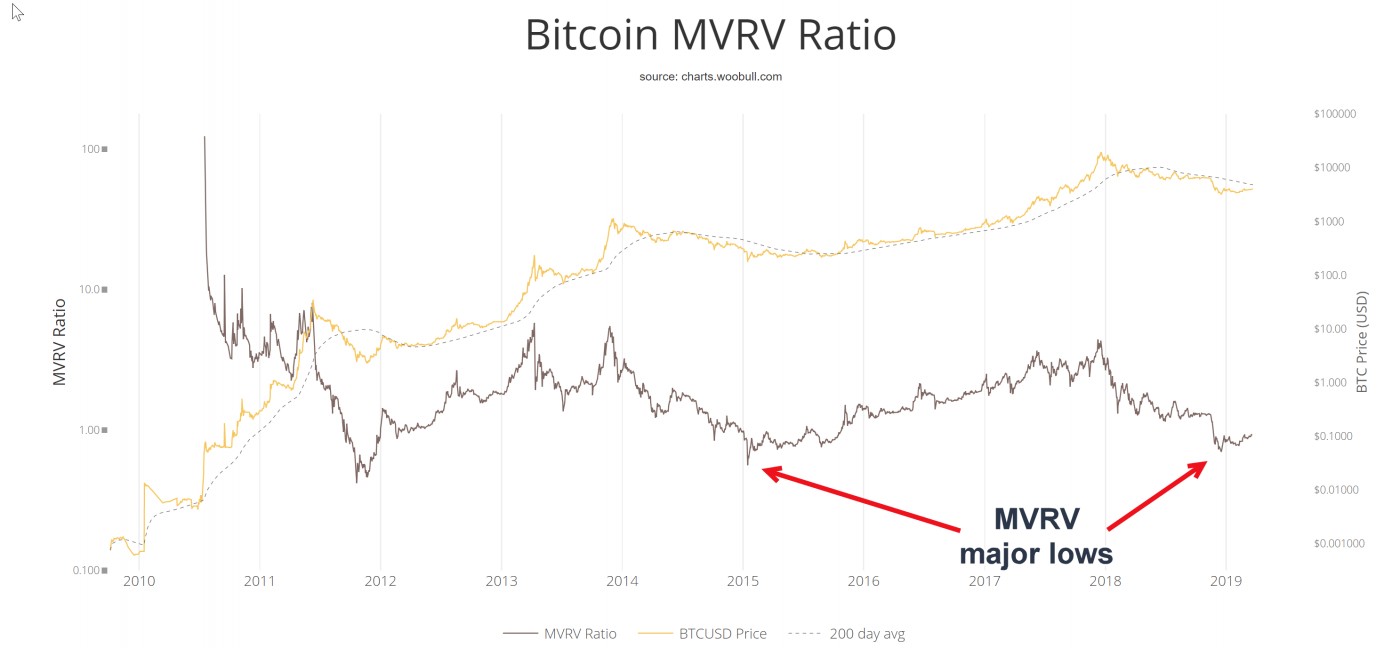
But the NVT Signal chart shown later in this piece showed bitcoin, while no longer overvalued, was not neutrally valued let alone undervalued. This was in contrast to prior major lows in bitcoin when NVT Signal had signaled major lows. Still, if a new norm is in place, NVT Signal may not have had to fall as far to signal a major bottom when bitcoin hit major lows in Dec-2018.
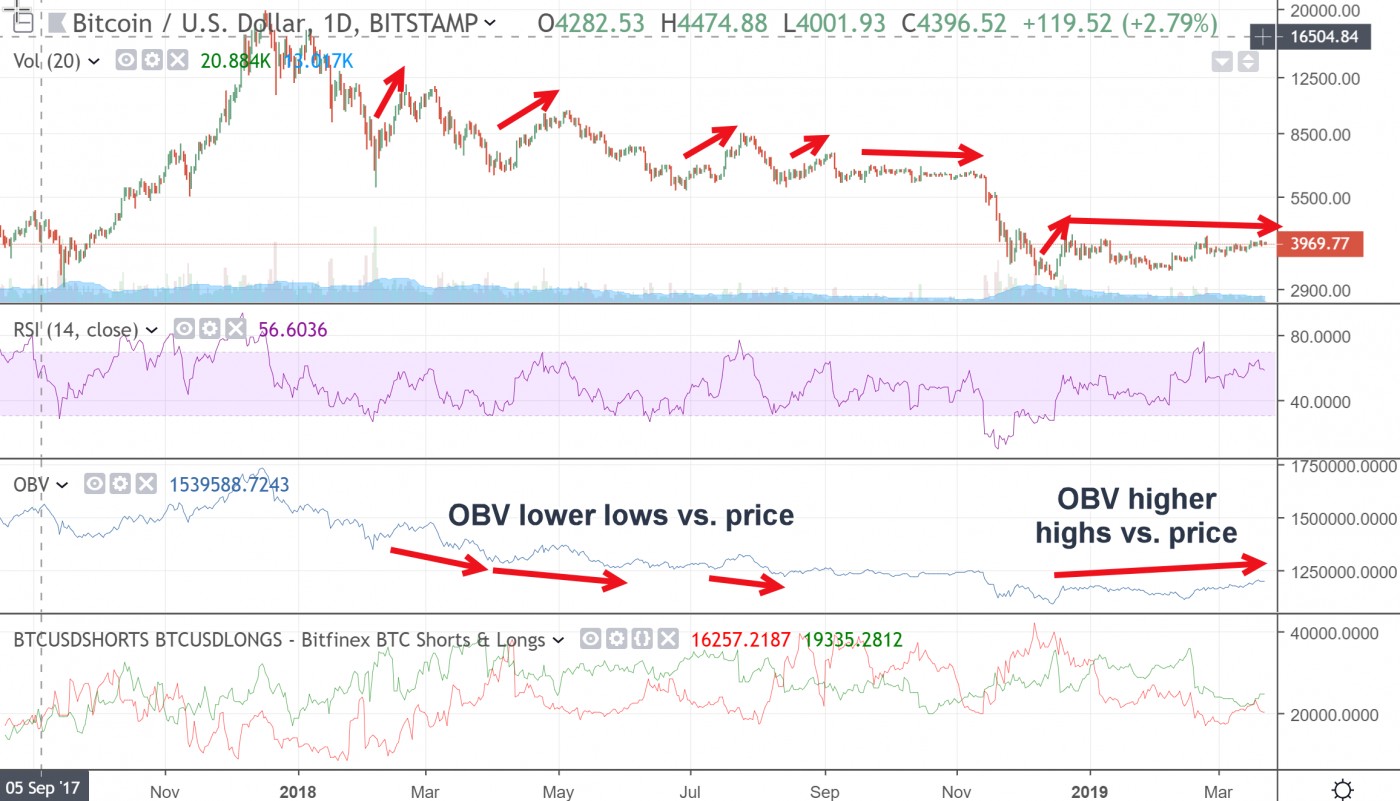
OBV (on balance volume)
OBV has been running ahead of price since February 19, 2019. This is the first time this has happened since bitcoin topped in December 2017. This is an important change.
Caveat: Note how RSI shown below is a bit elevated. It would not be surprising to see bitcoin fall as RSI normalizes, but bitcoin would most likely continue to trade in a sideways range at worst, maybe dropping a few hundred dollars, but not having to retest lows of $3122. See 2015 for comparison. Once RSI falls to undervalued, that could be a trigger for bitcoin to launch higher, breaking out of its sideways pattern, as it did in Sept-2015.
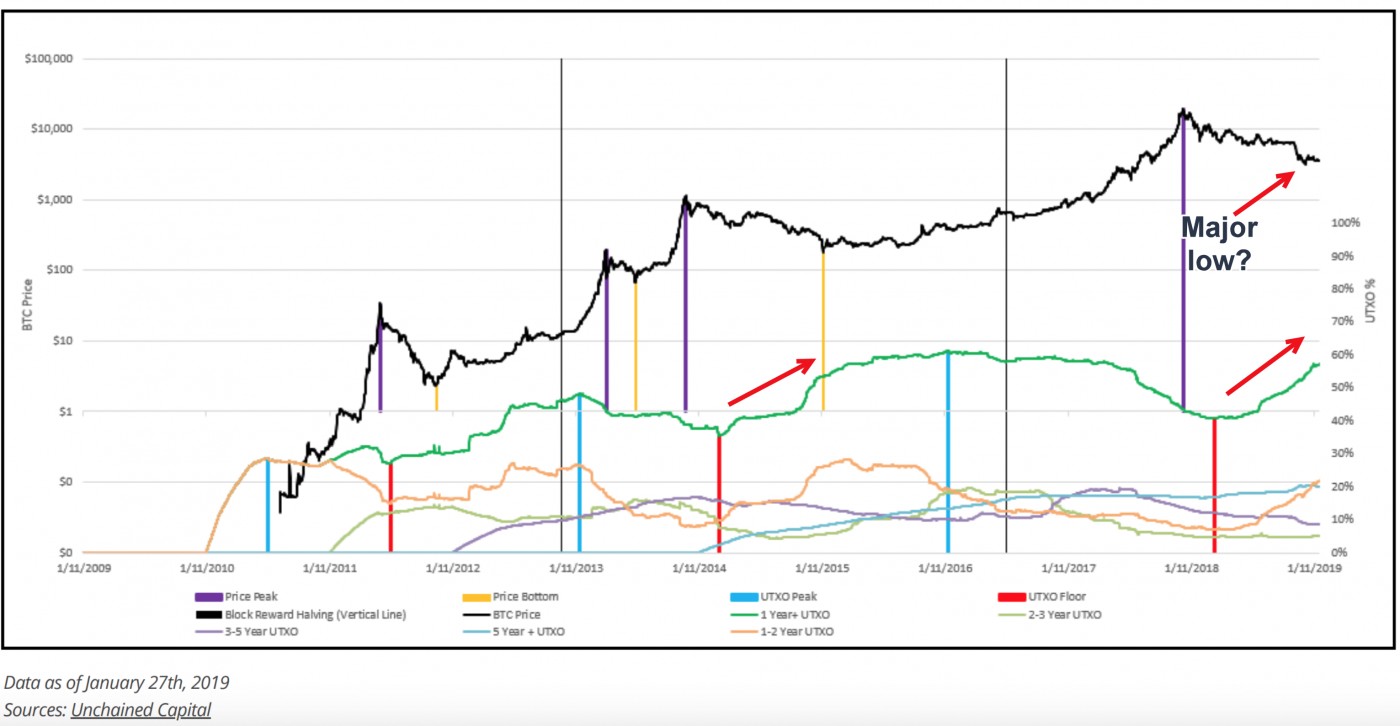
UTXO
UTXO has been on the rise for a number of months. Based on the prior low in Jan-2015, bitcoin could have already reached a major low of $3122 on December 15, 2018.
A low number of 1+ year UTXO’s means that a lot of Bitcoin has been moving within the last 12 months. When this happens, there aren’t many addresses that have been holding for 12+ months. If you look towards the end of the first quarter 2018 you can see we made a low in UTXO’s just like we did near the beginning of 2014/2015 bear market. But current UTXO levels suggest the number of HODLers has appreciably increased, thus bitcoin may have already bottomed just as it did in early 2015.
Future Bullish:
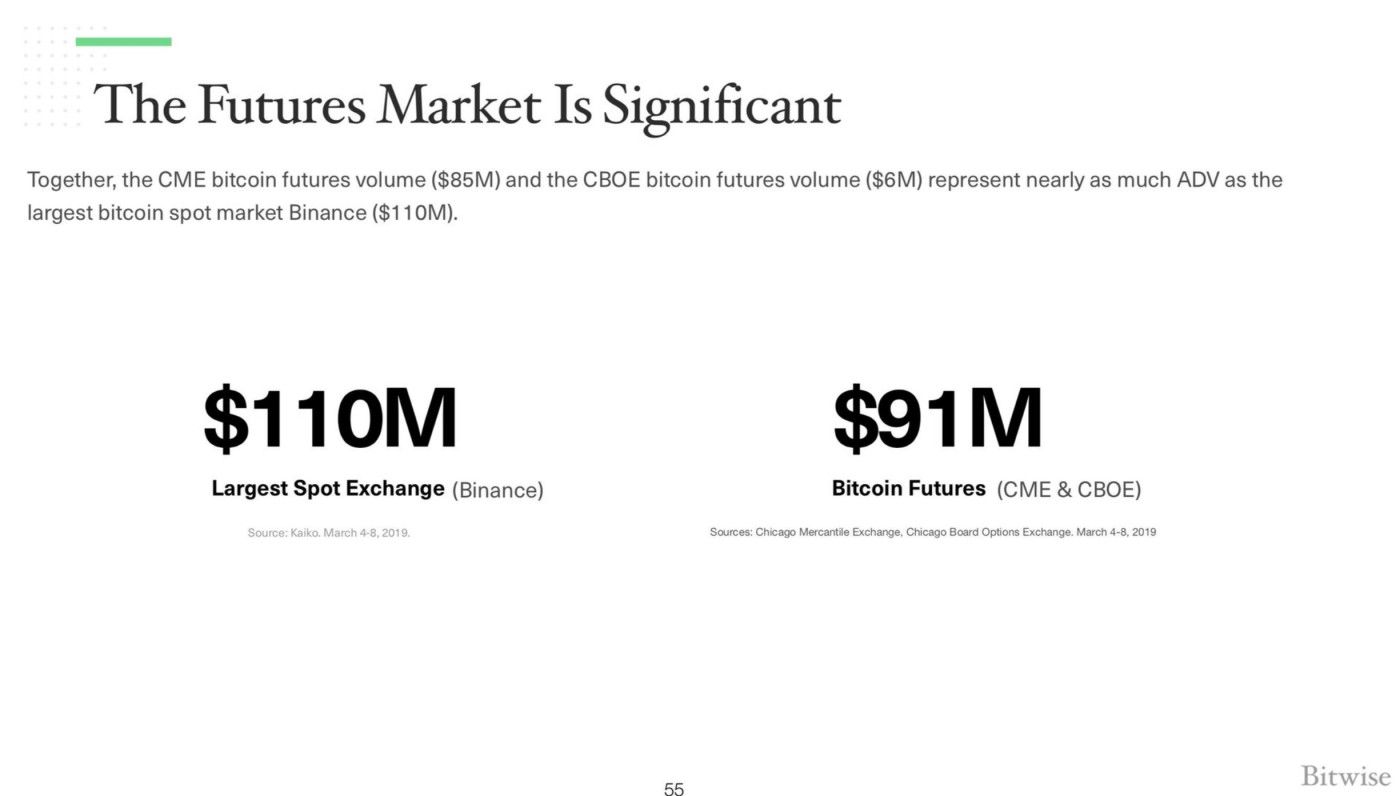
1) SEC approves bitcoin ETF. It took leveraged ETFs 6 years for SEC approval. It took actively managed ETFs nearly 6 years as well. The 5+ years for the SEC to approve a bitcoin ETF is nothing unusual. As shown below, when you remove fake volume, CME futures volume is significant ($85M), especially compared to the real bitcoin exchange traded spot volume (35% for Feb 2019). This is good news because it means CME— a regulated, surveilled market— is of material size, which is important for an ETF. It increases the odds of an SEC-approved bitcoin ETF. Such an ETF could spark a wave of liquidity into bitcoin much as the gold ETF GLD which was launched in 2003 sparked a wave of buying in gold that persisted for a number of years.
2) Institutions continue to onboard blockchain technologies and bitcoin/crypto trading platforms. CME, ICE, and NASDAQ are already in motion. Amendments to existing regulations as well as any new regulations passed into law will enable institutions to implement blockchain technology.
3) Bitcoin's longer cycles suggest a normal rebound back to new highs once a major bottom has been reached: https://www.virtueofselfishinvesting.com/reports/view/crypto-report-why-bitcoin-will-eventually-reach-new-highs-once-again-nasdaq-stock-docu
4) In the chart below, the orange line is the average price paid for bitcoin. When the market cap moves below this average price, a major bottom has been reached within months. Should the market cap of bitcoin rise above this orange line, this would suggest bitcoin has already reached a major bottom. Keep in mind, even if bitcoin breaks above the orange line shown below, bitcoin could trade more or less sideways for many months as it did after it bottomed in January 2015.
BEARISH CASES
Here are factors that serve as bearish headwinds that suggest bitcoin still may have to
at least retest lows around $3122 (though each case fails if a new norm has been achieved):
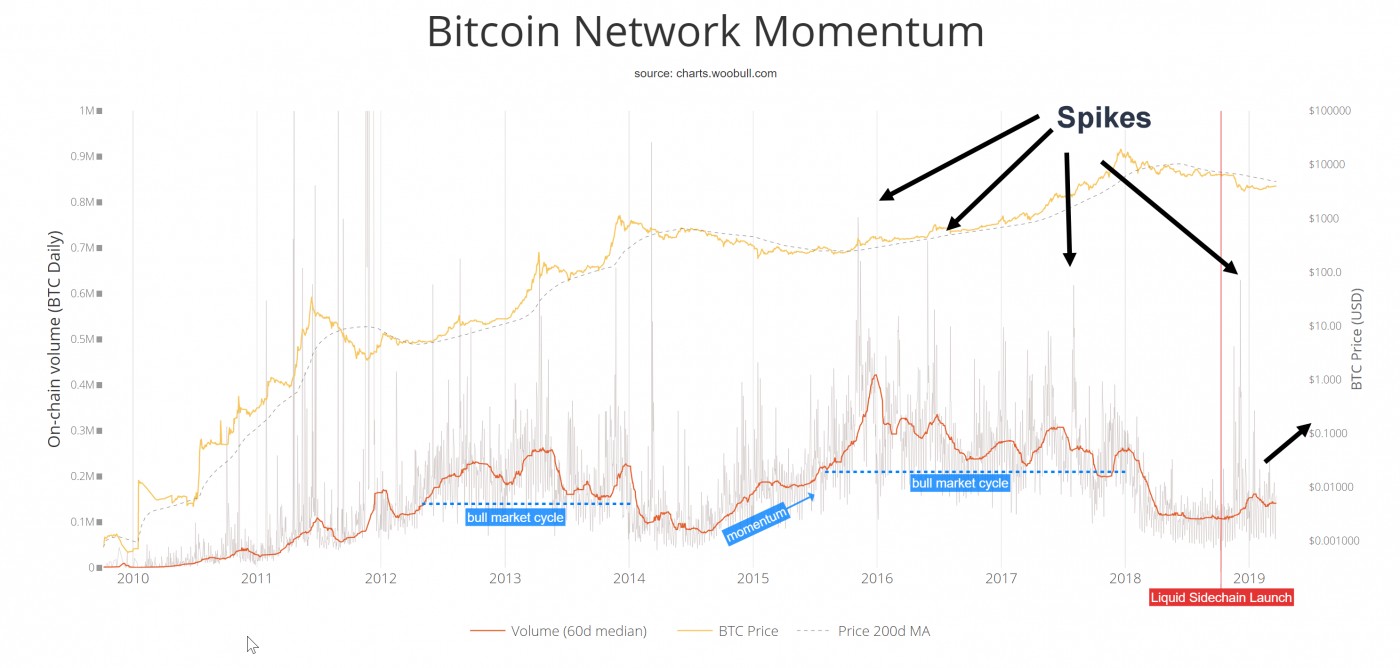
Bitcoin Network Momentum
The chart below shows on-chain volume for bitcoin. It shows on-chain transaction volume in BTC. It suggests this volume must first increase before a major low in bitcoin is reached. This value increases during bitcoin bull markets and when bitcoin suddenly plummets during bear markets. On-chain volume is bitcoin moving between wallets. On-chain volume is twice that of real bitcoin trading volume (spot volume) on exchanges. Note that 95% of bitcoin trading volume has been shown to be fake (see slide 4/). Binance dominates the market with $110 million real avg daily trading volume. Here's how to tell real from fake reporting of trading volumes (see slides 6/ through 10/).
Some have suggested the recent bitcoin network momentum at the start of 2019 was one of the largest institutional on-chain volume accumulation in bitcoin's price history right after bitcoin fell to $3122. But the chart below shows such spikes are not that uncommon. The chart also suggests momentum will have to rise a bit further before a major bottom is in place. But if on-chain volume is lower than before due to an increased number of HODLers as suggested by the 1+ year UTXO green line in the UTXO chart above, then bitcoin could already have bottomed despite bitcoin network momentum at current levels.
Estimated On-Chain Transaction Volume
The chart below is the same as the one above, but using different terminology.
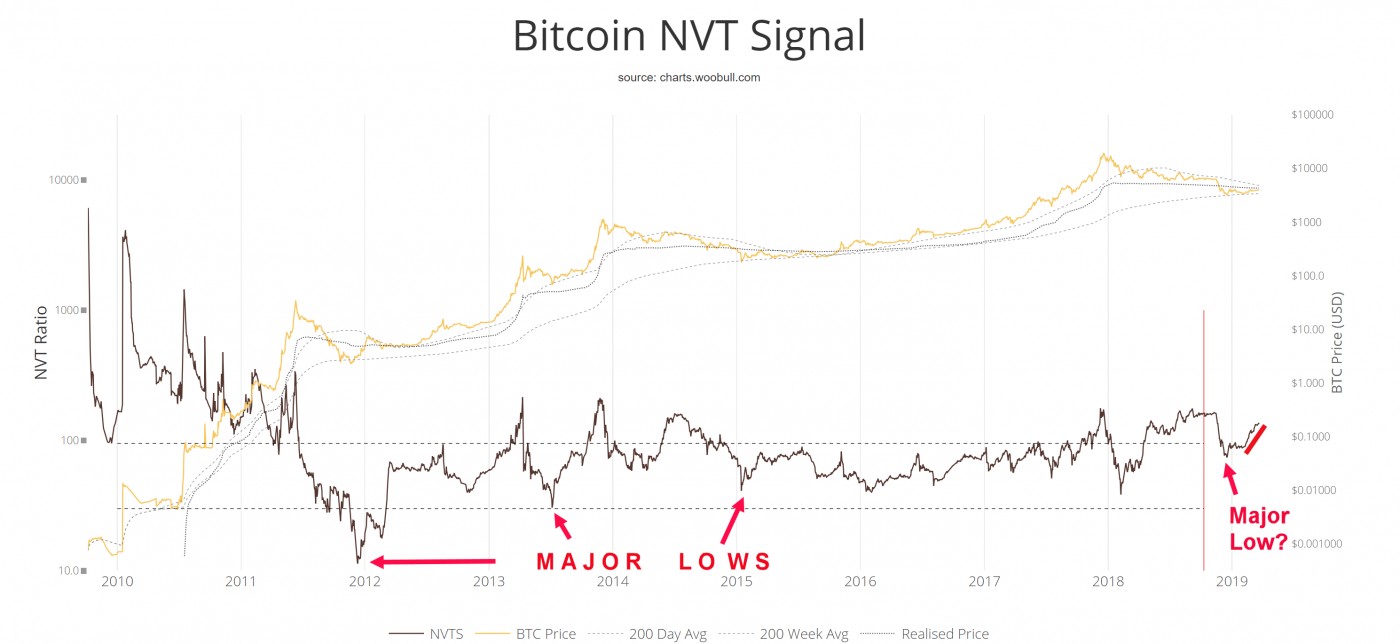
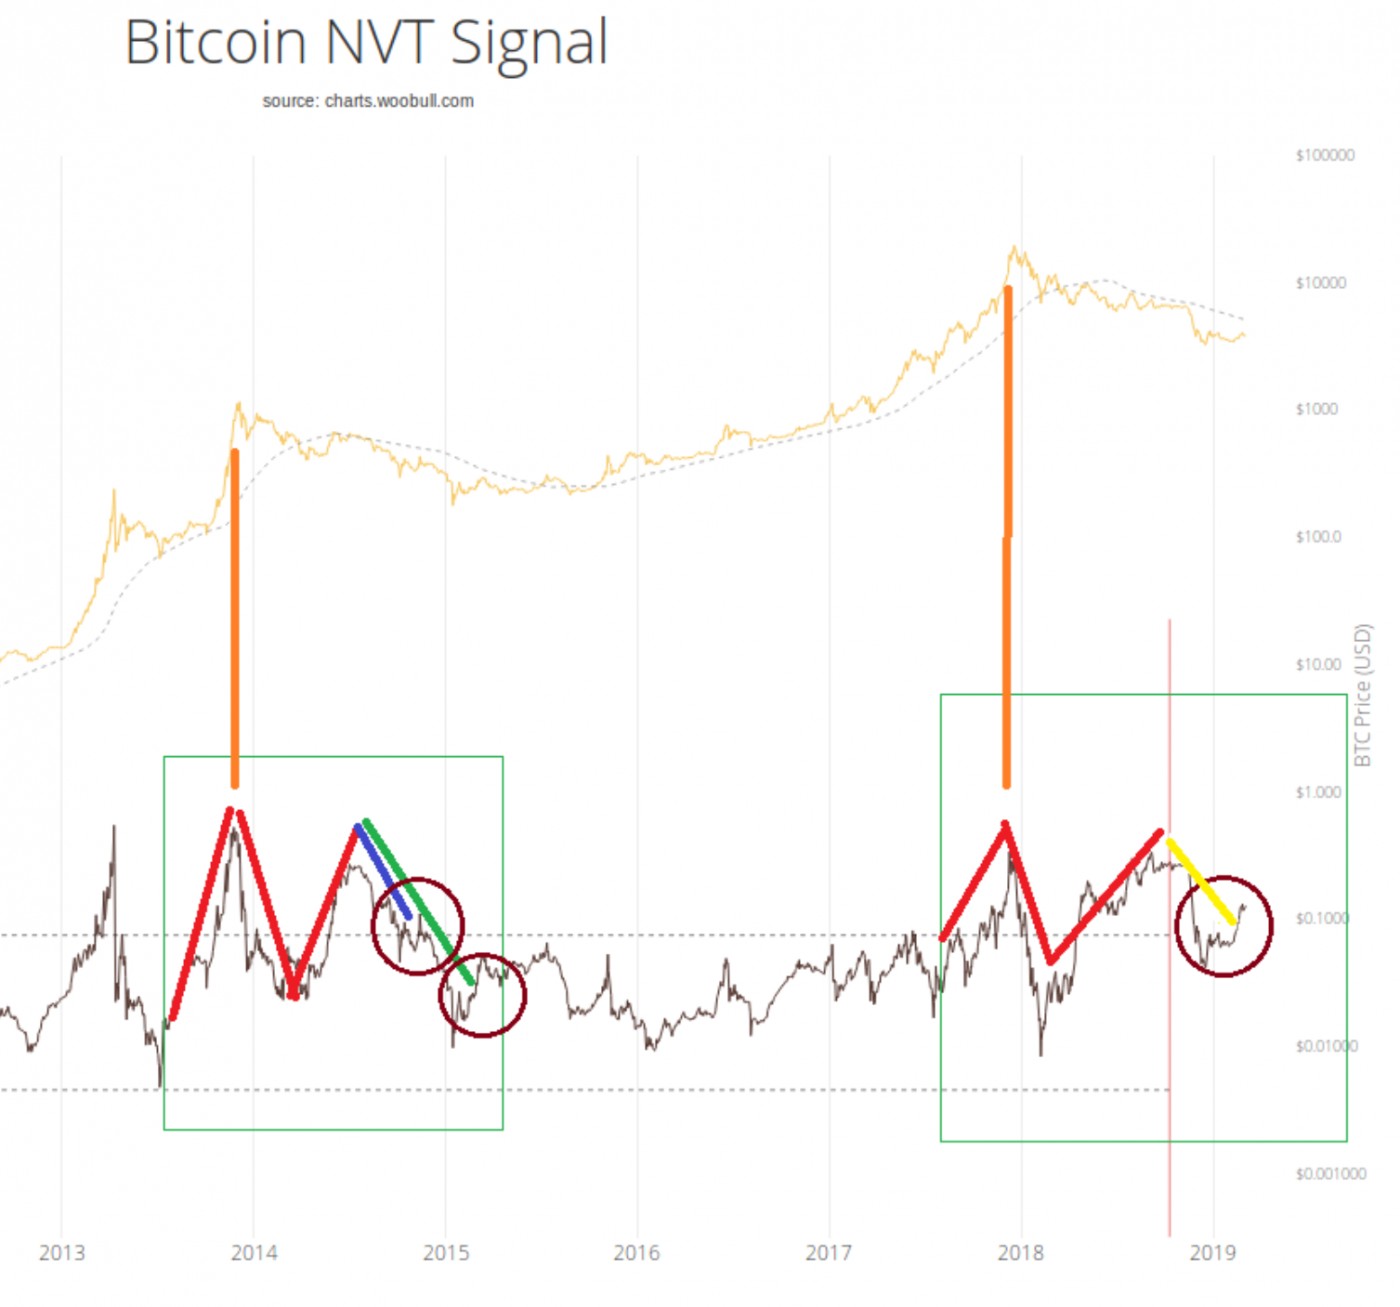
NVT Signal
But if the current uptrend in the NVT Signal chart shown below (showing bitcoin's network value to $ value of transactions) is broken, that could suggest bitcoin could retest lows of $3122 or at least head lower in the short term. Indeed, the chart below shows bitcoin is still way overvalued. But markets are forward looking, thus as institutions come aboard, and a bitcoin ETF is anticipated, plus the massive impact of a decentralized, private, and secure way to transact value becomes increasingly more solid, perhaps bitcoin can trade at higher valuations than before as the new norm.
Liquid, Bitcoin`s first sidechain, went live 10 Oct 2018, taking volume off the main chain. That said, the volume since the launch has been small thus relatively insignificant so far, thus NVT Signal remains a valid metric. Should sidechain volume increase, NVT Signal will have to account for any such increases.
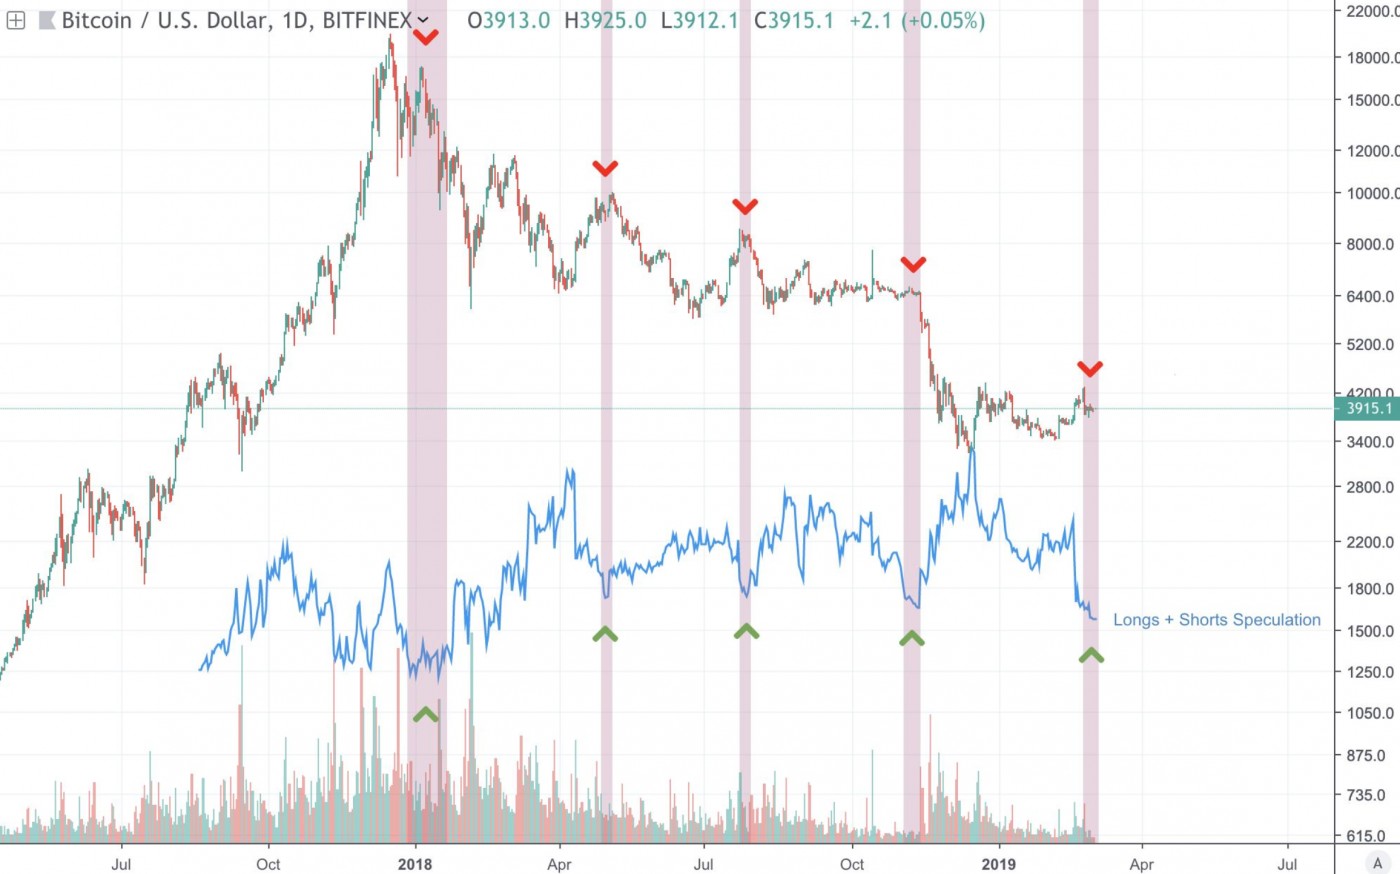
Longs + Shorts Speculation (on major exchange Bitfinex)
The chart below shows this was near intermediate lows as of early March. Each time this has occurred, the price of bitcoin has sharply dropped. It is currently March 23. Longs + Shorts has ticked mildly higher since early March. If the downtrend persists, bitcoin's price will most likely drop sharply though it could rise at first as it did in early May 2018 before falling. But if the bitcoin bottom occurred on December 15, 2018, bitcoin's price will most likely rise from here but perhaps in the slow, plodding manner it did in 2015. So far, this is what has happened since March 2 when Longs + Shorts Speculation hit a major low.
Dead Cat Bounces

Bitcoin and ethereum have had nothing but dead cat bounces. Bitcoin has always had a major capitulation in price/volume action at major lows. Less significantly though worth mentioning, most all major cryptocurrencies in the top 40 have had nothing but dead cat bounces in the last few months, less impressive than prior dead cat bounces. That said, such coins don't need to have a major bounce to signal the start of a rise in price. They can start with a whimper, then accelerate. Further, OBV is bullish for the first time since bitcoin topped in Dec-2017, thus this current bounce may not be a dead cat but a live bull.

Note, bitcoin plummeted in late 2018 after trading quietly because it was hit with a triple whammy:
1) G20 member nations agreed to further regulate cryptocurrencies to prevent money laundering and terrorist financing. Plans were also made up to increase taxation of the digital economy. Tthe U.S. Department of the Treasury also called for increased global oversight of crypto.
2) Bitcoin’s mining difficulty saw its second largest decrease. Difficulty fell by roughly 15% to around 41 exahash per second. It’s clear that the price fall is causing some miners to turn off their machines.
3) The US SEC (Securities and Exchange Commission) once again delayed the approval of a Bitcoin ETF.
Of course, any repeat or rhyme of the above would probably be less of an issue since markets often get desensitized thus less reactive to similar news events.
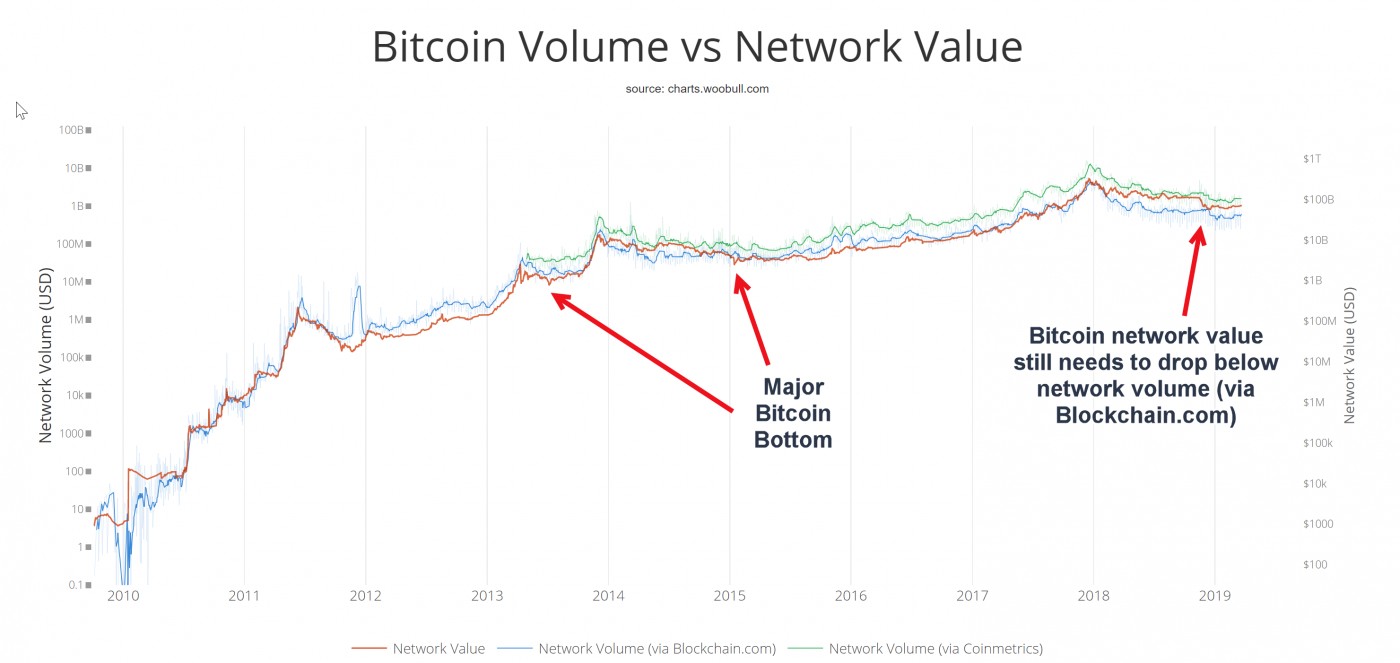
Bitcoin Volume (via blockchain.com) vs. Network Value
The gap between volume (via blockchain.com) and network value may need to close. See 2013 and 2014-2015 in the chart below. But again, if there is a new norm at hand, then history does not have to repeat.
This is the one issue that could send the price of bitcoin plummeting: The SEC decides to be heavy handed with regulations. Egs: What if the number one exchange Binance which allows the trading of securities on its exchange is told to cut ties with its U.S. investors which make up more than 25% of its customers. Note that Binance is the only top 10 exchange that is neither regulated (see slide 14/) by FinCEN as Money Service Businesses nor by NYDFS under the BitLicense. That said, some SEC members have voiced how blockchain is the way forward, thus are less likely to be heavy handed but measured in their approach.
Is Bitcoin Being Materially Controlled?
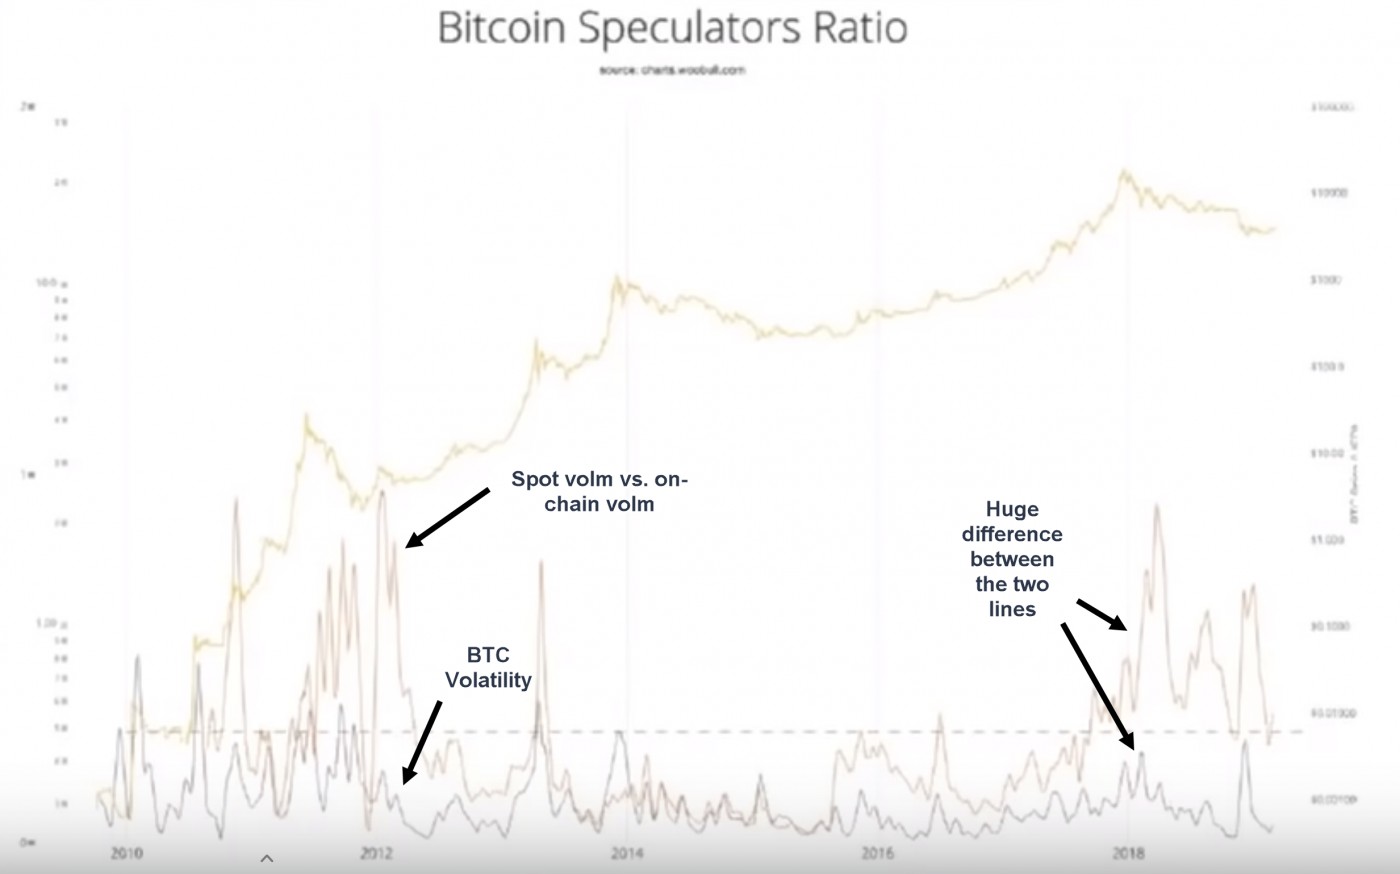
Bitcoin Speculators Ratio
The orange line in the chart below (created by Willy Woo) represents the ratio of volume being played on exchanges (spot volume) vs. on-chain volume. HODLers and traders will send coins to exchanges at times. The ratio shows how much short term price speculation is happening. The higher the orange line rises, the greater the speculation. That said, if the number of long term HODLers has increased due to a fundamental shift in the perception of bitcoin, on-chain volume would decrease which could also explain the unusually large gap between the two lines since late 2017. The line under the orange line is price volatility. Both lines usually track well such as after the bitcoin bubble burst at the end of 2013, and through much of the bear market.
The above explanation notwithstanding, the gap between the lines normally suggests bitcoin manipulation. It grew in the following cases:
=In early 2012, crypto exchange manipulation games were being played causing volume to spike well above volatility. This was a one-off event as a major bitcoin whale with about 100,000 btc needed to keep the price of bitcoin at certain levels so he would not default on his bitcoin savings & trust which he used to grant bitcoin loans. This individual had enough bitcoins to put price floors on bitcoin back then. Once bitcoin started to rise, this level of manipulation came to an end as can be seen on the chart.
=Major manipulation also started in late 2015 with Chinese exchanges manipulating the price.
=Since the second half of 2017, there has been unexplained manipulation that continues to present day. Perhaps in late 2017, many realized that bitcoin was perhaps here to stay given the Winklevoss attempt to launch a bitcoin ETF. Many thus realized bitcoin was not all about drug money and other nefarious activities. As a consequence, many larger entities including institutional funds got involved with bitcoin. This boosted the level of trading sophistication. The number of long term HODLers also may have increased. Certainly, over the past few months, this has been the case as shown in the UTXO chart above.
Nevertheless, tt is now estimated that about $300 mil of bitcoin sits on exchanges which is used to push the price of bitcoin around. It is likely, according to various analysts, that 90% of this sits on the Bitmex exchange. Who is doing this? It could be multiple hedge funds, most likely quant-based, running their algos. But such control is typically short-lived and generally would not suggest that bitcoin can now simply begin a new bull market if it is currently overvalued.
Unless...
...the yellow line shown below is now the new norm for the Bitcoin NVT Signal which is picking up how much the network is locking up coins into long term HODL. If the amount of bitcoin being held longer term is increasing, the number of transactions would fall thus the new norm for NVT Signal would be higher than in prior years. In such a case, a major low in bitcoin would have already been achieved when it traded down to $3122 on December 15, 2018.
Bitcoin Total Traded Volume
Bitcoin total traded volume is on the rise but also rose in April 2018 and in mid- to late 2014 before bitcoin's price fell. That said, bitcoin's average volume has been unusually large since Feb-2019 despite the relative quiet price pattern in bitcoin. It is interesting that the selling is being met by the buying to keep a floor on the price of bitcoin despite the large volumes. Of course, this could also be viewed in a bearish manner to suggest the buying is being met by the selling if there are large holders who are determined to keep a ceiling on bitcoin. But it is more likely that given the increasing levels of acceptance of bitcoin by the big players, this volume represents accumulation of bitcoin by both big players and HODLers.
If Bitcoin is Materially Controlled, Is the Bottom Already In?
The bitcoin market could be increasingly controlled and manipulated by bitcoin whales and quant hedge funds in the cryptospace. It is therefore not surprising that some think the NVT Ratio and thus also the NVT Signal have been artificially inflated over the last many weeks leading some to think bitcoin is therefore more controlled now than ever before.
The same thinking concludes that we may not need any major negative news to reset the bitcoin market. Certainly, Forex markets don't have to reset, but then, this is often due to major changes in leadership or economics since such changes within countries can be turbulent and permanent. Bitcoin is decentralized thus while controlling the bitcoin market can occur, such control is short-lived, much as algos in the stock market can influence direction but only over the short term. This is why my mentor William O'Neil was able to amass such a massive fortune in the billions of dollars over his entire career. He stayed away from the market's 'noise' and focused on major trends in stocks and in the general market, thus was on the right side of major market moves, whether bull or bear.
To summarize, Bitcoin NVT Signal is not overvalued and suggested bitcoin bottomed if:
1) The number of long term HODLers has materially increased due to shifts in perception of bitcoin. This reduces the number of transactions.
2) The big players are manipulating the price of bitcoin now more than ever before as they have gained confidence that bitcoin is here to stay. Bitcoin is new money, a new way to store wealth, a new way to transact value. It can co-exist with fiat and other cryptocurrencies. It is increasingly believed the fundamentals of bitcoin are so solid that bitcoin is not on a race to zero in the long term but on a race into the millions. Further, the fundamental strength of the governance model that takes bitcoin development forward remains fierce.
Also keep in mind that if bitcoin is being so heavily manipulated by the big players including some on Wall Street, this manipulation is of bitcoin's price, not its code, as they have the confidence that bitcoin's underlying code will not be manipulated from under them. Other cryptos, by contrast, are not decentralized, thus the manipulation of code is possible.
Both 1) and 2) above shift the NVT Signal into a new norm that is now higher than ever before. In such a case, a major low in bitcoin would have already been achieved when it traded down to $3122 on December 15, 2018. If so, bitcoin and the cryptospace are off to the races again. That said, a slow, plodding move higher as we saw after bitcoin bottomed in Jan-2015 would come as no surprise, but would give the top performing cryptos as we saw at the beginning of this piece, a chance to appreciably rise.
Non-Issues
Non-Issues that used to cause the price of bitcoin to drop (and still could despite the wrongheadedness of these views)
1) The number of miners drop as the price of bitcoin falls. Law of supply and demand apply here. The fewer the miners, the more profitable the remaining mining pie. Thus predictions of bitcoin price collapse due to all the miners leaving is nonsense.
2) Bitcoin 51% attack. A non-issue. See my article here.
3) Major crypto exchange hacked. This was a big deal back in 2015 but successful hack attacks to major crypto exchanges are few and far between today. Bitstamp reimbursed investors the $5 million that was hacked from its exchange in January 2015.
(͡:B ͜ʖ ͡:B)