
Wrong date can happen once in the new year ????
Dr. K in the Lab
by Dr. Chris Kacher
The (R)Evolution Will Not Be Centralized™
Market Direction Model vs. Choppy Markets
2019 was one of the choppiest years we have experienced due to the tug-o-war between a faltering global economy and increasing levels of quantitative easing (QE). Even the Market Direction Model (MDM) which had adjusted to accommodating the wider trading ranges of the major indices to minimize whipsaws due to the choppiness of 2018 was pushed into cash signals at times during 2019 due to relatively steep corrections between May and October.
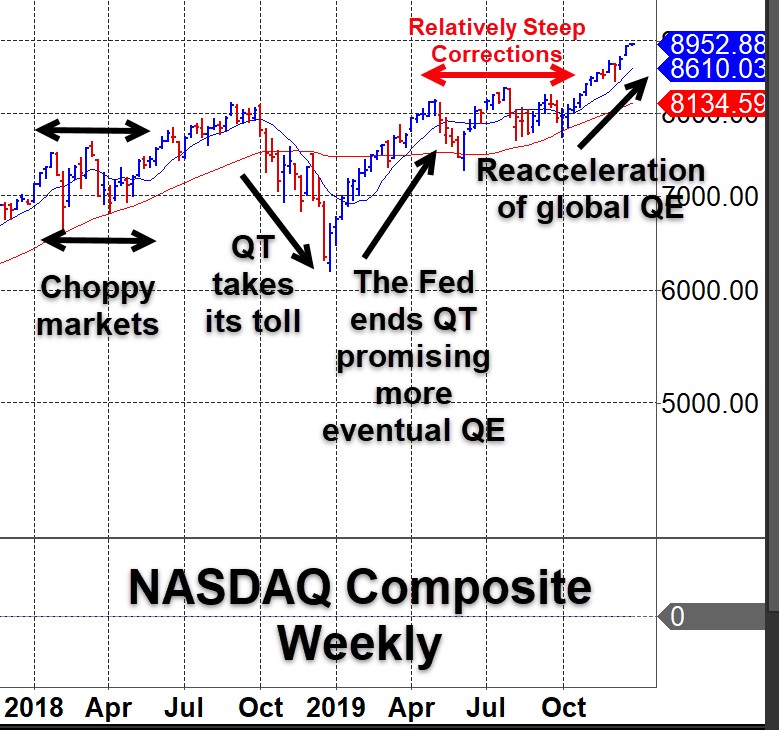
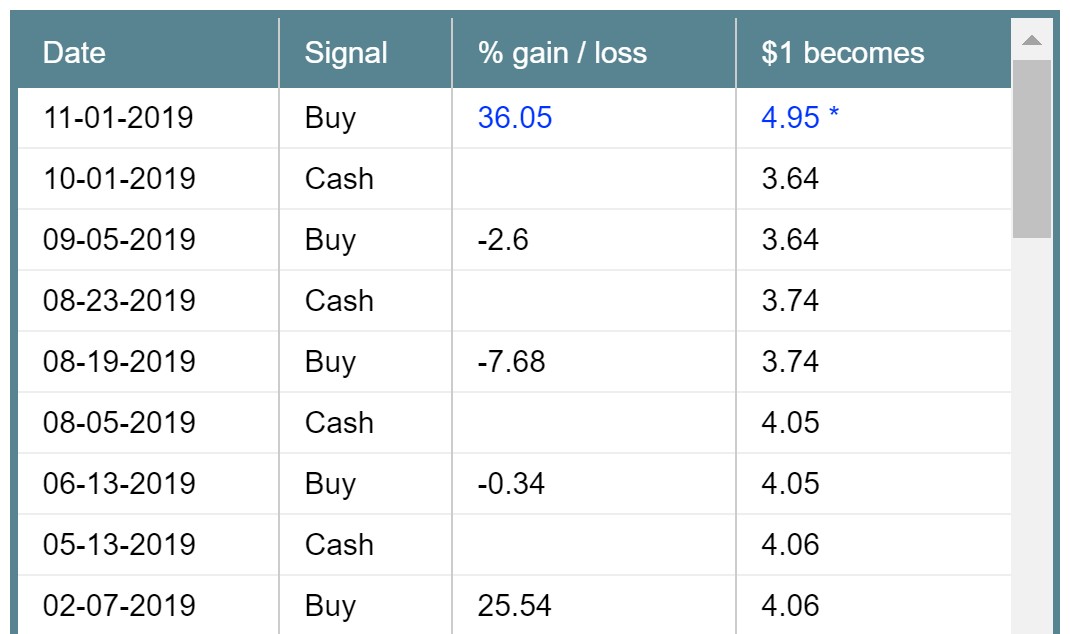
Nevertheless, the MDM managed a +25.5% gain early in the year as markets pushed on a string driven by renewed support that the Fed would give the markets what they want- an end to quantitative tightening (QT) and the likelihood of renewed levels of QE and lower interest rates. MDM managed to surf the riptide market chop as it was able to manage losses relative to its gains with the NASDAQ Composite and 3x Direxion Technology ETF TECL. It was then off to the races again prompting the MDM to sound the "all clear" and issue a buy signal at the start of November.
Bull Run: Major Indices, Precious Metals, Bonds, and Bitcoin
As I wrote about in a recent report, since the REPOcalypse, levels of global QE have surged which of course has favored U.S. stocks and precious metals. While a shortage of liquidity could take down Treasurys and eventually stocks as long-short equity strategies depend on instant liquidity to manage their leveraged positions, it is highly likely the Fed will be forced to launch QE4 to avert any violent unwinding of any massive speculative financial positions created by central bank meddling. This will push debt to new record highs as interest rates fall toward 0% or, as in the case of Germany, Japan, Switzerland et al, push deeper into negative territory. The $18 trillion in negatively yielding bonds underscores this point.
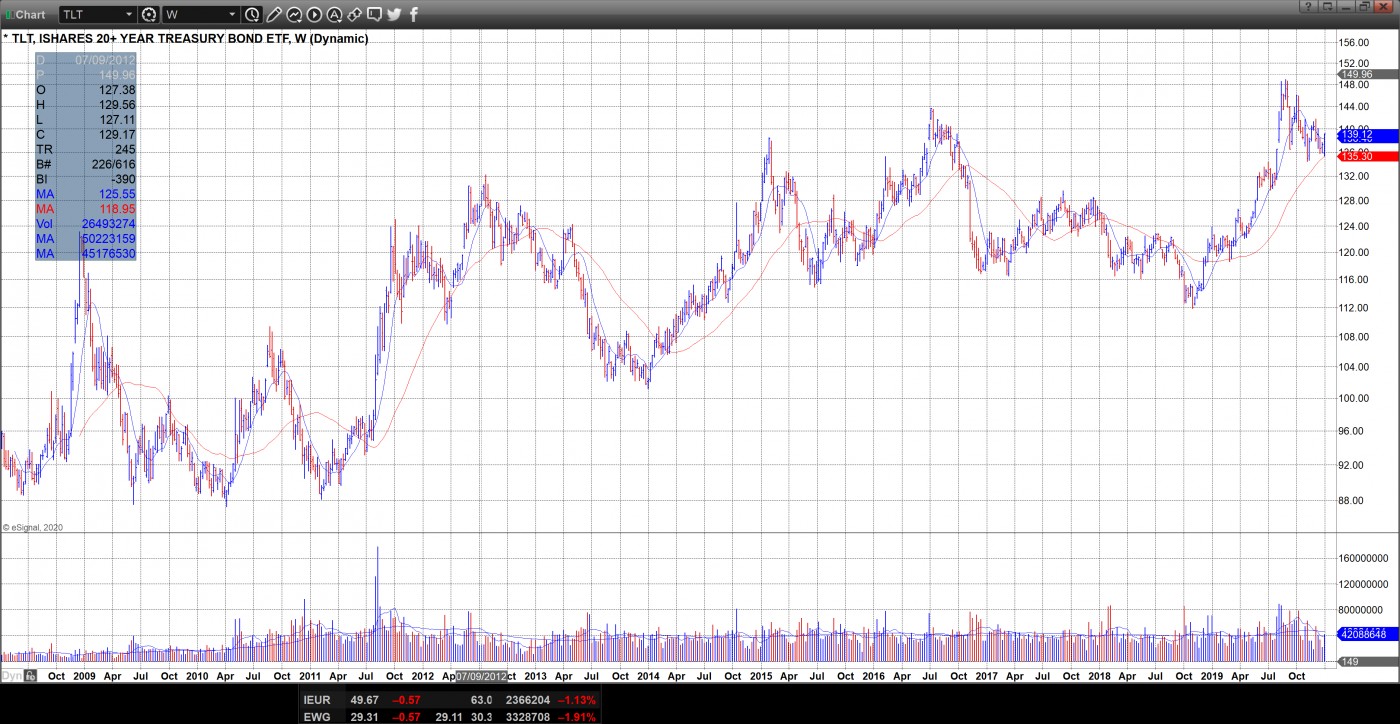
The 20+ year Treasury bond ETF TLT has wended its way higher as can be seen on a weekly chart since QE started in late 2008 to address the financial collapse that year. Since Fed Chairperson Powell soothed the markets in late December 2018, bonds have shot higher. Given the global economy and the repo issue, odds favor TLT heading higher after having digested some of the sharpest gains on record made earlier this year from a low of about 112 to a high of about 149, or 33%. It has since pulled back to around the 139 level as of this writing.
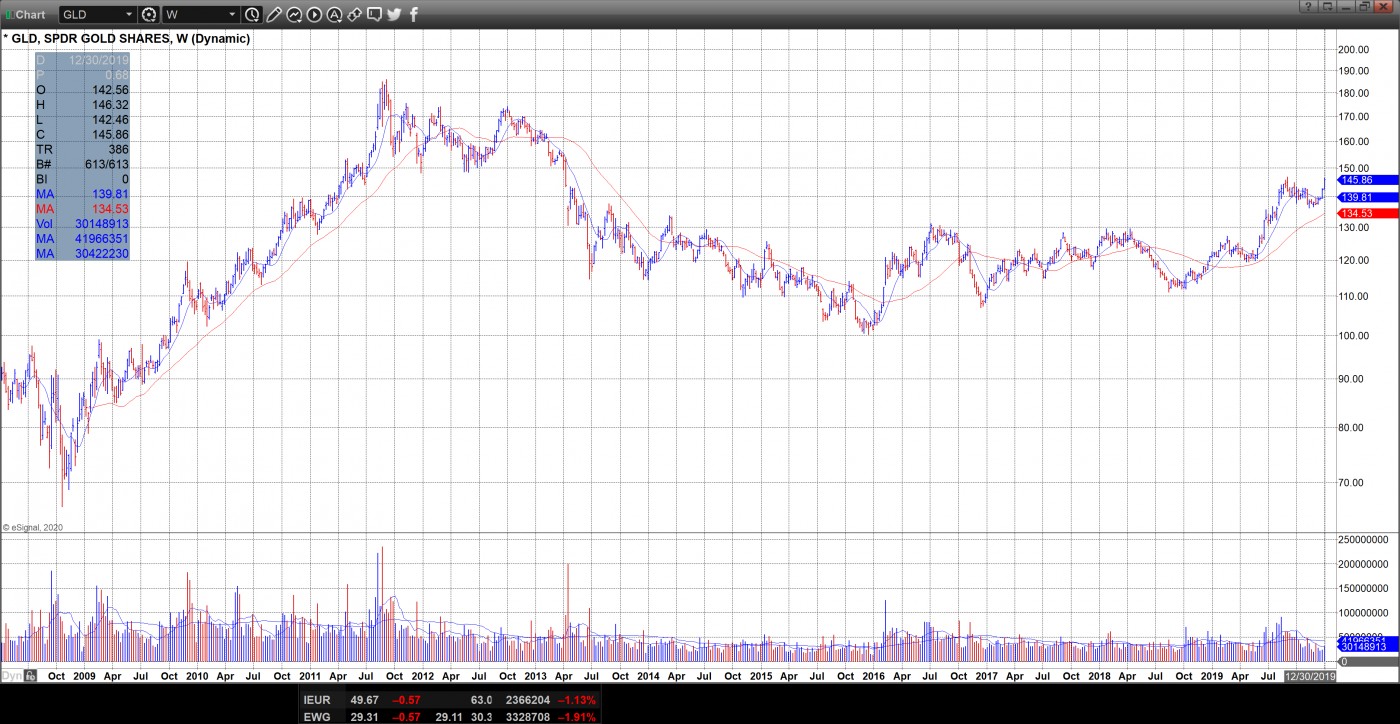
A similar situation applies to the precious metals which made steep advances earlier this year, finally breaking the go-nowhere, largely trendless action since 2011 on appreciable volume as observed in the gold ETF GLD and silver ETF SLV. Just as with TLT, odds favor both GLD and SLV as well as their equivalents heading higher after having digested material gains made earlier this year. Since the second half of 2018, gold rose about 32% while silver rose about 41%.
Fiat is inflationary by design while bitcoin is deflationary by design. The recent surge in global QE among other tailwinds I've written about in prior reports including the bitcoin halving in May 2020 should also help push bitcoin higher after having well-digested the sharp gains of well over 300% it made earlier this year as shown in the bitcoin ETN GBTC. Having rocketed from just below 4 to over 16, GBTC has since pulled back to around the 8-9 level. As the log plot of GBTC shows, while this pullback from peak-to-trough of nearly -50% is steep, it is not out of the norm when it comes to how bitcoin trades.
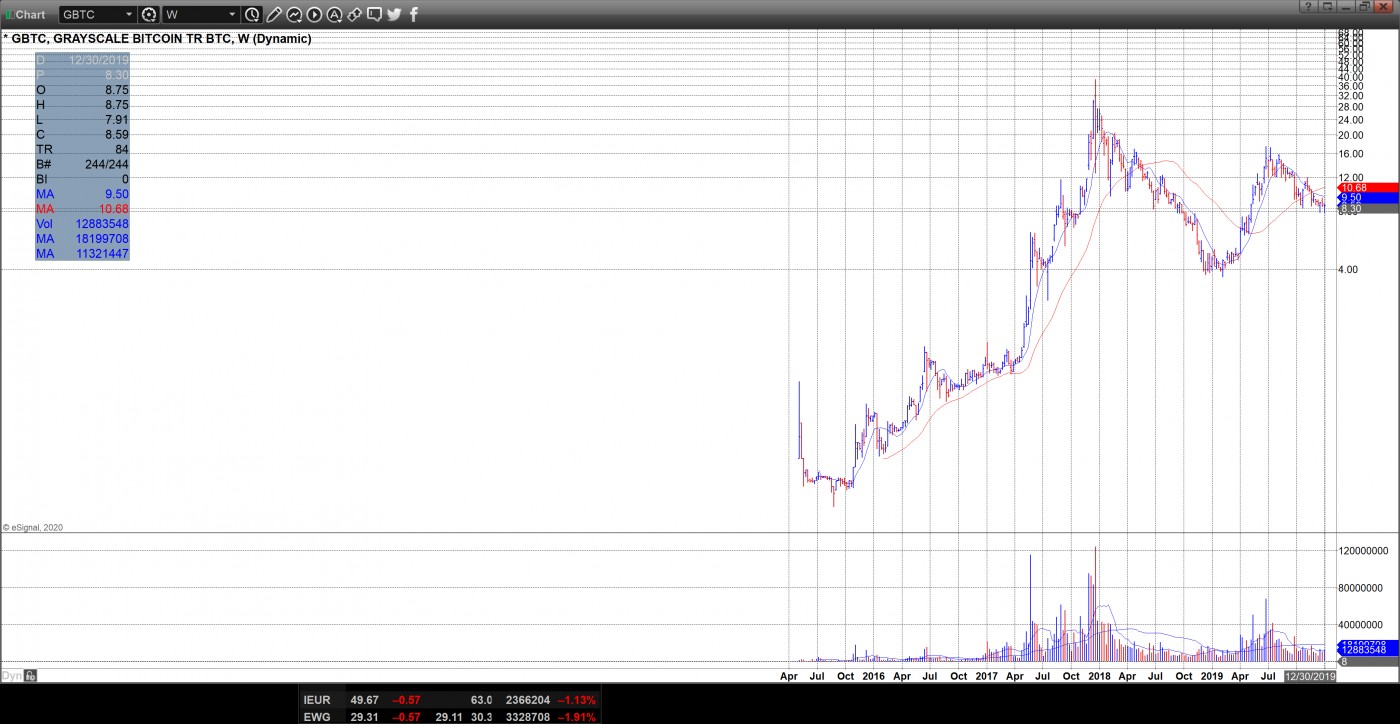
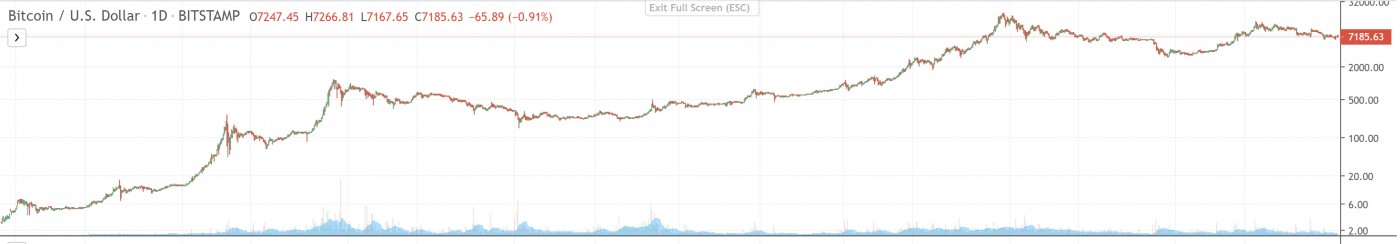
A long term log plot of bitcoin itself solidifies this concept. Note that the volatility of the GBTC plot above is only a few degrees greater than the volatility of BTC shown below. The y-axis scaling gives the illusion that GBTC is much more volatile than BTC. In reality, GBTC tends to overshoot and undershoot BTC at extremes (when bitcoin is having a climax top or putting in a major bottom) which accounts for its slightly greater volatility vs. BTC.
(͡:B ͜ʖ ͡:B)