
Market Lab Report / Dr. K's Crypto-Corner
by Dr. Chris Kacher
Quantum Poodles Bringing Billions to Blockchain™

Operation Twist Part 2?
Powell did not give the markets what they wanted in his recent statement. Powell is concerned about being behind the inflation curve, so CME Fed Fund Futures is now putting a 4.1% chance of a 25 bps hike by the April 28 meeting. Nevertheless, as bond yields continue to shoot higher on the longer end of the curve, the Fed was expected to invoke what they did in 2011, dubbed Operation Twist, where they sell shorter term bonds and use the money to buy longer term bonds which somewhat flattens the yield curve. This spike in rates such as shown for 10-year Treasurys in the chart below is not sustainable given the lack of economic growth, lockdowns, and new COVID mutations which mainstream media can twist to their wishes which then begets more lockdowns and quarantines. But the current spike in rates could continue higher for a bit longer.
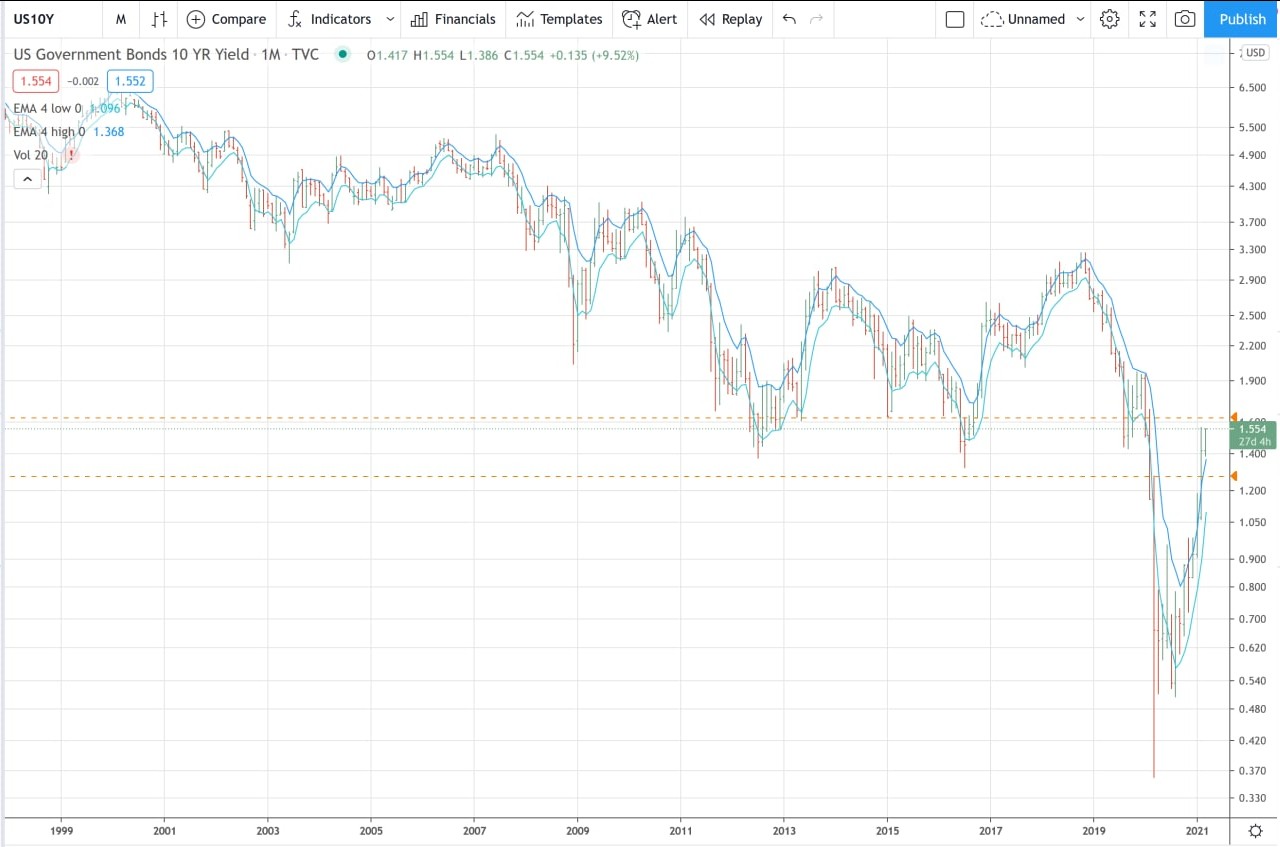
If and when the Fed reinstates Operation Twist, stocks should find their floor. In the meantime, high yields on the long end make bonds more attractive than stocks which attracts capital away from stocks and into bonds. That said, together with the next stimulus package, always keep in mind that shorting carries ample risk, so should you have short exposure in stocks, when you show a fast profit, take it.
Crypto Bull Market Over?
Bitcoin has lost -26.3% and ethereum -36.5% from peak-to-trough in the current correction prompting some to suggest the bull market is over. The correlation between bitcoin and the stock market averages will strengthen should they drop much further. Bitcoin retesting its $40-42K levels would be standard, especially should the stock market decline further due to rising bond yields. In keeping with the sharp corrections in bitcoin which are typical during its bull runs, my metrics suggest we are not even half way through this bull cycle. People then sometimes ask, "But how do you know?" There are numerous reasons which I discuss in detail below.
The nice thing about blockchain is the level of transparency which provides numerous metrics which, when pieced together, provide ample clues as to the age of a particular bull or bear market in the cryptospace. One may then ask why everyone doesn't just use these metrics? Well, it's the same reason why people did not use both fundamental and technical analysis when looking at stocks in the 80s and 90s when both taken together gave a trader a huge edge in terms of riding winning stocks, and is largely responsible for William O'Neil's long standing track record dating all the back to 1958 to the bursting of the dot-com bubble in 2000, or more than 4 decades worth of trading success turning him into a 10-figure trader. But since 2000, CANSLIM and base breakout strategies have not enjoyed anywhere close to the level of success achieved pre-2000. Likewise, these blockchain metrics may become overcrowded if everyone starts using them, thus the bull cycle after this one, say in 2023, may require a modified approach. The only constant when it comes to markets is change.
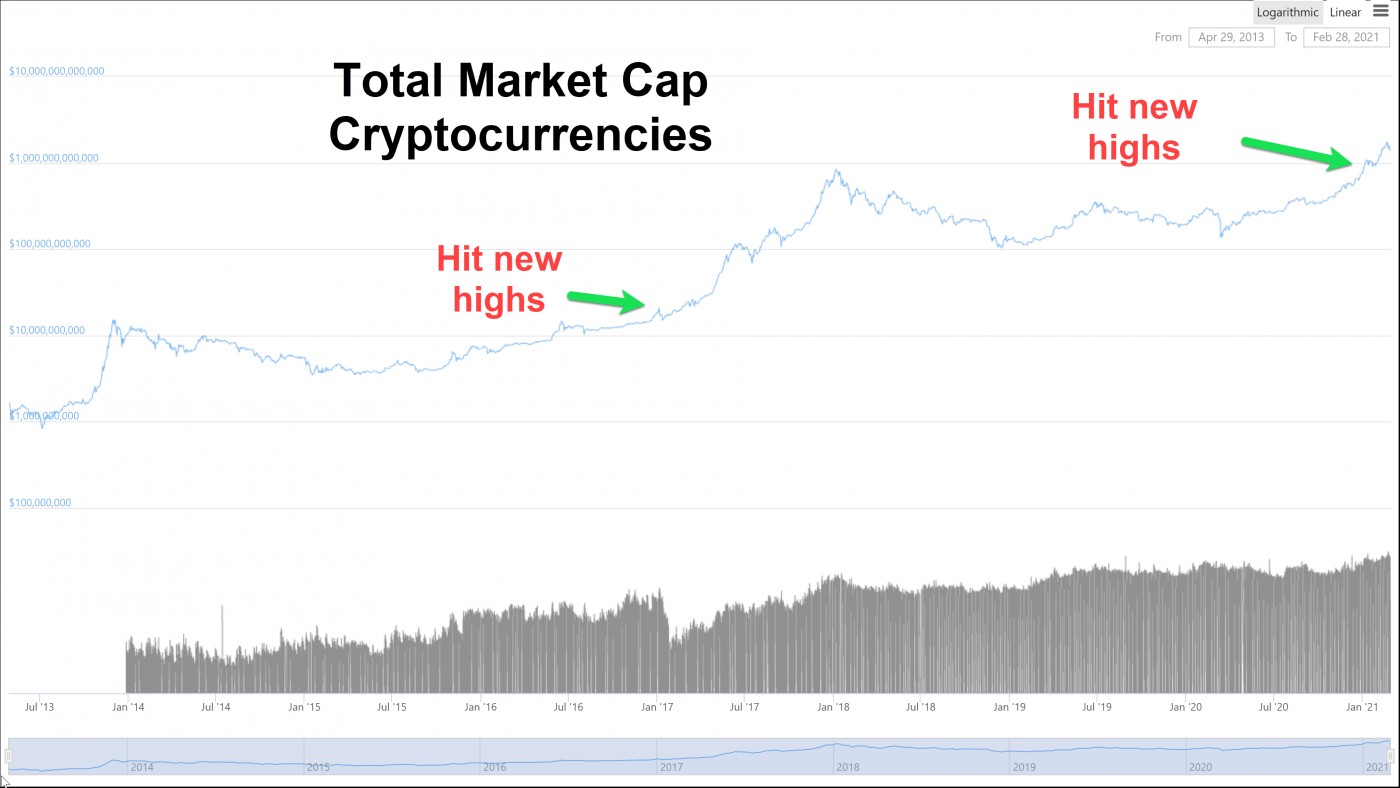
As one of many metrics, the market cap of cryptocurrencies in the last bull run achieved an aggregate value of just under $1 trillion. It currently stands at around $1.5 trillion. From the chart below, this crypto bull market is still in the early stages if the market value of the whole cryptospace is any guide given the massive utility at hand that exists today across many industries, taking them to much higher efficiencies at lower costs. Such utility was absent back in 2017.
Further, the image below shows bitcoins that have been moved over various time frames. The bitcoins that moved last within a month or less as illustrated by orange and red shows there tend to be three stages of buying in each bull cycle. We just completed stage 1.
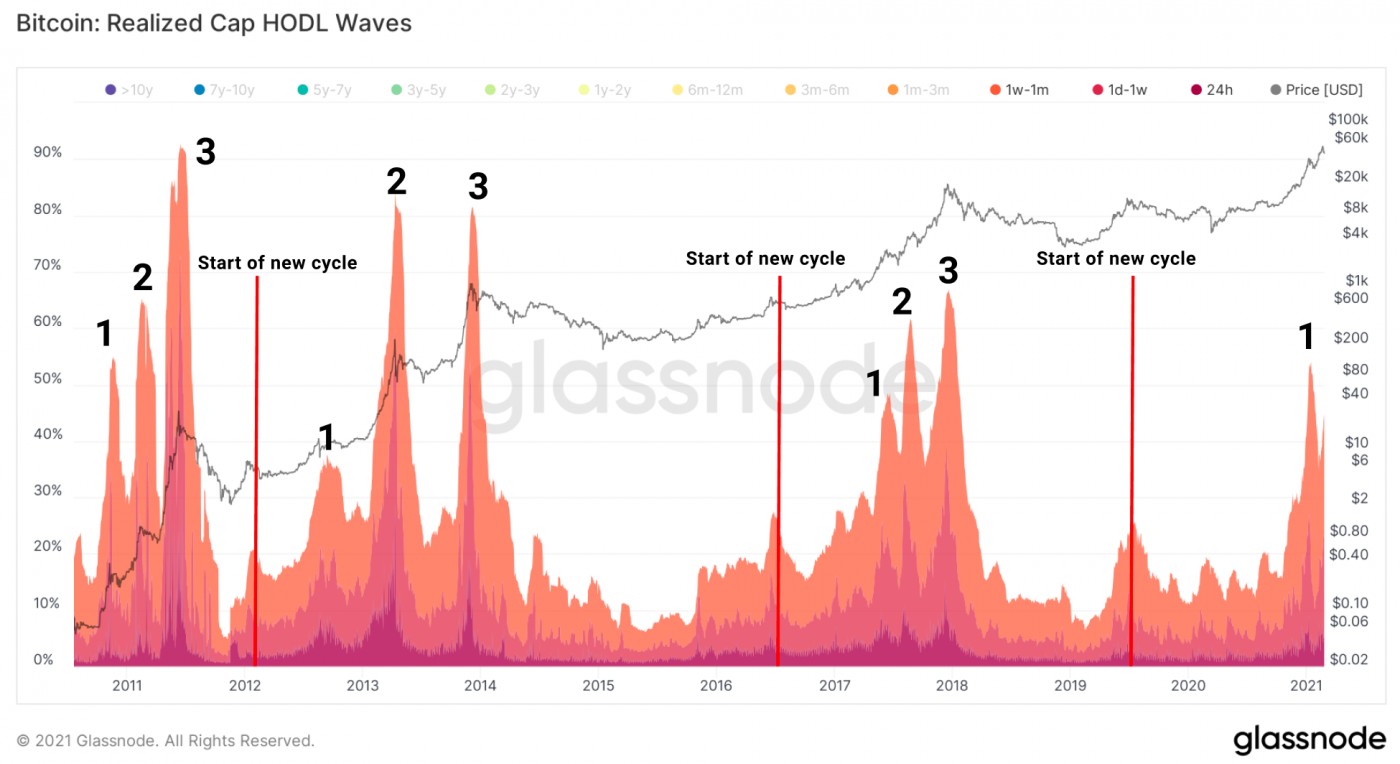
In addition, record levels of bitcoin have been moving off exchanges as many are becoming long term HODLers of bitcoin as major institutions, banks, corporations, HNWIs, and even governments are waking up to the massive utility and onboarding of blockchain technologies including bitcoin and ethereum. This crypto bull market is far from topping out.
Retail and institutional FOMO combined with a serious supply shortage due to companies such as Grayscale and PayPal buying up bitcoin should propel crypto valuations beyond $10 trillion. Corporations are using BTC to reduce the impact of falling fiat from seemingly limitless quantitative easing.
Further, DeFi is being used by bitcoin to earn high yields. Anyone can also use BTC as collateral to avoid having to sell BTC to tap its value through collateralized loans, a nice way to sidestep capital gains tax on their bitcoin while continuing to ride it higher. The amount of bitcoin used for this purpose strongly adds to its supply shortage.
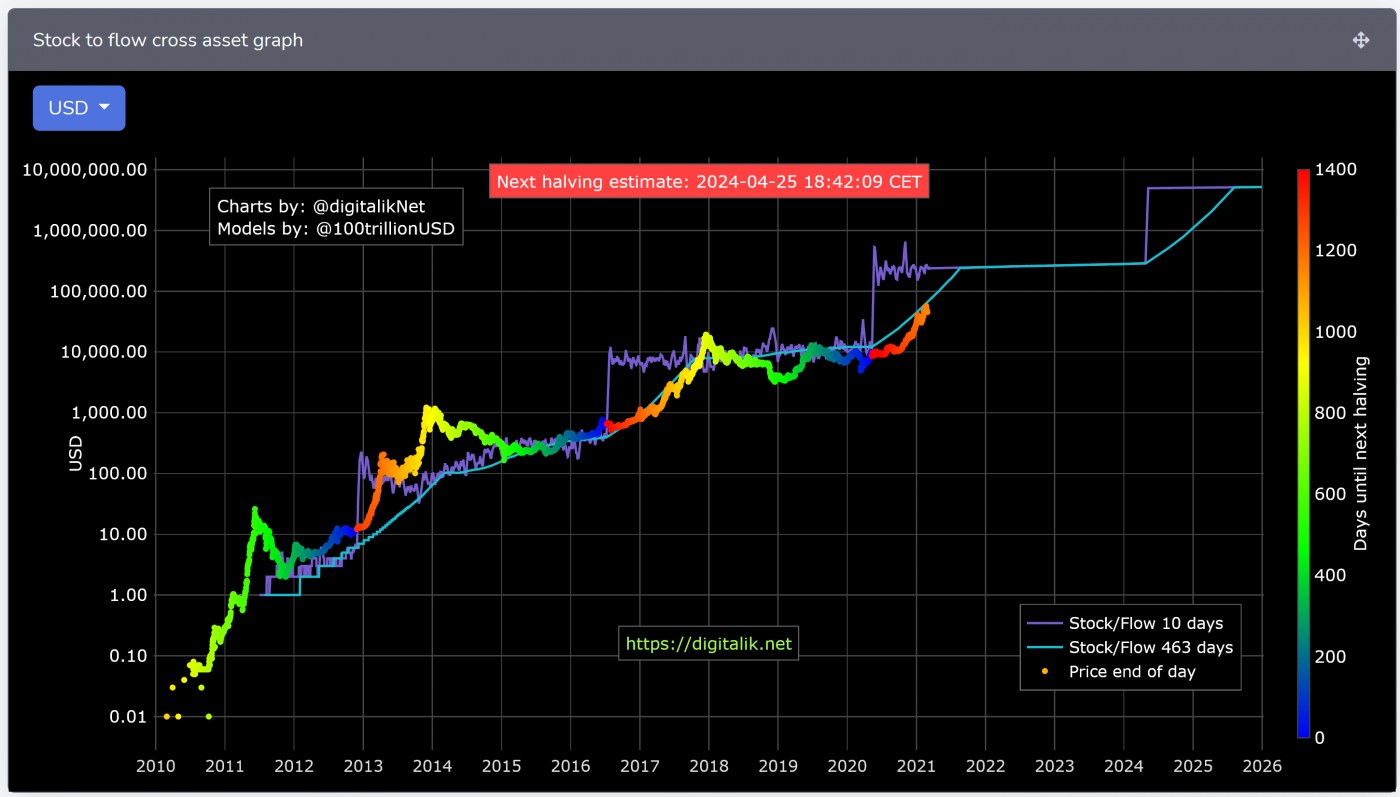
In consequence, the prediction I made in the keynote speech of mine at the Geneva WealthTech event in 2017 of bitcoin peaking reaching $1,000,000 by the end of 2023 still stands. Based on S2F and other metrics, the current bull market should run through at least the fall of this year, if not beyond the end of this year before the bubble, once again, blows apart, black swans notwithstanding.
Prime Metrics Reset
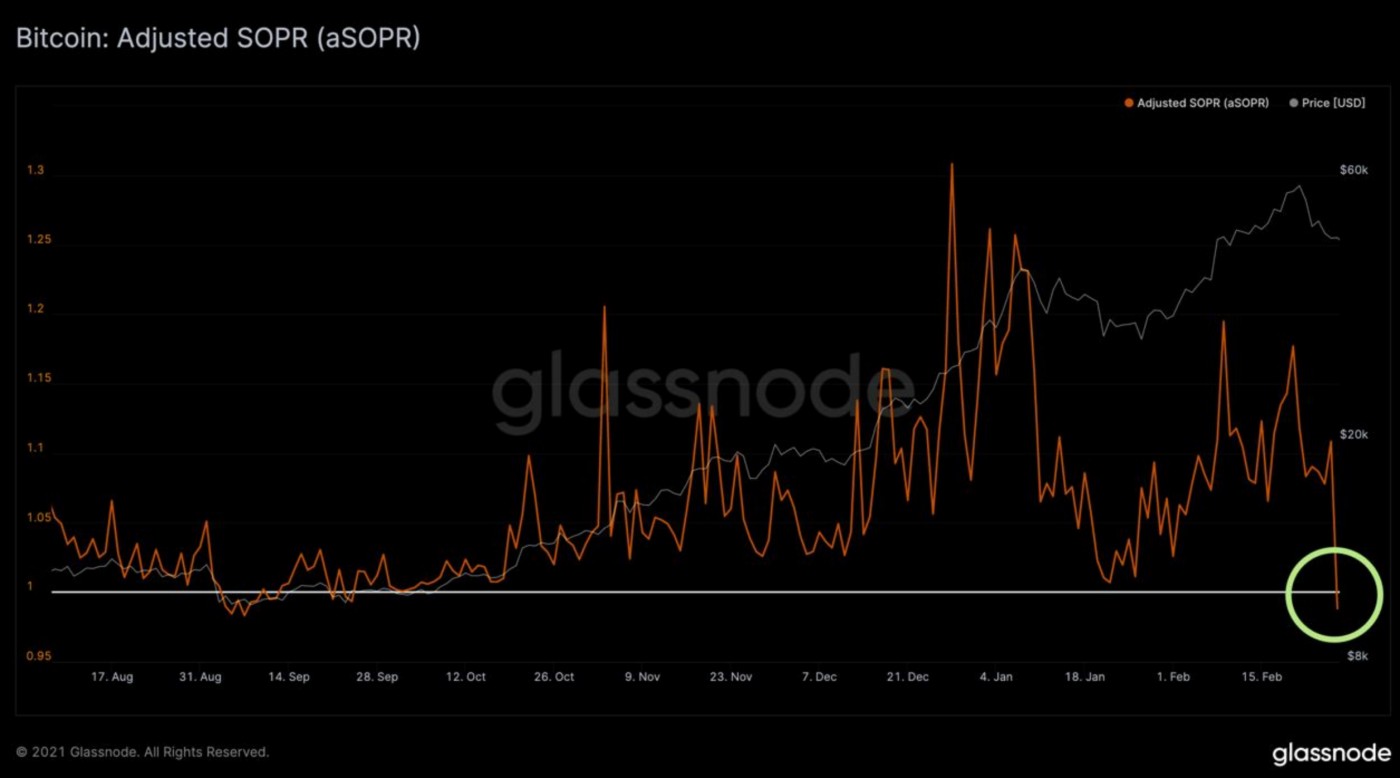
A number of other bitcoin oversold metrics have reset or bottomed which, in prior corrections, often occur near price lows in bitcoin. SOPR (spent output profit ratio) shows the number of bitcoin that are in profit. Whenever it dips below the white line in the chart below, then traders/investors are selling bitcoin at a loss on average which tends to curb selling. The last two times SOPR dipped close to or below this white line was early September 2020 and mid-Jan-2021. Both were price lows for bitcoin.
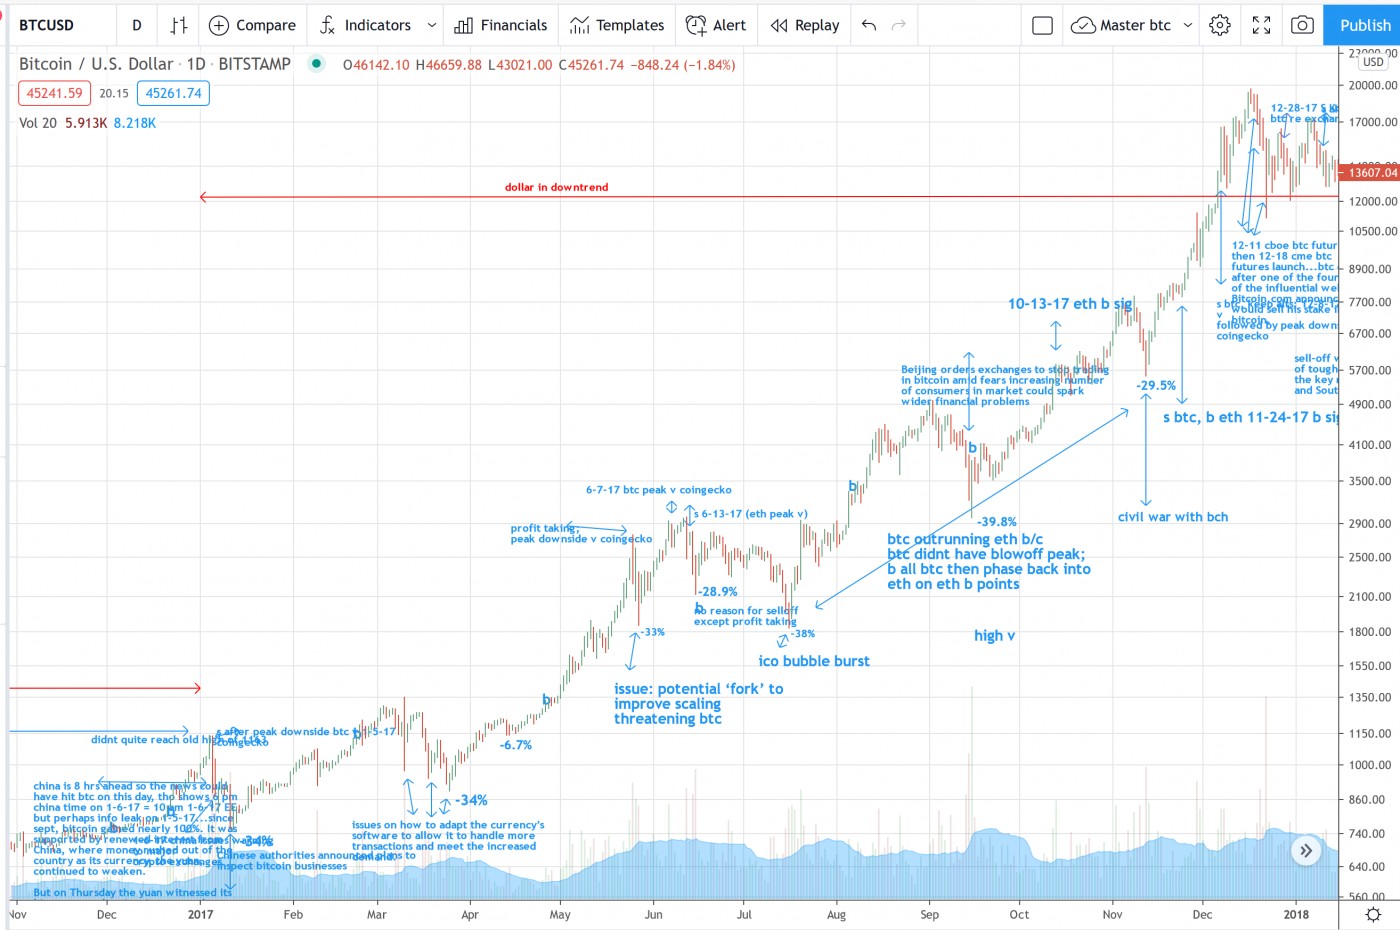
Also keep in mind that bitcoin typically corrects 30-40% in bull markets as it did a few times in 2017 as shown in the annotated chart below. The annotations are my notes thus the image below is just a screen shot of a much more comprehensive in-house study thus the 'user-unfriendly' text in the image. I cite various fundamentals and technicals as driving forces behind significant price moves. I have done this going back to 2011 for bitcoin and 2015 for ethereum as well as for alt coins.
Each time bitcoin undergoes a correction of typically -25% to -40%, investors often give up as mainstream media dogpiles onto the FUD, marking a significant floor in bitcoin each time.
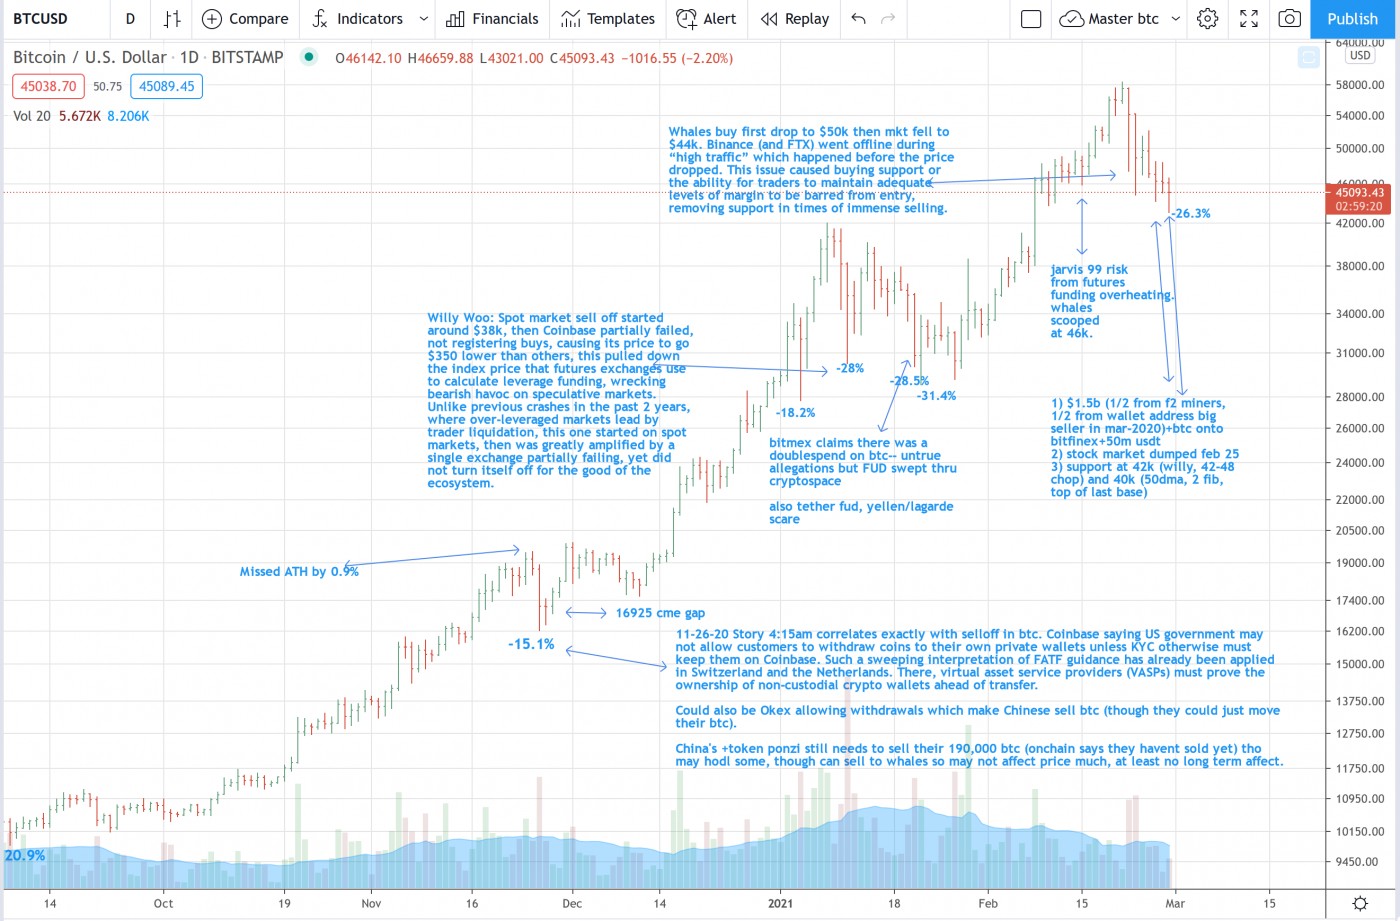
My bitcoin metrics are currently showing diminished selling from bitcoin F2 miners, one of the largest mining pools, as well as a slowing of bitcoins moving onto exchanges which also suggests less selling pressure. Both of these metrics have been largely responsible for the recent selloff in bitcoin. They also contributed to the selling in January when bitcoin had a steep correction, though I cite other reasons as shown in the annotated chart below.
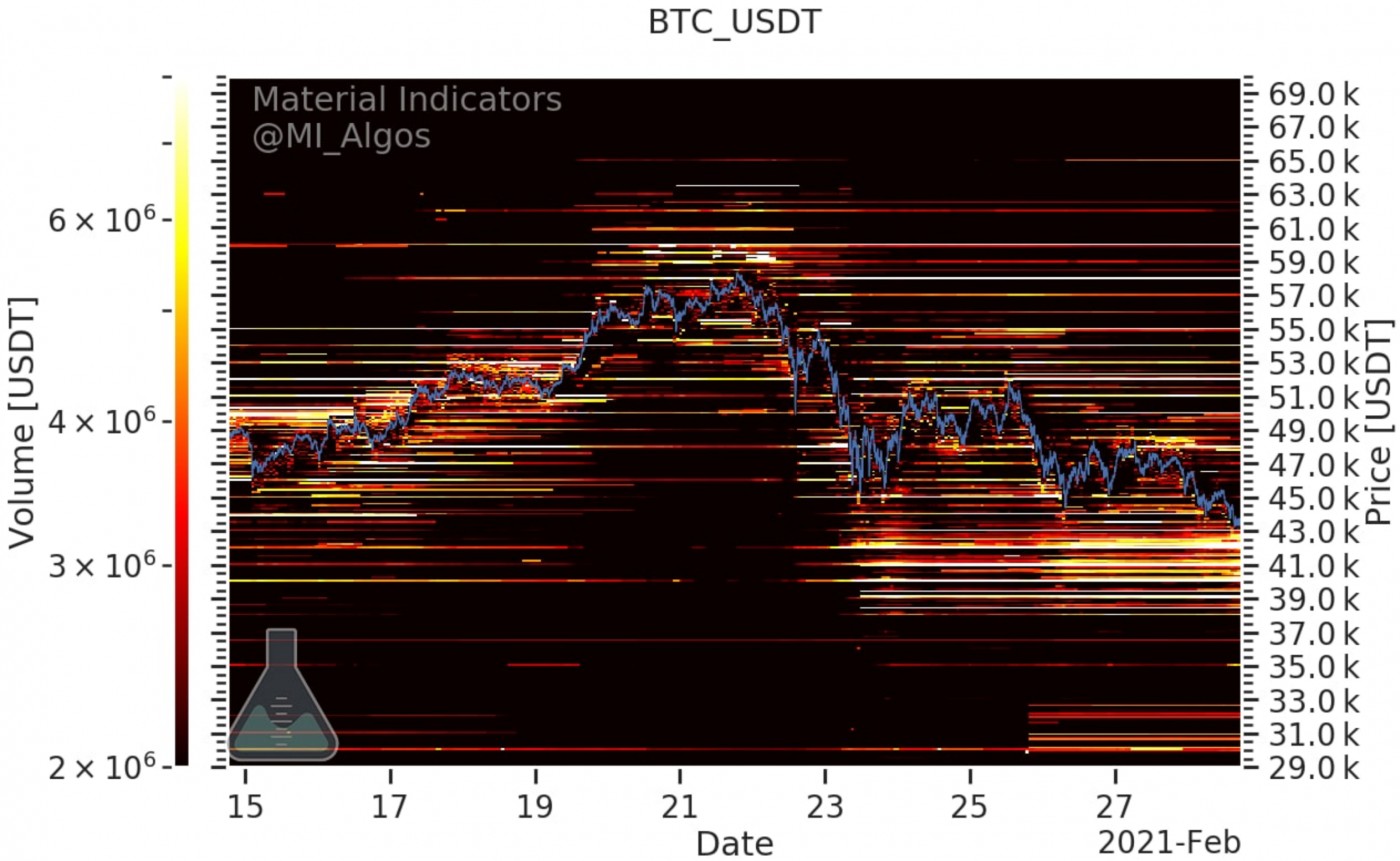
Bitcoin currently has decent technical support between the 40k and 42.5k price levels. The image below shows a high concentration of bids as noted by the lighter colored bars. Other factors include support from bitcoin's 50-dema, double Fibonaccis, and the top of the prior base, all around this 40-43k range.
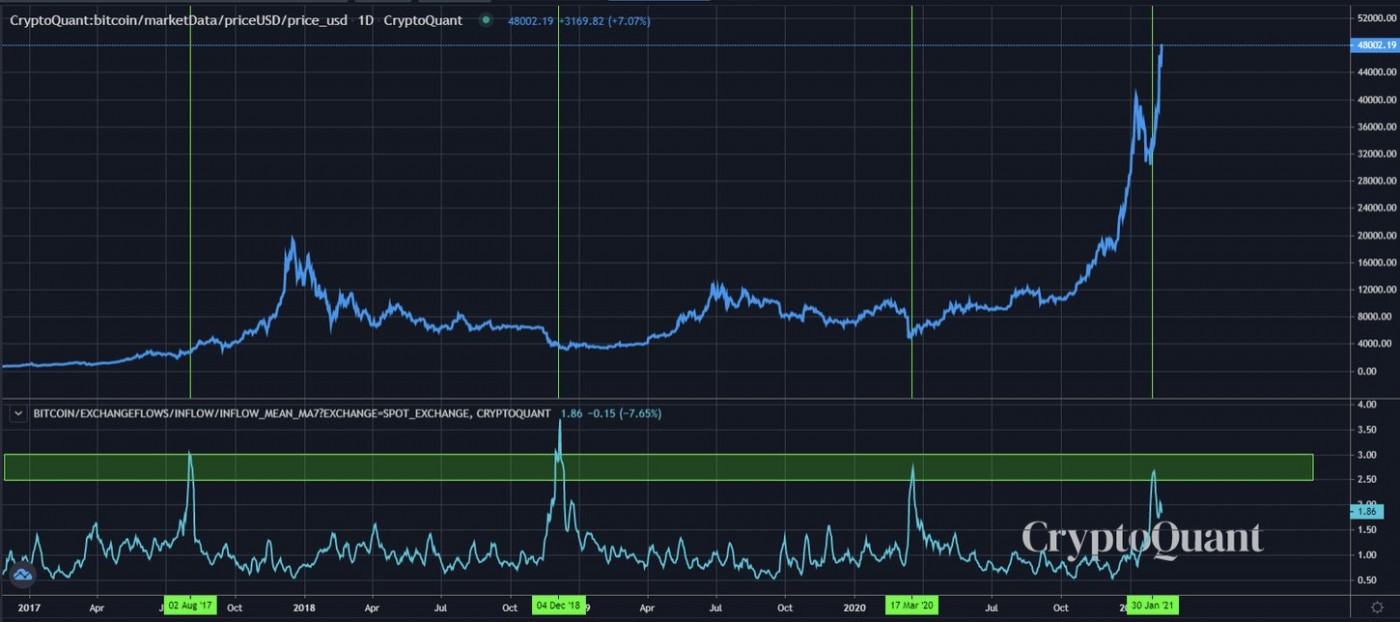
The chart below shows a seven day moving average of the number of bitcoin entering exchanges. Large inflows are bearish since a spike in bitcoin moving onto exchanges tends to be sold but also often marks major floors in bitcoin after the selling completes.
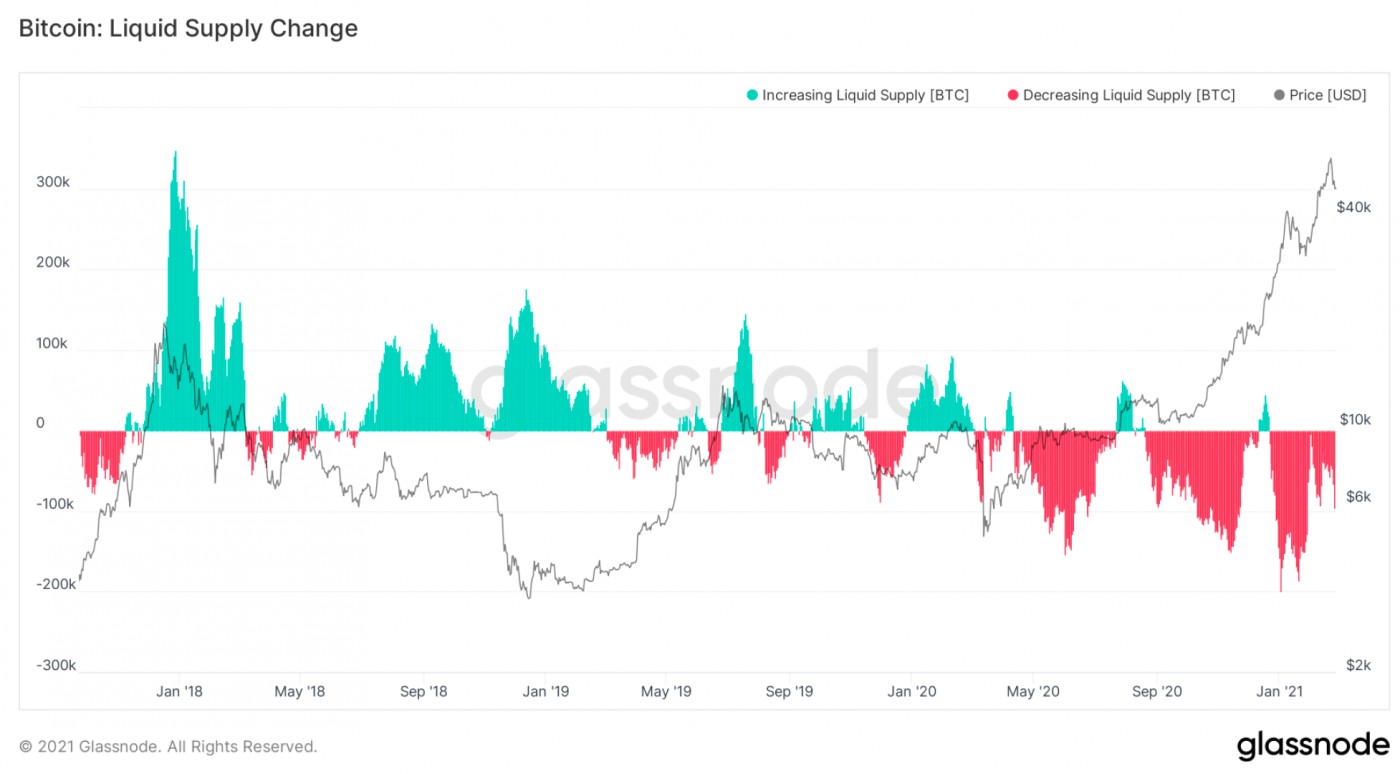
The supply shortage of bitcoin has been discussed in my prior reports and is well illustrated in the image below. This is due to major institutions buying up bitcoin including PayPal, Grayscale, and Square as well as large hedge funds and corporations.
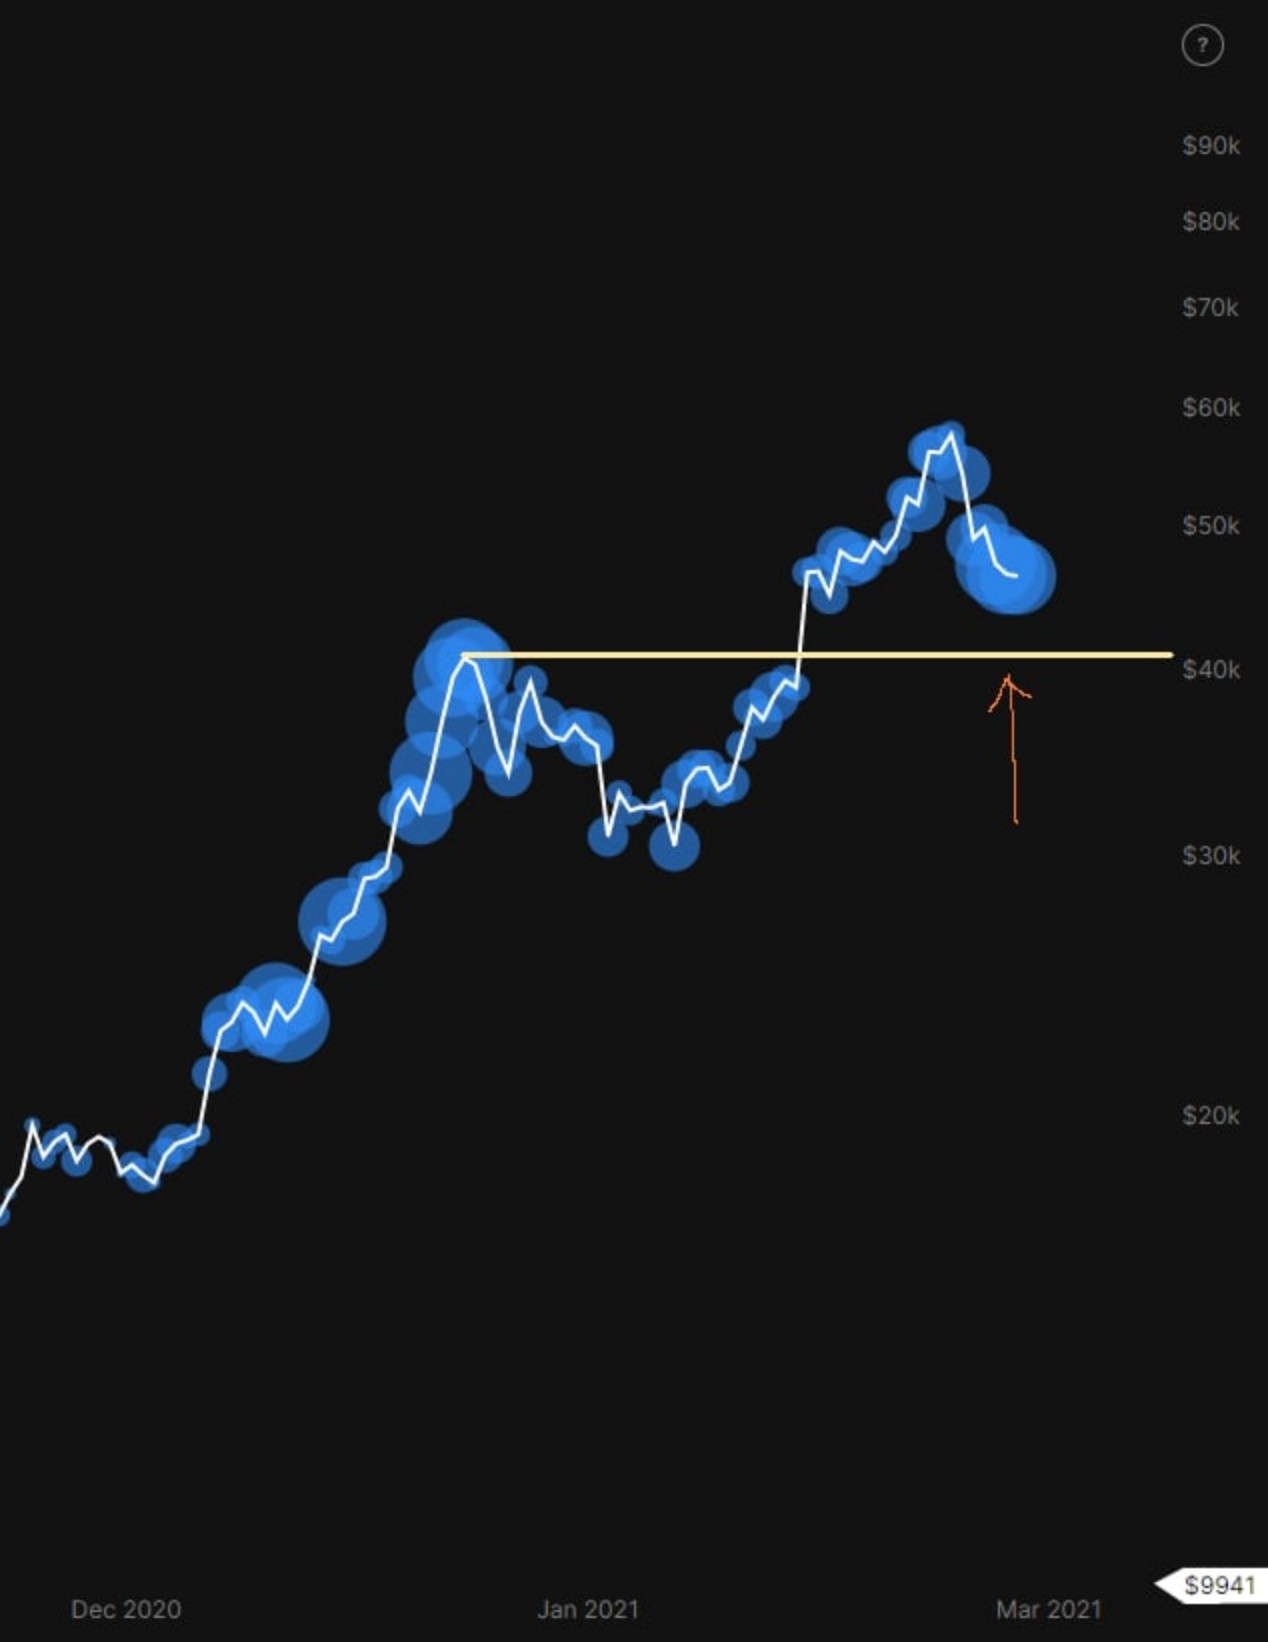
The whale map below shows areas of accumulation or distribution by whales, typically wallets holding at last 1000 BTC. The blue bubbles are the sum total of whale transactions. We see that whales have been accumulating bitcoin in the mid-$40k range.
So the case seems solid that the crypto bull run is far from over. Eventually, the bubble will likely burst once again, but each time since 2011, my metrics have moved me to safety within a couple weeks or less from the peak, and sometimes nearly to the day. Stay tuned.
----
Q: Dr. K - Does the Grayscale ETHE stock mimic ETH price well enough to consider as a worthy proxy? Or just pass on it.
A: ETHE premiums have widely varied which affects the way ETHE correlates to ETH. When premiums peak, sometimes well beyond 200-300% premiums, ETHE tends to greatly underperform ETH. Likewise, when ETHE premiums have trended below 50-100% which is historically below the average for ETHE, then ETHE often outperforms ETH.