
In 1998 Wall Street bailed out the hedge fund Long Term Capital.
In 2008 central banks bailed out Wall Street.
Both times, the market crashed. The NASDAQ Composite lost -33% in 1998 and about -50% in 2008.
Fast forward to today. With interest rates near all-time lows in the HISTORY of the United States, who's going to bail out the central banks?
Bubbles do not deflate gently. All bubbles burst. The sovereign debt QE bubble may be the mother of all bubbles.
But do not fear. Members of VOSI reaped substantial profits during major market corrections with the Market Direction Model such as in 2010 and 2011, the two years since 2009 where the S&P 500 had corrections at or close to -20%.
Meanwhile, the VIX Volatility Model (VVM) has shown in backtests significant profits during such periods as well as during other periods such as during the first quarter of 2016 when the stock market had its worst 10-day start to the year in history.
But if and when the bubble bursts, the Federal Reserve has no room to lower interest rates to jump start the economy. Negative rates over in Japan and Germany have not helped resuscitate their economies. In all other past cases, the Fed had plenty of room to reduce interest rates. This time *is* different. Thus, it comes as no surprise that the Fed has felt obligated to hike rates twice, a token 25 basis points each time.
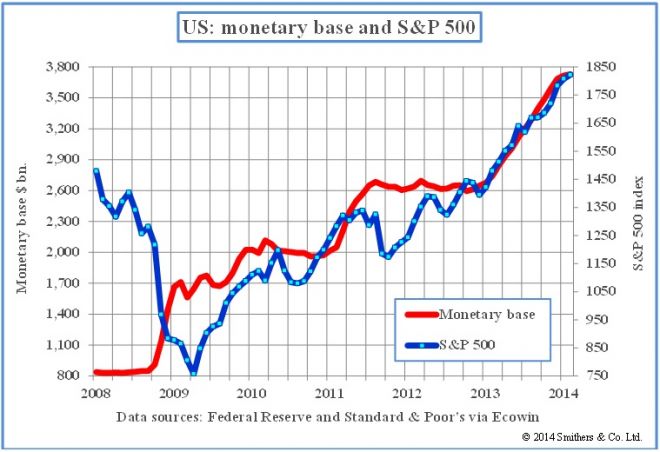
The S&P 500 and the monetary base shown in the chart below both shot higher via QE. As you can see, they are closely correlated. What happens when the monetary base declines as QE is unwound by further interest rate hikes?
Yellen said they intend to hike three more times in 2017. While rate hikes normally should not cause market crashes, the Federal Reserve has a long history of hiking rates after major market bubbles have formed. Such situations are highly abnormal but artificially induced by wrongheaded policies. Each time, a monumental crash has been the result.
The VIX Volatility Model (VVM) can protect one's trading capital and also profit immensely during such dire times if the backtested results shown in 1987, 2000-2002, and 2008 are any guides. 2010, 2011, and 2015 were also such hugely profitable periods for the VVM. Keep in mind that when it comes to all trading strategies, any real-time results can never guarantee continued future performance as market conditions can change. The key for any strategy is to stay in sync with any material changes in market behavior. Strategies must learn to evolve to stay in sync.
But first, a bit of history...
The three best decades for stock markets were the 1920s, the 1980s, and the 1990s. The Fed left gargantuan footprints in the form of market crashes each time they tried to slow markets.
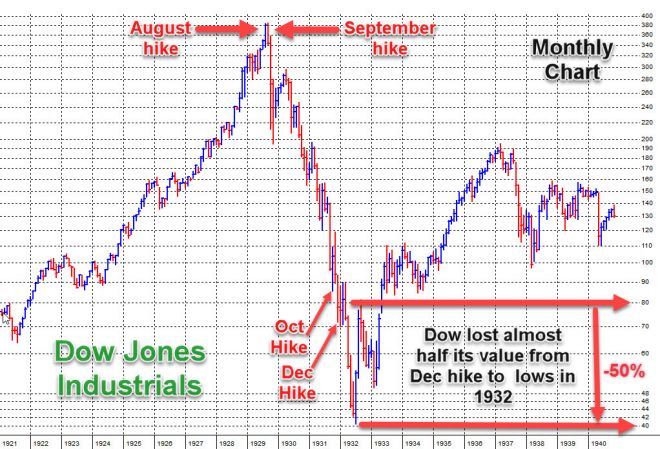
The 1920s
The 1920s came to be known as the roaring 20s. In the monthly chart below, the Fed stepped in and hiked the discount rate from 5% to 5.75% in August 1929 and from 5.75% to 6% in September 1929 to slow the markets which spurred on the great crash of October 1929. As markets unraveled, the Fed lowered the discount rate but then hiked it prematurely in October and December of 1931. The Dow Industrials lost close to half its value from December 1931 to its low in July 1932. Peak-to-trough, the Dow lost about nine-tenths of its value, -89.5% to be exact.
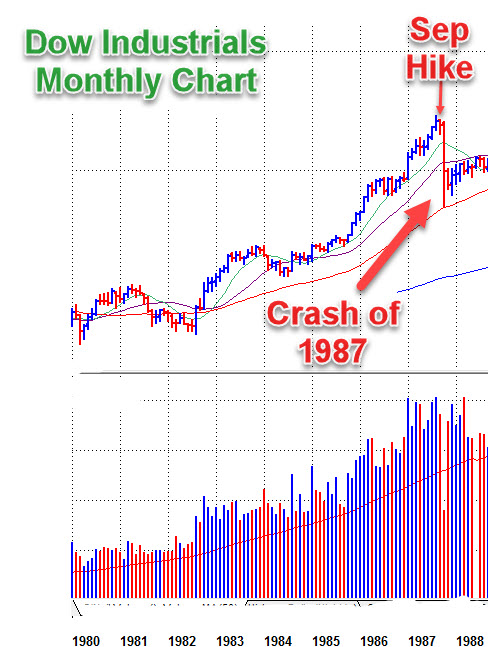
The 1980s
The Fed then repeated their mistakes in the 1980s. The Fed hiked the discount rate from 5.5% to 6% in September 1987. This spurred on the crash of October 1987 where the Dow lost -39.3% peak-to-trough in less than a month after the hike.
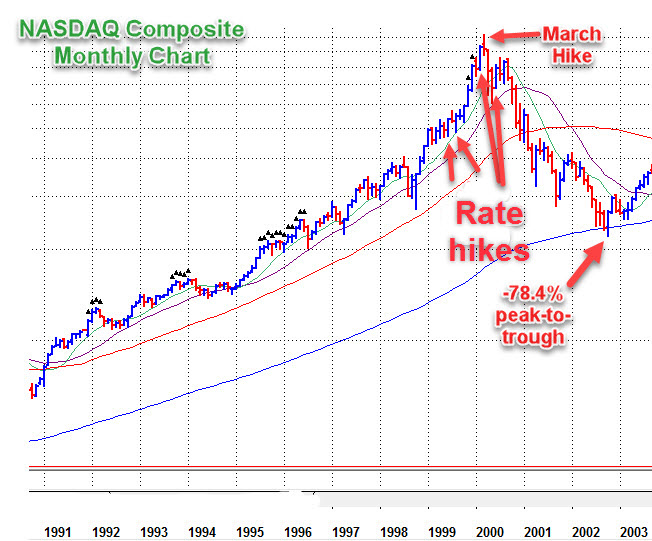
The 1990s
Then in the 1990s, to slow skyrocketing markets, the Fed hiked the discount rate from 4.5% to 4.75% in August of 1999, from 4.75% to 5% in November of 1999, from 5% to 5.25% in February of 2000, from 5.25% to 5.5% in March of 2000, then finally from 5.5% to 6% in May 2000 which was the last nail in the coffin.
Well slow markets did, with the NASDAQ Composite suffering its worst peak-to-trough decline in its history as it lost more than three-quarters of its value, or -78.4% to be precise, from March 2000 to October 2002.
The Present Day
The Fed hiked rates last December 2015 which was the first time since 2006. At the time of this writing, CME FedWatch puts the odds of a hike at 98.6% when their meeting concludes on December 14. Will this second hike, when it happens, repeat what happened in 1931 when the Fed hiked twice? Or will it take a third hike as it did in 2000?
Perhaps they will try to reverse any rate hikes and launch QE 4 to avert a major crash. But that seems unlikely as the Fed seems all out of bullets having painted themselves into a corner, and negative rates have done nothing to improve the economy in those countries such as Germany and Japan.
In the figure below, the top three charts show that stock markets in Europe, India, and China topped in 2014 and early 2015. Meanwhile, the chart on the bottom shows the S&P 500 at new highs. This spectacular ongoing divergence between the US market and global markets begs the question whether the US market will pull up global markets, or whether global markets will pull down the US market.
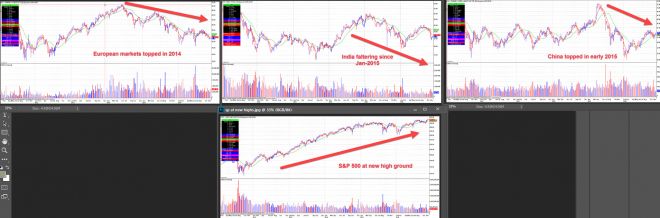
Unfortunately, the latter is far more likely given the ongoing and deepening troubles within the European banking sector which has further sparked the potential breakup of the EU. Further, global economic woes are not on the mend but getting worse.
Soft landings have never been achieved when the Federal Reserve has tried to reverse major market bubbles by hiking rates. Rather, a market crash has been the result.
The current bubbles make the 1920s, 1980s, and 1990s look small by comparison. That's not to say with certainty that the market will crash. The Trump factor with no congressional gridlock means his market-friendly policies could potentially offset a market crash, but a bear market could still be in the cards. A real bear would be the equivalent of hitting the reset button, clearing the decks so a new, genuine bull market can take place.
Nevertheless, should some significant correction take hold, both the Market Direction Model (MDM) in real-time and the VIX Volatility Model (VVM) in backtests have made huge gains going back multiple cycles by capitalizing on major corrections.
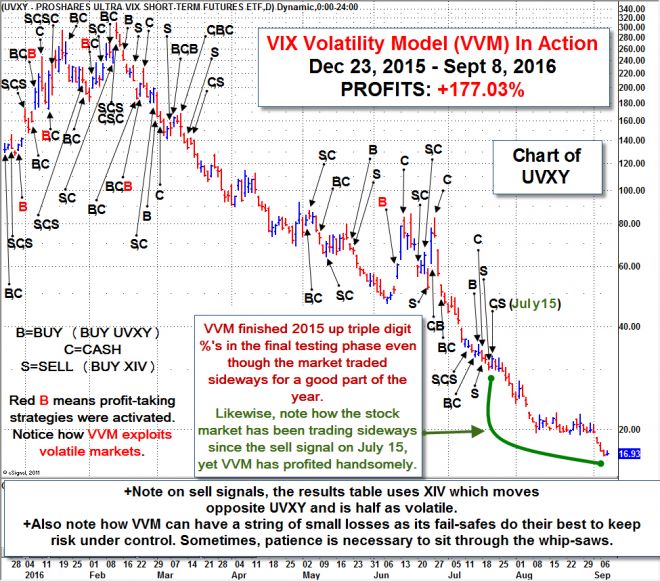
That said, the testing phase for the VVM has not been without its growing pains as the fail-safes needed to be fine-tuned, profit taking strategies implemented, and the VIX spiking strategy added. This is a key reason I've always had an open-door policy when it comes to sharing my strategies. Constructive feedback often helps the strategy evolve that much faster.
In the chart below, the July 15 sell signal resulted in a net gain of +17.16%. On 9/8/16, the gain from this signal was approaching +40%. We emailed members on that day (see time-stamped report archives) suggesting they take at least partial profits at this much higher level. After 9/8/16, highly aberrant market conditions brought the largest backtested drawdown to the VVM since 2009. This drawdown was a blessing in disguise as I uncovered an additional way to materially improve VVM's performance, not just to counter such unusual conditions but to also further boost profits while reducing risk in prior market cycles.
So while our VIX Volatility Model (VVM) was up as much as +177.03% in 2016. after further debugging and improvements to the algo, it is up almost +15% in 2017 (as of 1-13-17).
In conducting research, some adjustments which seem obvious in hindsight may be overlooked until testing is done in real-time which brings the model's algorithms to life. Indeed, all the effort can pay off handsomely. We are excited to see what 2017 holds in store for the markets as a number of serious monetary, political, and economic headwinds that engage with the stock market can mean big profits. And of course, should markets continue higher, there will be windows of opportunity to profit as we demonstrated even in a tough year such as 2016.
Peace and prosperity in 2017 to all.
Note: An interactive discount rate chart from 1914-1969 can be viewed here: https://fred.stlouisfed.org/series/M13009USM156NNBR