
Market Lab Report / Dr. K's Crypto-Corner
by Dr. Chris Kacher
The Metaversal Bear Market
I titled the last chapter in our first book for Wiley & Sons “How We Made 18,000% in the Stock Market” which became a bestseller, “Trading is Life; Life is Trading”. I would update it now to read “The Metaverse is Life; Life is the Metaverse”. Even Metaverses can have bear markets. Indeed, two of the leading Metaverse cryptocurrencies Decentraland (MANA) and Sandbox (SAND) are off around -70% from their peaks in late 2021 despite whale activity showing accumulation. Nevertheless, their upside potential once the weight of the market falls away remains massive. Remember that even leading stocks and cryptocurrencies tend to suffer great corrections in bear markets. In 2018, even the leading crypto ETH lost -95% of its value. This means it has to rise by 20-fold to get back to breakeven.Is Crypto in a Bear Market or Intermediate Correction?
That said, the burning question is whether crypto has entered into a full blown bear market or is instead in an intermediate correction. I made the following two charts last week when the NASDAQ Composite had made a low of 13094, or -19.2% off peak. Since then, it has staged a weak bounce. Powell gets nervous and often reverses his stance when the majors hit -20%. But this time, inflation is soaring so he can do little but continue to taper until March then force rate hikes at the peril of the markets. He is behind the curve. Inflation also has a long tail meaning it tends to persist at least a couple years after it spikes. Even if inflation stayed at current levels, we are looking at an annualized rate of inflation of 8% for the next 2-3 years. And the real rate of inflation is in reality far higher than 8%. A sobering thought.
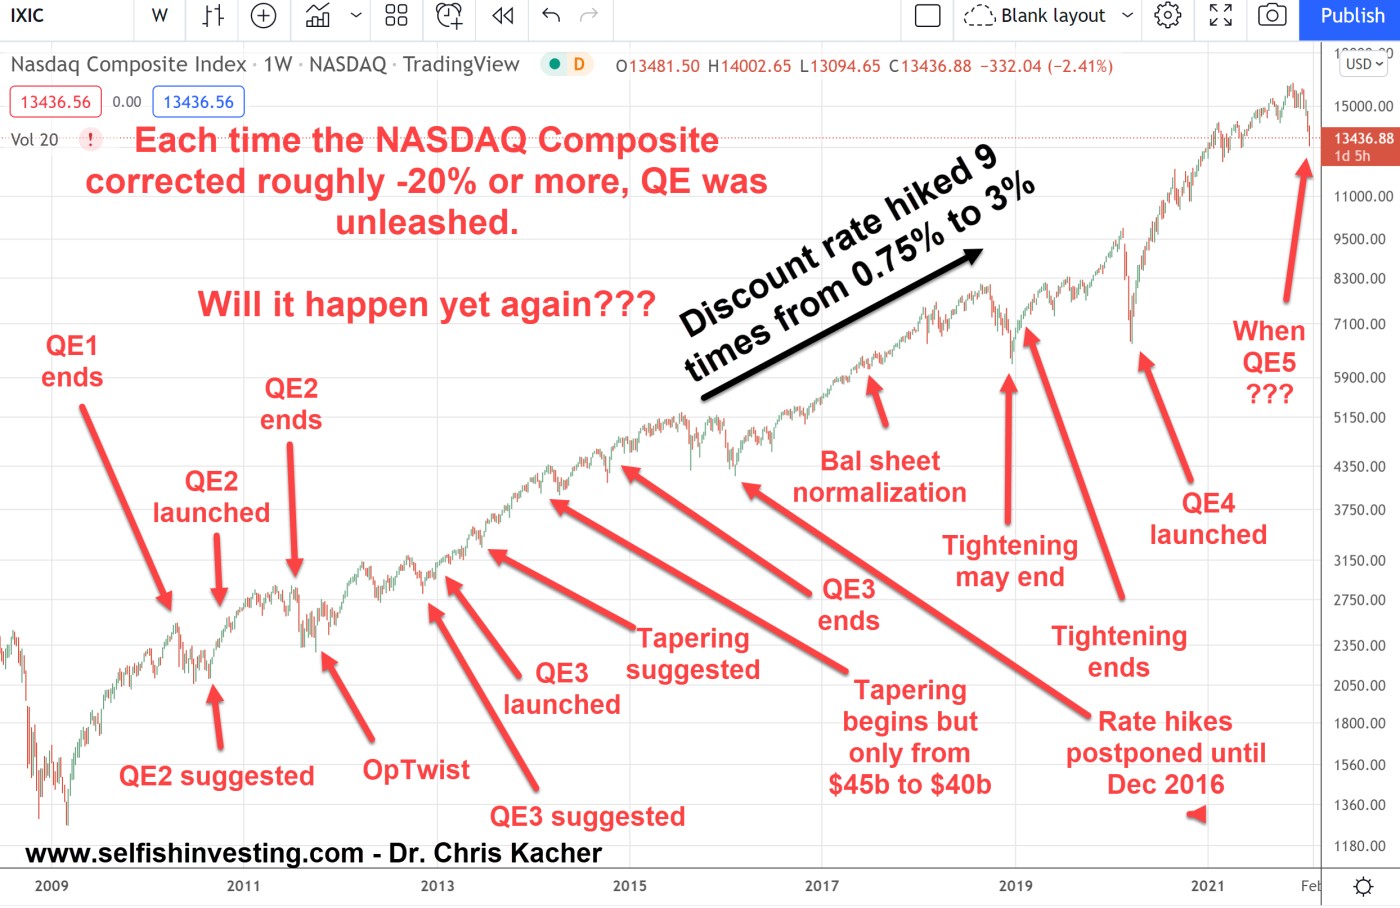
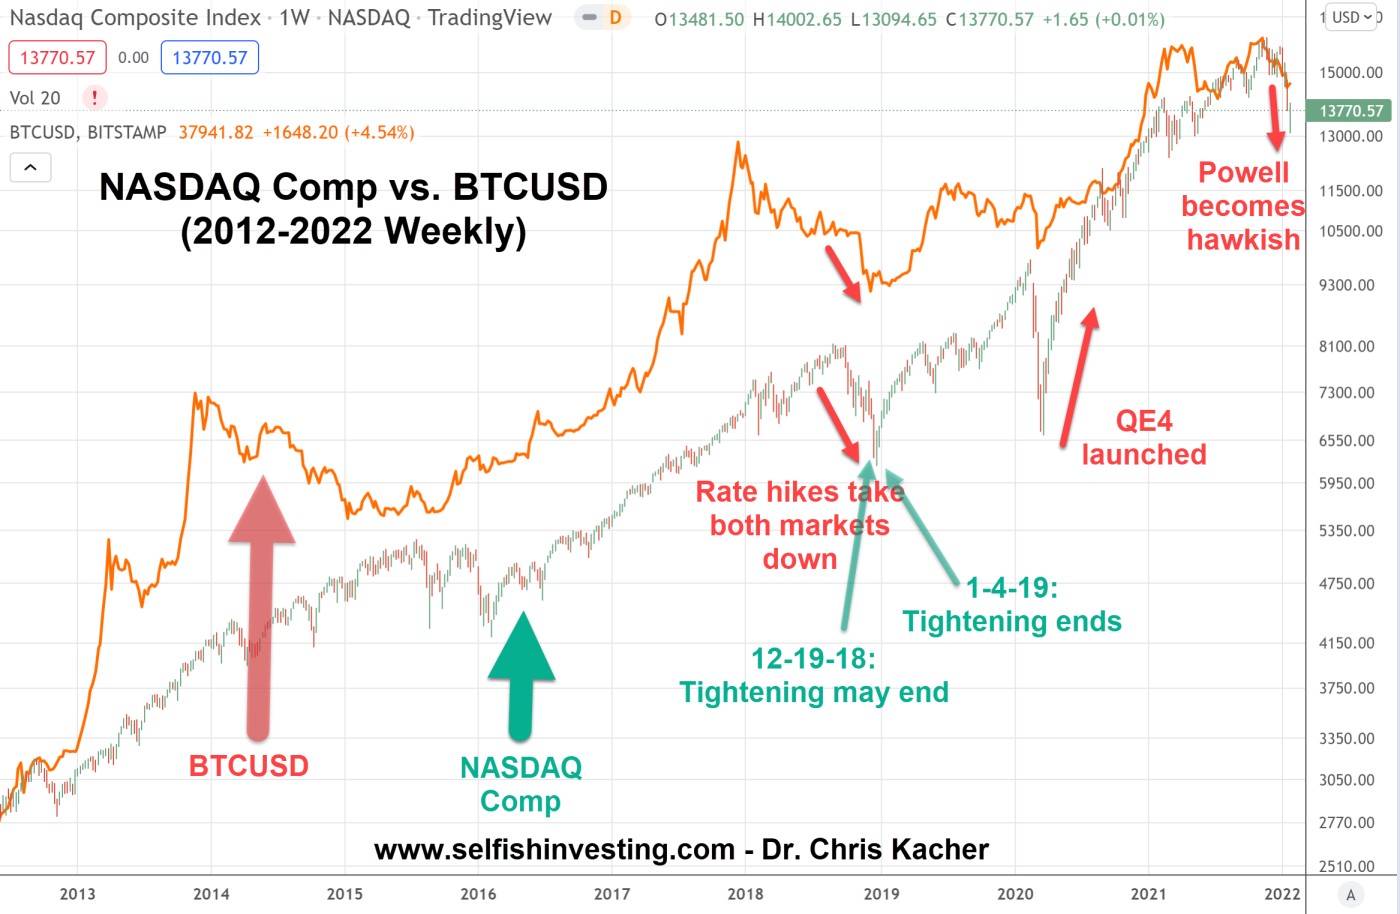
A Brief History of QEYou can see from the two charts below that the NASDAQ Composite has corrected roughly -20% each time QE ended in 2010 and 2011, or tightening from 2017-2018 caused markets to have their first Xmas crash on record. The exception was the COVID-19 crash when it lost about one-third of its value. When major averages have deep corrections, the Federal Reserve steps in and reverses their position, thus QE in some form in unleashed. This means QE either restarts, or tightening ends, or a variant of QE begins.
I made these two charts when the NASDAQ Composite had made a low of 13094, or -19.2% off peak. Since then, it has staged a bounce. Powell gets nervous and often reverses his stance when the majors hit -20%. But this time, inflation is soaring so he can do little but continue to taper until March then force rate hikes at the peril of the markets. He is behind the curve. Inflation also has a long tail meaning it tends to persist at least a couple years after it spikes. Even if inflation stayed at current levels, we are looking at an annualized rate of inflation of 8% for the next 2-3 years. And the real rate of inflation is in reality far higher than 8% which is crippling to the middle and lower classes. A sobering thought.
You can see from the charts that the NASDAQ Composite has corrected roughly -20% each time QE ended in 2010 and 2011, or tightening from 2017-2018 caused markets to have their first Xmas crash on record. The exception was the COVID-19 crash when it lost about one-third of its value.
Each time QE ended, the stock market struggled. The only time there was some headroom was from 2015 to 2018 when the discount rate was hiked 9 times as the balance sheet was normalized. Interestingly, the NASDAQ Composite fell by a hair less than -20% in 2016. But inflation was tame and debt was far less. Nevertheless, in late 2018, the markets finally gave it up. Powell immediately made a statement in late Dec-2018 suggesting that tightening may end. That was the market low.
Other major market lows were formed when QE2 and QE3 was suggested, Operation Twist began, and QE4 was launched. The question remains when will QE5 begin? And given that inflation and debt are far more onerous now than ever before, will markets find a major low once Powell announces some form of QE5, or will waning confidence in the Fed vanish altogether causing further selling? Since COVID-19 which crashed the markets in Mar-2020, the Federal Reserve has printed more money than in all the prior years combined.
Crypto vs. Zero or Slowing QE
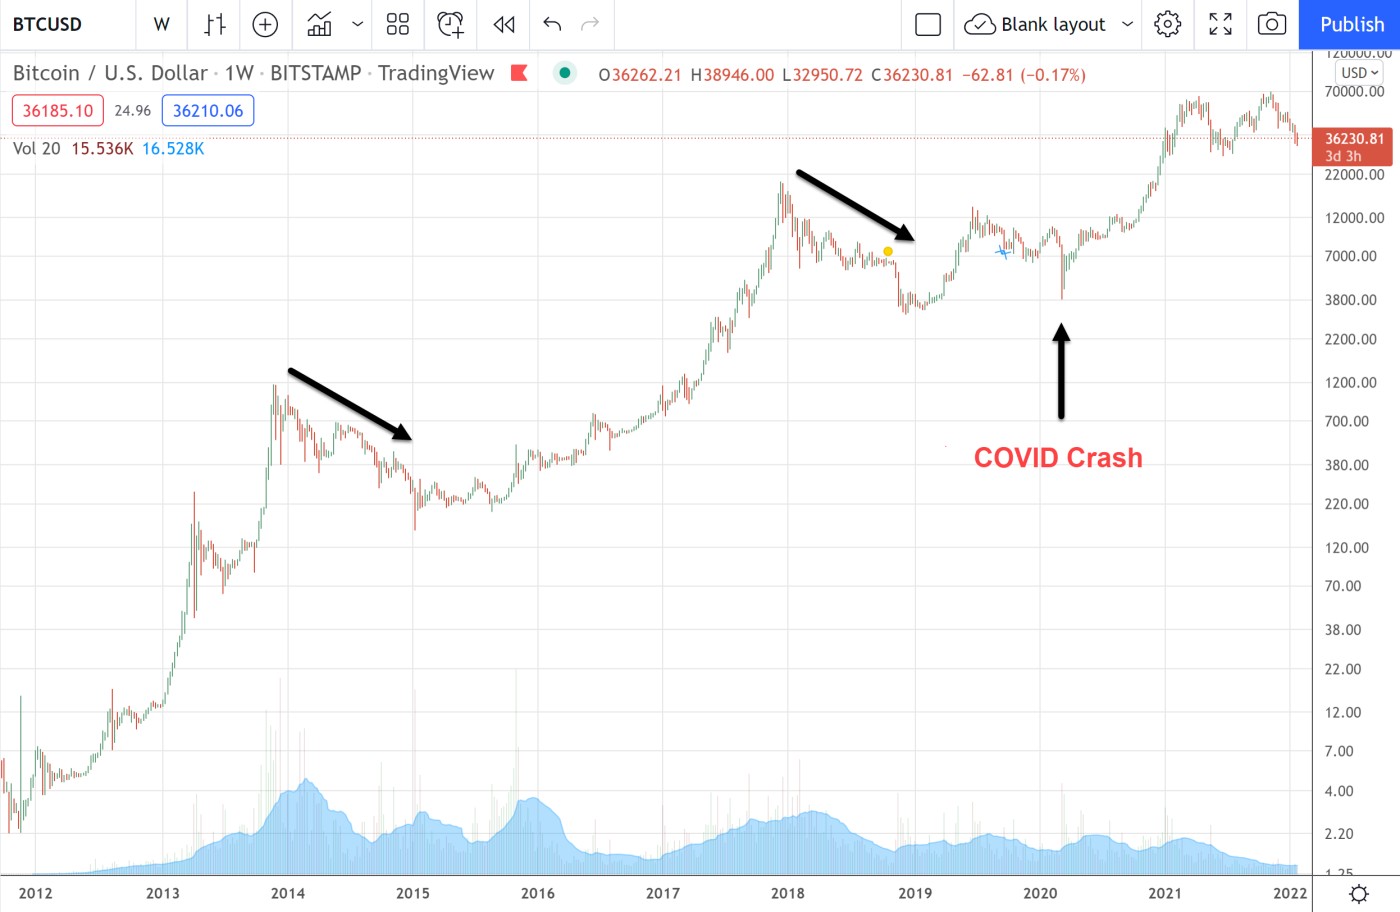
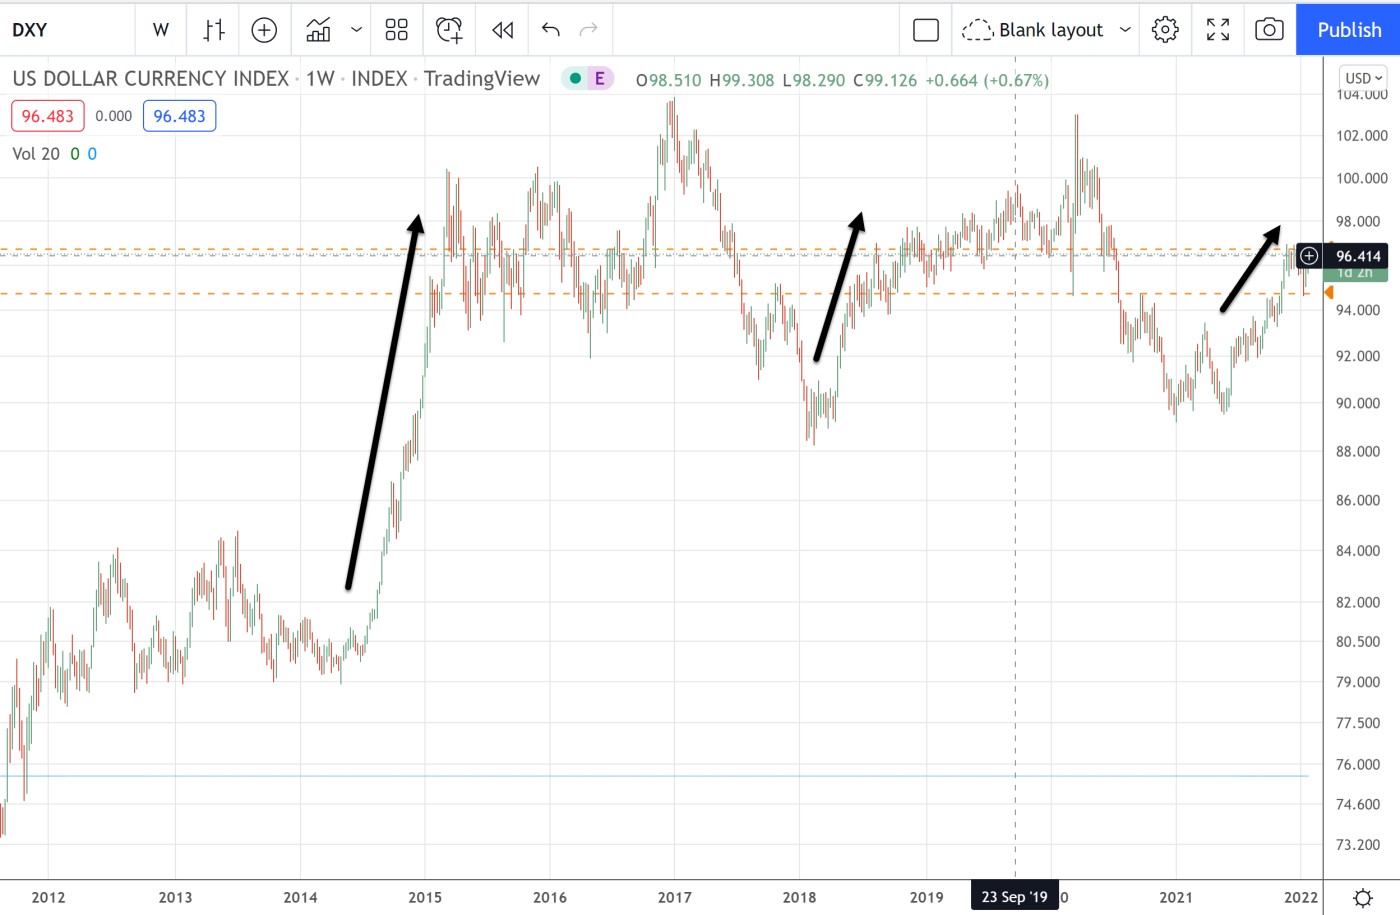
2014 and 2018 were the two big bear markets in crypto. This was due to tapering in 2014 and tightening in 2018. In consequence, the U.S. dollar had strong uptrends. Should the uptrend in the dollar continue due to an expected 4 rate hikes for 2022, crypto is likely to continue its downtrend. Note that the Fed had room to tighten between 2016-2018 so the dollar was in an uptrend but crypto held strong, trading roughly sideways. This was due to headroom with respect to low inflation thus markets were not rattled.
vs. U.S. Dollar
Talking Heads
I’ve been critical of most of the stock and crypto talking heads with massive followings on YouTube, FOX, and CNBC when it comes to cryptocurrencies and stocks. Yes, both Gil and I used to give regular interviews on various platforms but we realized the cost/benefit did not compute. Trading time, research, and publishing is more precious. That said, there are a few crypto YouTubers that deserve their huge followings because they bring material value to the investment space.
In any event, most of the crypto talking heads keep most if not all of their crypto holdings since the downturn in late 2021. Every bounce is met with signs of victory. Yet in reality, the Fed maintained its hawkish stance despite others saying they are being dovish since the popular interpretation was that they thought Powell implied may be no rate hike in March. This was a wholly false interpretation.
I gave my first of multiple warnings on Dec 17, 2021 with my report titled "Global Tightening Afoot" since the Fed removed the word “transitory”. I’ve always said don’t fight the Fed. I’ve also said the trend if your friend until the end when it bends. Well, it bent back in December.
I also wrote that metrics can look bullish pointing to a continuation of the crypto bull market, but price/volume is the final judge so position your portfolio accordingly. I not only sold to cash taking profits in my gaming cryptos in early Dec-2021 which had nicely bucked the trend against a falling bitcoin, as well as advised members to take profits in the Crypto Picks list on Jan 5, 2022, but I went short crypto in early Jan-2022.
As markets cratered, talking heads were finding reasons such as the bullish metrics to justify buying the dip, but oversold usually becomes more oversold in such situations. This is how massive amounts of investment capital are lost. Anyone remember stocks in 2000-2002, 2008, and crypto in 2014, 2018? These were critical times when I took my whole portfolio to cash. Don’t catch falling knives.
As an audit from big four auditor KPMG as well as in-house and tax returns show:
STOCKS
=Mar-2000: After 6 years in a row of triple digit percentage returns, I sold all my stocks 3 days off the market peak. I stayed in cash until Mar-2003, three years later, over which time, the NASDAQ Composite lost -78% peak-to-trough.
=My Market Direction Model (MDM) has profited off every major crash in stocks. It went short the market before the crashes of late-2008 and Mar-2020. MDM scored profits of +100.5% from Apr-2000 to Dec 31, 2002 on no leverage, +28.81% from 9-4-08 to 10-10-08 on no leverage, and +37.29% from 3-5-20 to 4-22-20 with benchmark 3x ETF TECL.
CRYPTO
=I went to cash in early 2014 after bitcoin's climax top along with bearish metrics, then bought back in Jan-2015 on the oversold collapse in price.
=I went to cash in Jan-2018 due to bitcoin having topped, price/volume breaking down in bitcoin, and bearish metrics, then bought back on Mar 18, 2019. I was able to make double digit percentage returns in 2018 because my altcoins climax topped in Jan-2018. PwC showed the average crypto hedge fund lost -54%, more than half their NAVs in 2018! Timing is everything.
=I most recently went to cash in Dec-2021. I then went short crypto in early Jan-2022. I've since covered my position the weekend of Jan 21-23 where I wait the next favorable entry at the time of this writing.
So the theme in my trading since the 1990s is buying aggressively when conditions are favorable as demonstrated by price/volume action, then going to 100% cash (with the exception of any core long-term holdings in BTC and ETH) when conditions are poor as demonstrated by price/volume action.
I am monitoring markets closely as always for the next entry points. Stay tuned.