
Dr. K's Crypto-Corner
by Dr. Chris Kacher
Riding the Revolutionary Rocket with Cryptotechnologies... Entirely Evolutionary™
Awestruck Ag Au
It should come as no surprise that after nearly a decade of noisy non-action in both gold and silver, we found ourselves issuing reports to members as both staged strong pocket pivot buy points earlier this year.
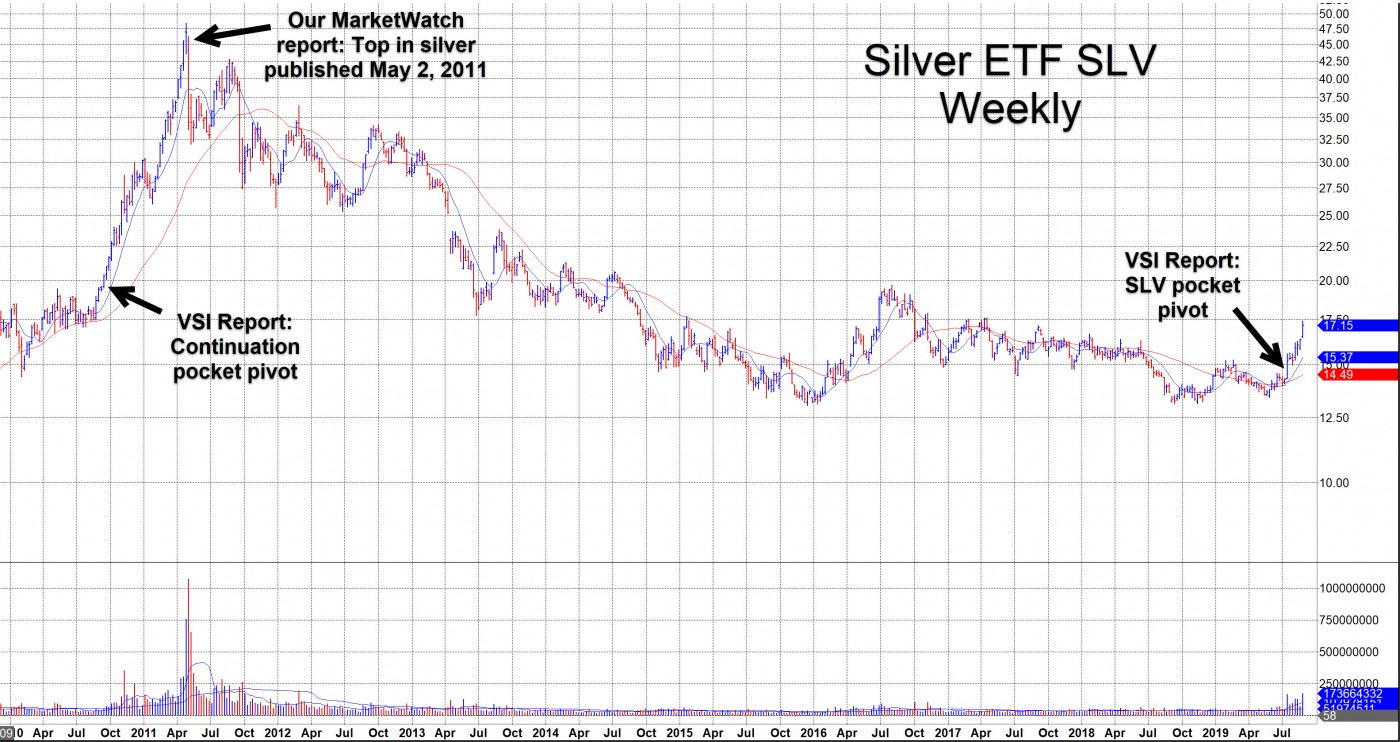
Back in 2010, we identified various buy points in both gold and silver in reports such as this one. Then in 2011 when both silver and gold were undergoing furious advances in some of the sharpest uptrends seen since the 1970s, we published this report on MarketWatch on May 2, 2011 advising readers to sell silver. Silver was undergoing a climax top so getting the report published on May 2 was key as we felt its climax top was about to come to an abrupt end. As so happened, May 2 was one day off the top in silver. This was not based whatsoever on "rocket science" but on simple chart reading.
Since 2011, buy points in gold and silver ETFs have been nearly non-existent. But finally, on May 14, 2019, we issued this report on the gold ETF GLD as it had a major pocket pivot. That was followed by July 16, 2019 when we issued this report as the silver ETF SLV had its first major pocket pivot in years.
There Are No Coincidences
One might ask why after all this time both precious metals find themselves in legitimate uptrends. Both metals hold their value in times of crisis so are considered fear trades. Bitcoin too as the correlation between its rise in price and various global crises can be seen in this report. Of course, there are other major tailwinds that have propelled the price in bitcoin from an average price of $0.001 back in 2009 to more than $10,000 today. Said another way, if you invested $1 in bitcoin in 2009, your investment would be worth more than $10 million today. Nothing in the history of speculation even comes close over its decade-long lifespan.
QExplosion
But perhaps the mother of all global crises is one that has been brewing since late 2008. While profits leading up to the great crash of 2008 were privatized, losses were socialized among all the taxpayers. Then to add insult to injury, the greatest legalized Ponzi scheme was launched. No, not bitcoin. XD
The U.S. Federal Reserve started into its quantitative easing (QE) program to save the banks and businesses that were allegedly too big to fail. The printing of money by major governments via QE is the only legalized Ponzi scheme which robs people of their savings as fiat degrades over time. Measured amounts of money printing cause a slow erosion of value in fiat but can co-exist with healthy economies. By contrast, flooding the system with QE hastens the erosion as the value of fiat and thus people's savings can nosedive in some cases. One need not look far as examples abound with the most famous being hyperinflation in 1920s Germany and in recent times, Venezuela and Argentina.
Meanwhile, bitcoin is a tool for freeing humanity from this Ponzi scheme, freeing people from government control over their savings, freeing people from oligarchs and tyrants, all the while dressed up as a Ponzi scheme.
Yield Curve Inversion
The recent inversion of the yield curve (not shown in the graph below) does not guarantee recession as since 1955, it has inverted twice without being followed by a recession as shown in the chart below. In other words, it has predicted 9 out of the last 7 recessions.
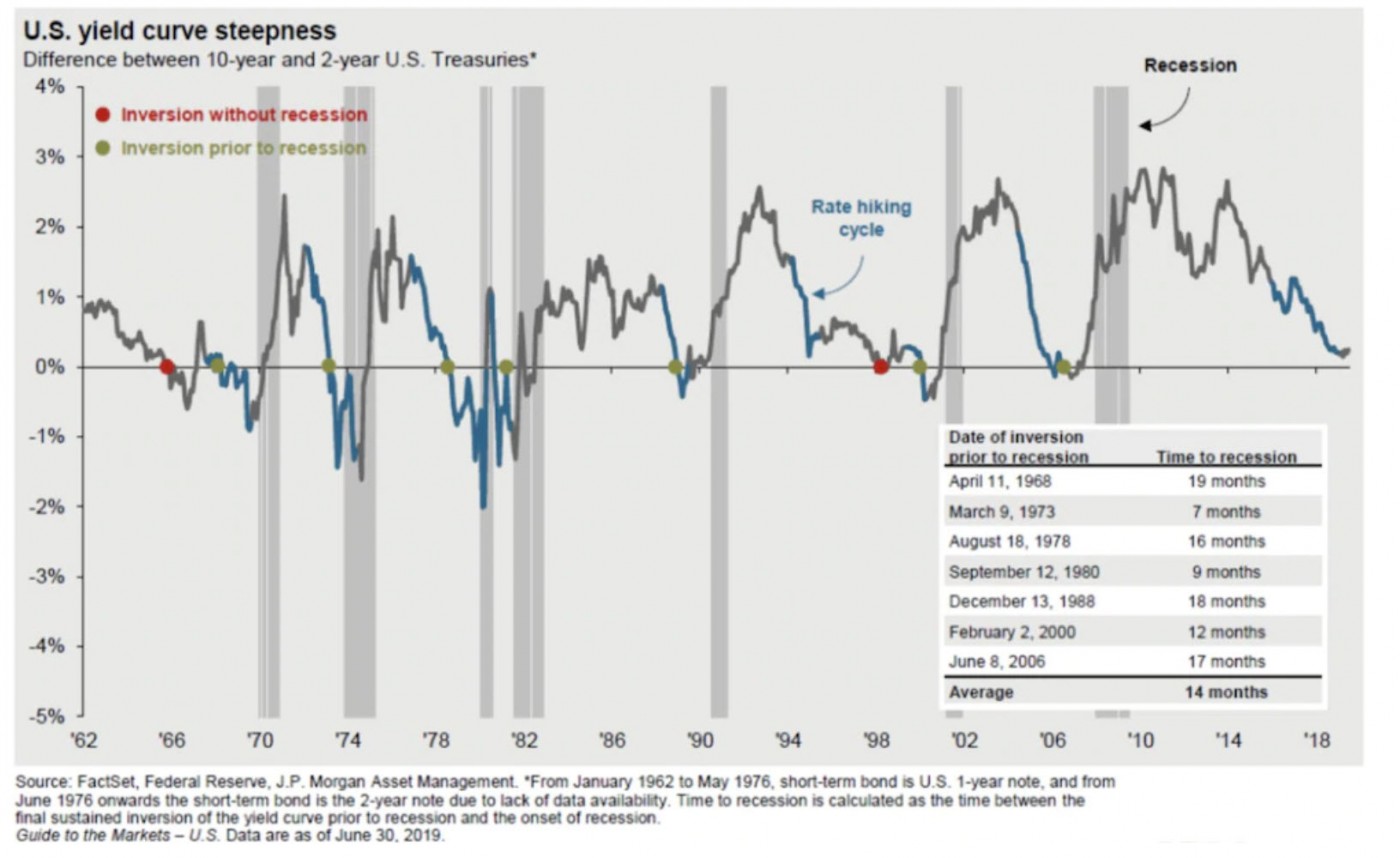
As I have written in prior reports, QE makes today's markets different as we have seen since 2009, thus indicators that were reliable predictors in past cycles are failing today. The recent inversion of the yield curve between the 2- and 10-year notes is a reflection of the loss of investor confidence in the short term as governments continue to print record levels of money, thus capital flows into longer term bonds pushing their yields lower. Further, since now more than $17 trillion in shorter duration bonds offer negative yields (an increase of $3 trillion in the month of August alone!), capital escapes into longer duration bonds, stocks, and hard assets. Yes, the system of global capital is being flooded with QE with no signs of slowing.
1930s = 2010s ?
All of the following happened in the 1930s and in today's world:
1) Both the short-term and long-term debt cycles in three of the world's major reserve currencies are coming to an end. 2) Government tax revenues are insufficient to cover the major debt and non-debt obligations such as healthcare and pensions.
3) Record levels of populism where large wealth and political gaps are producing political conflicts around the planet between the rich and the poor, between capitalists and socialists.
4) The rise of an emerging power, China, is challenging the existing world power, the U.S., which based on growth trends could lead to a change in the world order.
5) The expected returns of more than $17 trillion in bonds is below that of cash.
Why QE May Fail
We are in the late stages of the long term debt cycle which typically runs roughly for 70-80 years.
1) The power of central banks to stimulate economies has eroded considerably because interest rates can only go so low. Countries such as Germany, Japan, and Switzerland are in negative rate territory.
2) Buying assets with printed money eventually fails to produce any real productivity as the capital stays in the hands of investors rather than benefit the economy. Real profits are thus diminished. Meanwhile...
3) Debt keeps piling up. Without adequate profits and tax revenues, governments may default on their debt obligations such as with the massive healthcare and pension platforms.
The recent spate of global crises spurred by economic and political tensions only adds volatility and uncertainty to where the world sits. Thus as major tipping points concerning interest rates, debt, and econopolitical tensions are hit, precious metals are the beneficiaries not to mention bitcoin and various hard assets. This further exacerbates populist tensions between the haves and have-nots as the wealth gap is widened.
Long Term Favorites
While markets can change on a dime as many variables play a role, the equivalences between the 1930s and today's world shows some of these trends can continue. QE has a limited lifespan but could continue for yet at least another couple of years if not longer. Meanwhile, rates go lower. Stanley Druckenmiller among other notables have placed big bets that the Fed will have no choice but to lower rates all the way down to 0%. That is only eight 25-basis point rate reductions away as the current target rate stands at 200-225 bps.
I believe the following instruments offer the most upside over the next year or longer:
1) Bitcoin (BTC) / Grayscale GBTC
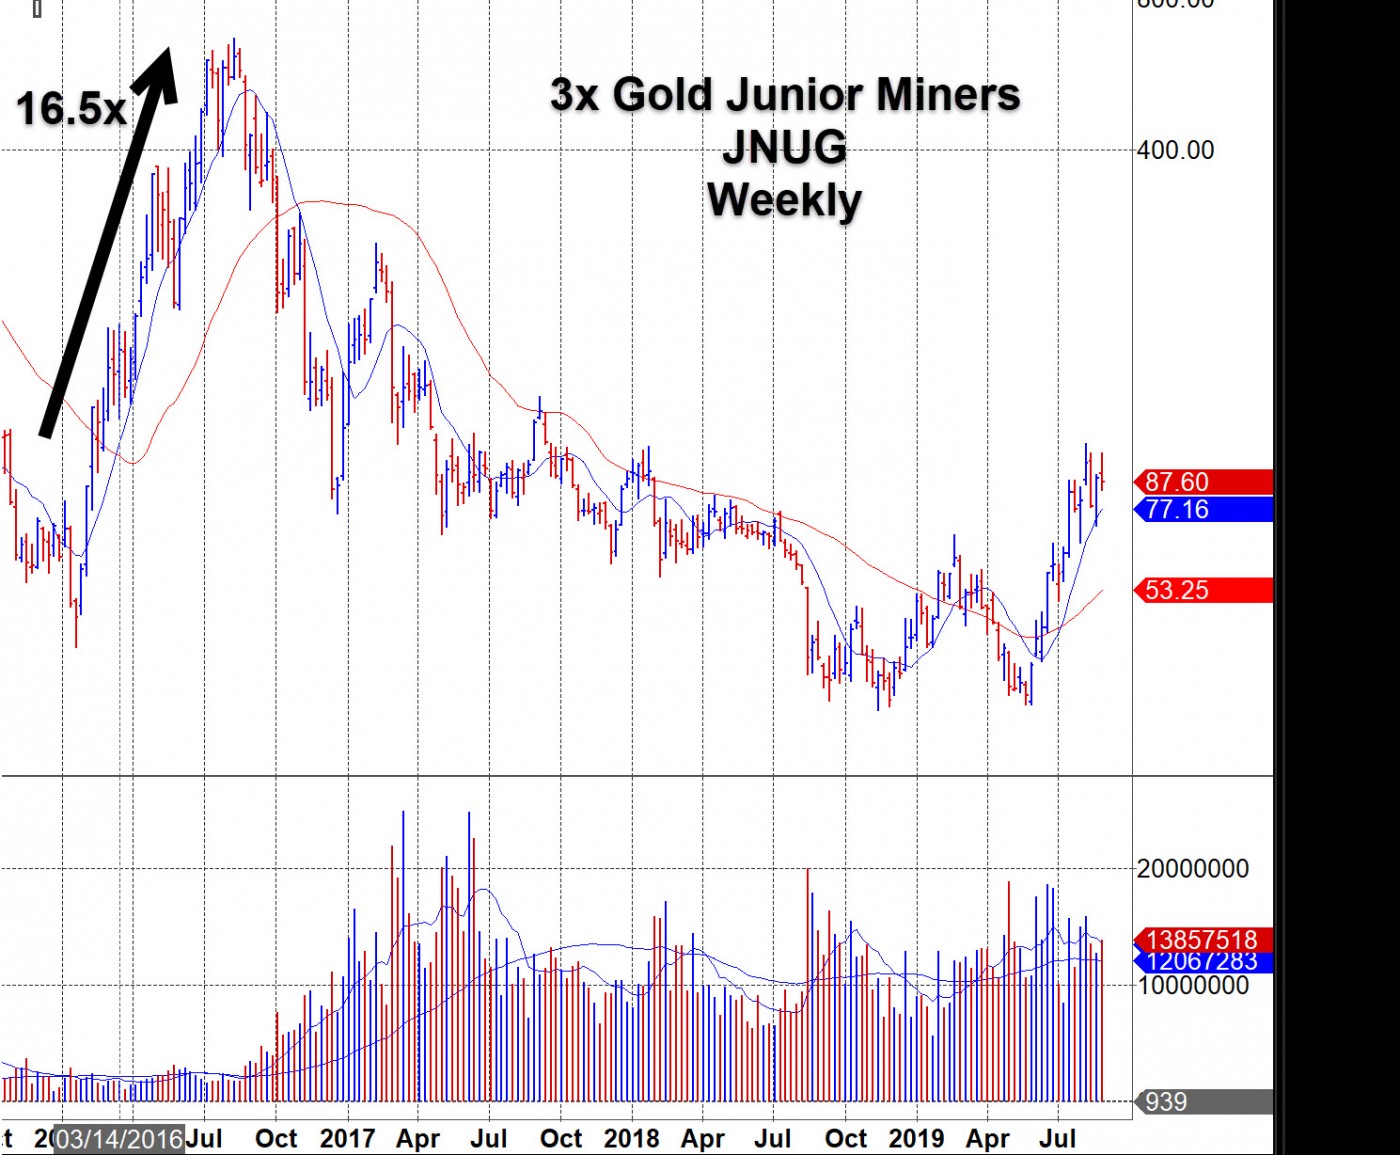
2) JNUG (3x junior gold miners)
3) USLV (3x silver ETF)
Keep in mind that only bitcoin does not degrade in sideways markets unlike 2x and 3x ETFs [as I wrote HERE]. In fact, in the digital world, the upside is so large that there's almost no such thing as risk for those instruments such as bitcoin which is nearly unstoppable save for devastation of the planet via nuclear war. Courts could not dismantle illegal peer-to-peer file sharing which is also decentralized and owned by no one. Bitcoin is no different. Even when a government such as Venezuela bans bitcoin, it continues to thrive by millions of families seeking to preserve their savings.
As for precious metals, the uptrend in gold that began in October 2018 is likely to persist given QE, recession fears, Brexit, and the trade war. This means silver should continue to play catch up as we have discussed in prior webinars. 3x ETFs will disproportionately benefit. Even when gold went sideways for 4 months in 2016 in the middle of its uptrend as shown in the charts below, JNUG and USLV still outperformed on a greater than 3:1 basis compared to their 1x equivalents. Of course, the 1x junior gold miners ETF GDXJ may be the safer choice in the event gold trades sideways for more than a few months as GDXJ being 1x would not degrade in such an environment.
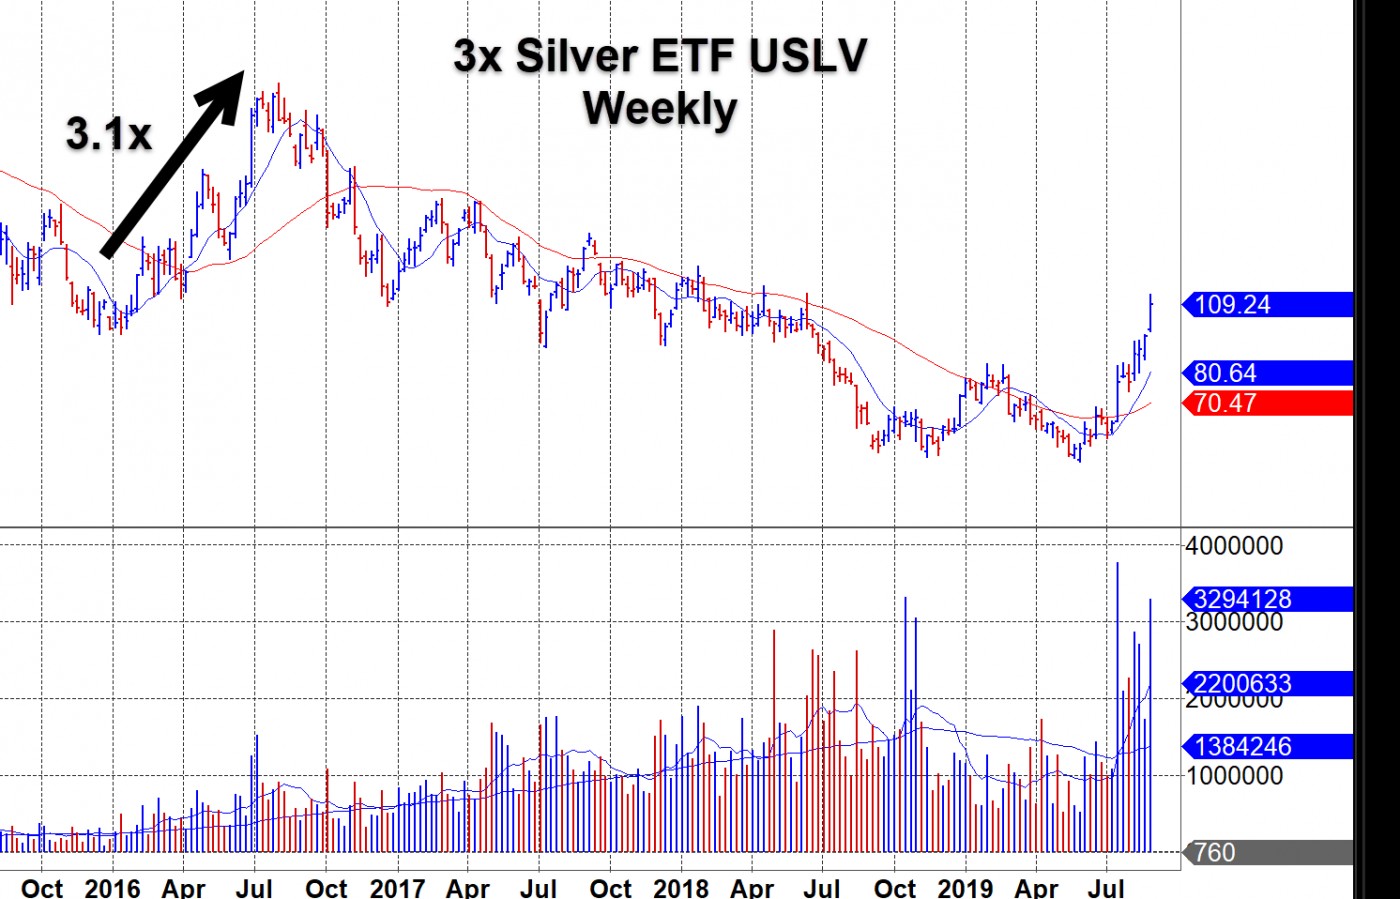
Note how gold went sideways for a brief part of the uptrend in 2016:
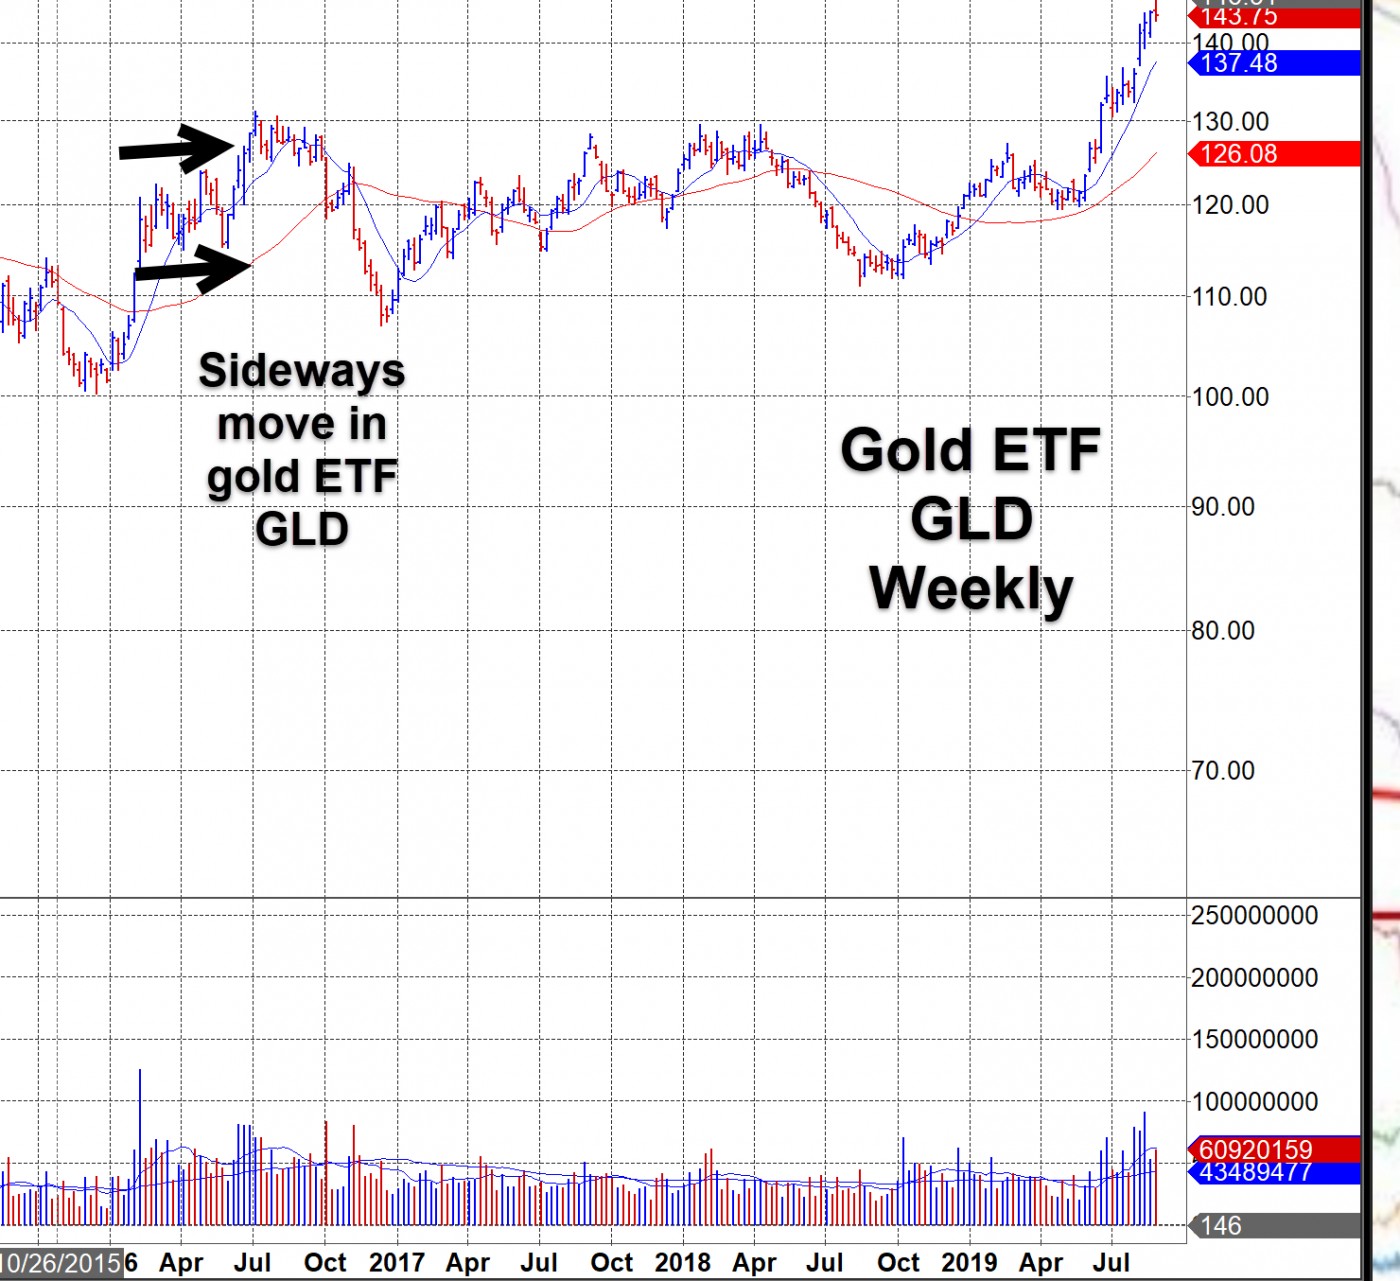
But as noted above, 3x ETF JNUG still managed to hold its own and resume its uptrend while maintaining its outperformance on a better than 3:1 basis against 1x ETF GDXJ.
Keep in mind there are many cross currents to gold which can influence its price, though at the current time, odds favor a continuation of the uptrend which can be sloppy at times as nothing goes up in a straight line so keep stops within your risk tolerance levels, a trading fingerprint which is unique to each investor.