
Focus List Market Barometer
Our Focus List has been used as a market barometer of sorts. The number of stocks on the list tends to reflect the strength of the market environment. More stocks tend to make it through our rigorous screening process in stronger, uptrending markets. Meanwhile, weak markets tend to push stocks into their sell stops.
That said, in weaker markets, the strongest names often hold up fairly well so remain on the list. They are often the ones that outperform when the weight of the market comes off.
Likewise, in stronger markets, stocks that cannot keep up or are slow to start may remain on the list but should take a backseat to those stocks that are outperforming.
To find our Focus List reports, go to our report archives and type in "Focus List" into the keyword search bar:
https://www.virtueofselfishinvesting.com/reports/search?p=1&q=focus%20list&sort=date
Then look for “Focus List” in the title.
Not the Bull Side nor the Bear Side but the Right Side
Sure we could talk about our winning names such as NVDA that we mentioned a number of times including the first mention on April 6, 2016 when it was trading in the mid-30s, then again on May 13, 2016 when it had a buyable gap up. It is also a name that could have been held invoking Dr. K’s 7-week rule as its price never got ahead of itself for the first several weeks after these buy points emerged.
But such names are far and few between. And while brief windows of opportunity have opened at various times each year, allowing us to profit from a number of leading stocks (see report archives), it is far more instructive to discuss names which have offered trading challenges over the last couple of years.
As members who have been with us for at least the last three years know, our approach is fluid as we are neither wedded to the bear nor the bull side of the markets but to the right side. This means remaining fluid in how we think about a stock. For example, ACIA is one such stock we commented on as a potential buy point on our Market Lab Report - VoSI Focus List Review for the Week Ended October 21, 2016.
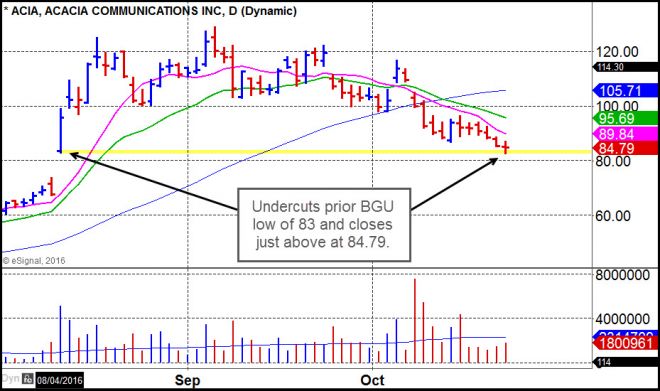
Indeed, the next trading day, it jumped +7.6%. In the context of the overall chart, the stock was still in a downtrend so at least partial profits should have been taken, and stops kept very tight. The market environment has been very unforgiving so taking quick profits when a stock’s price gets ahead of itself has been our suggestion over these years.
Even in the best of markets, market legends such as William O’Neil had at best a 50% success rate. But as Bernard Baruch once said, it’s not the win rate but how you handle your winners that make all the difference. Risk management is key.
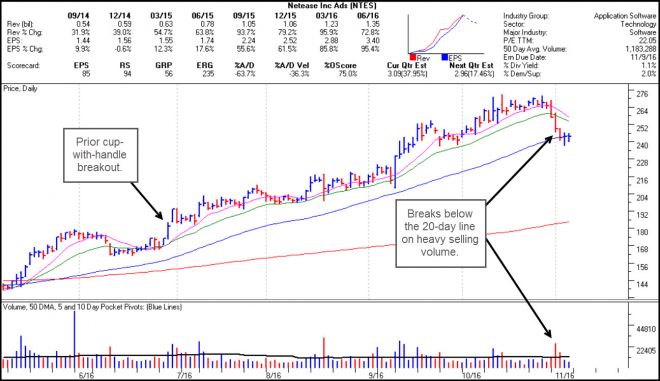
Our guidance has been to buy where risk is low so if the trade fails, you lose just a few percent. In our Market Lab Report - Focus List Review for the Week Ended November 4, 2016, we mentioned how NTES was hanging by a thread at its 50-day moving average. Indeed, NTES proceeded to trade well below its 50-day after a feeble one-day bounce. Thus had one tried to buy shares at its 50-day hoping for a bounce, you got as much as a 5% gain the next day before the stock rolled over. Again, quick partial profits could have been taken, and any remaining position sold as the stock moved below its 50-day once again.
Voodoo (Volume-Dry Up or VDU) Pullbacks
In our Market Lab Report - VoSI Focus List Review for the Week Ended December 9, 2016, we mentioned how TTD was undergoing a volume dry-up (VDU) pullback which is often followed by a bounce. On Dec 12, 2016, the stock mini-gapped higher then finished the day with a pocket pivot.
The beauty of VDU pullbacks is that the stock can be bought when it’s very close to support so your risk is typically less than 2-3%. In the case of TTD, you could have bought on Dec 9, 2016 then sold if it undercut the low of Dec 8, 2016, or a risk of just -1.7% on the trade. TTD immediately proceeded to move higher over the next several days, peaking at a potential profit of +14.4%. Of course, no one sells at the top but when the stock could not continue higher after its breakout on Dec 20, profits could have been taken.
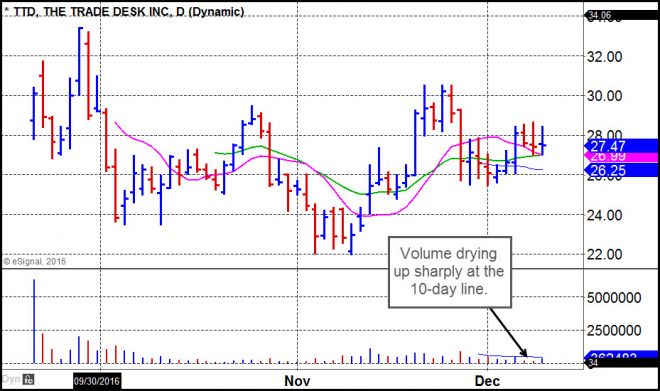
The astute chart reader will notice how TTD had another VDU through Feb 10, 2017 then proceeded to rocket higher from there. In such cases, pocket pivots are often too late to be buying as the risk noticeable increases. We also mention in our Market Lab Report - Focus List Review for the Week Ended January 6, 2017, “TTD and Z have both pulled back into their 50-day moving averages, which would put them in lower-risk entry positions using the 50-day lines as tight selling guides.” Over the next few weeks, TTD proceeded to move higher by +15.1% from its 50-day line.
Z, on the other hand, only went sideways to slightly higher, lagging the general market, thus should have been sold before it broke down below its 50-day. Always sell laggards. You don’t have to wait for them to hit their sell stops. This makes room for stronger stocks whose stock charts might be screaming “Buy Me HERE!”
Jesse Livermore’s Century Mark Rule
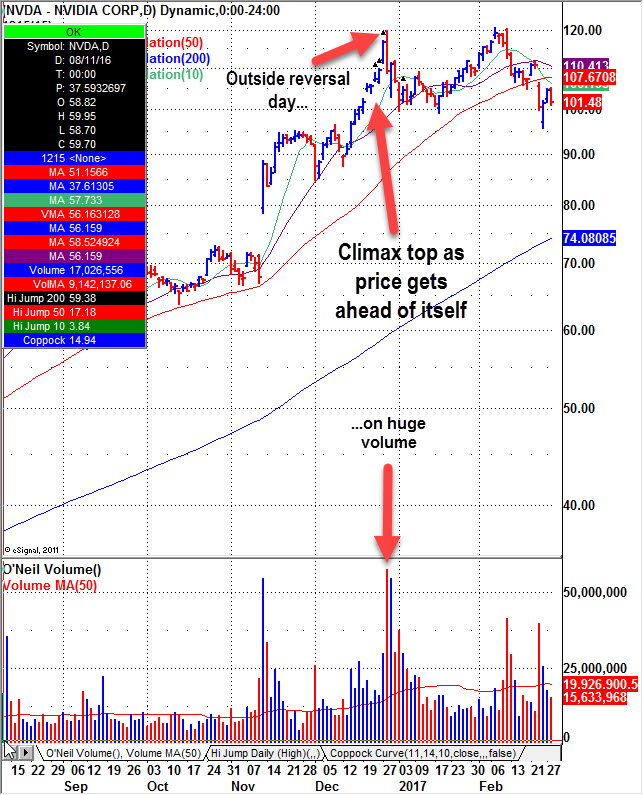
There’s many ways to skin a cat. In our Market Lab Report - Focus List Review for the Week Ended December 16, 2016, we mentioned how NVDA had just pierced its 100 level. NVDA then proceeded to quickly gain nearly +20% over the next several days. Such quick gains suggest a climax top of sorts so one could sell into such moves. Indeed, NVDA finished its peak day appreciably lower, having formed an outside reversal on heavy volume as we discussed here: Market Lab Report - After the Open 12/29/16. Today, this is where NVDA stands:
The clues are there. It’s not rocket science. But it does require finesse in reading the charts. Our FAQs, report archives, and books go into detail on how to develop your "chart eye" so you can significantly boost your profits.
When Price Gets Ahead of Itself, Take Profits
In our Pocket Pivot Review - MYOV 11-23-16 report, we mentioned the pocket pivot in MYOV. The next day MYOV rocketed nearly +20%. Such a huge move should be sold into the strength, if not that day, the very next day when MYOV traded below the prior day’s closing price.
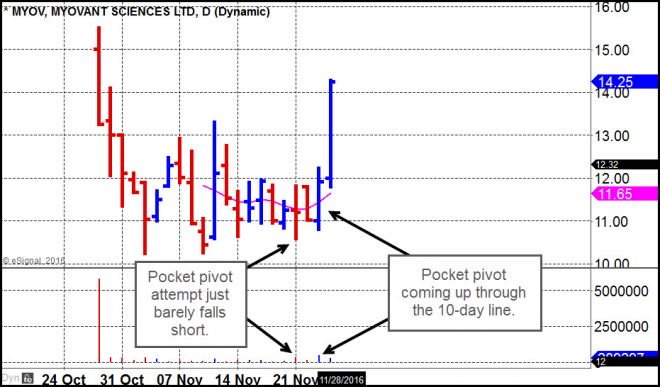
We then repeated this process on Dec 23 and Dec 28, 2016 when MYOV offered two pocket pivots (Pocket Pivot Review - MYOV 12-23-16). MYOV then rose +14.7% on Dec 29, 2016. Again, quick profits should be taken in such a situation.
Earnings Roulette
Looking for price/volume clues ahead of a company reporting earnings is far less reliable than in the years prior to Regulation FD. Consequently, stocks can lose as much as 1/3 of their value or more overnight should earnings disappoint. We suggest assuming a loss of 33% or greater in a stock one holds into earnings. Some rare stocks have lost well over 50% overnight, especially biotechs. Ask yourself if this is a loss your portfolio can handle given your position size in the stock. At least you are then making a calculated decision rather than flying blindly. If you have profit in the stock going into earnings, that can also affect your position size in the stock going into earnings. Here’s an example that went pear-shaped. As we said earlier, it is highly instructive to understand what can go wrong, than what can go right. Risk management is the first most important lesson when it comes to investing your capital.
In our Market Lab Report - Focus List and Pocket Pivot Review for the Week Ended January 20, 2017, YELP was looking reasonably good. But we warned it would report earnings after the close on Feb 9.
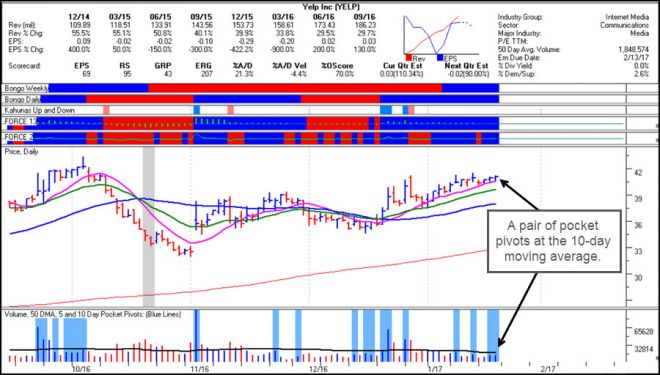
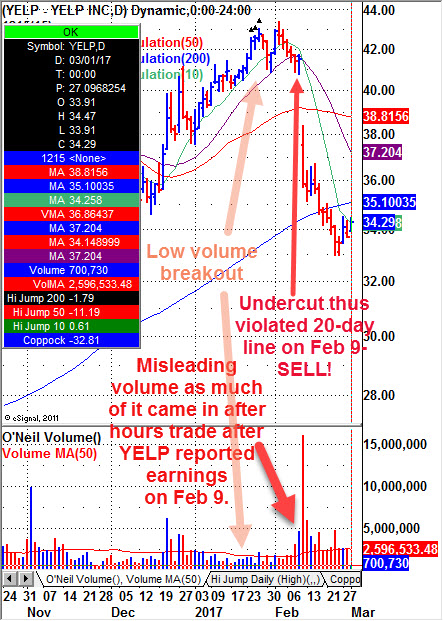
Shortly after we reported on YELP on Jan 20, YELP broke out to new highs but on weak, below average volume then churned on Jan 26 as can be seen in the figure below. YELP continued to stumble around unable to make much progress. It even violated its 10-day moving average at it attempted to get support at its 20-day line. On Feb 9, it undercut the low of Feb 8 when it broke below its 20-day line, a violation of its 20-day line. If you had waited this long to sell, this was yet another clue to sell before earnings were reported after the Feb 9 close.
Note, the volume spike seen on Feb 9 is misleading. It shows the stock closed higher which it did, but the volume spike was due to trading volumes that came after the company reported earnings after the close. In other words, systems such as eSignal and TradeStation all show data that can be misinterpreted by showing the stock closed higher on Feb 9 on big volume.
At any rate, many clues arose to sell the stock prior to earnings as it was unable to keep up with the general market. Indeed, the day it opened for trade after reporting earnings, it gapped lower by -9.5%. As we have always said, when a stock gaps down, sell at the open. Ask questions later. YELP had a minor rally after it opened then sold off to finish the day down -13.6%. It then proceeded to move lower from there.
Nimble Trading – There is the Quick. There is the Dead.
As you can see from the few examples above we have provided, by staying nimble and taking profits when you have them in context with the stock’s chart, one can boost their trading account well into the double digits even assuming a success rate of less than 50%. The key is to keep stops tight. As discussed above, the best way to do this is to buy on constructive weakness such as in the TTD volume dry-up example above, so your exit point is just a few percent or less from your buy point.
If you are already a member or are thinking of joining, feel free to email us with any questions. You might also first look at our extensive FAQs - Words Of Wisdom From The Market Battlefield and read through additional reports in our Report Archives to get a good understanding of how we trade.